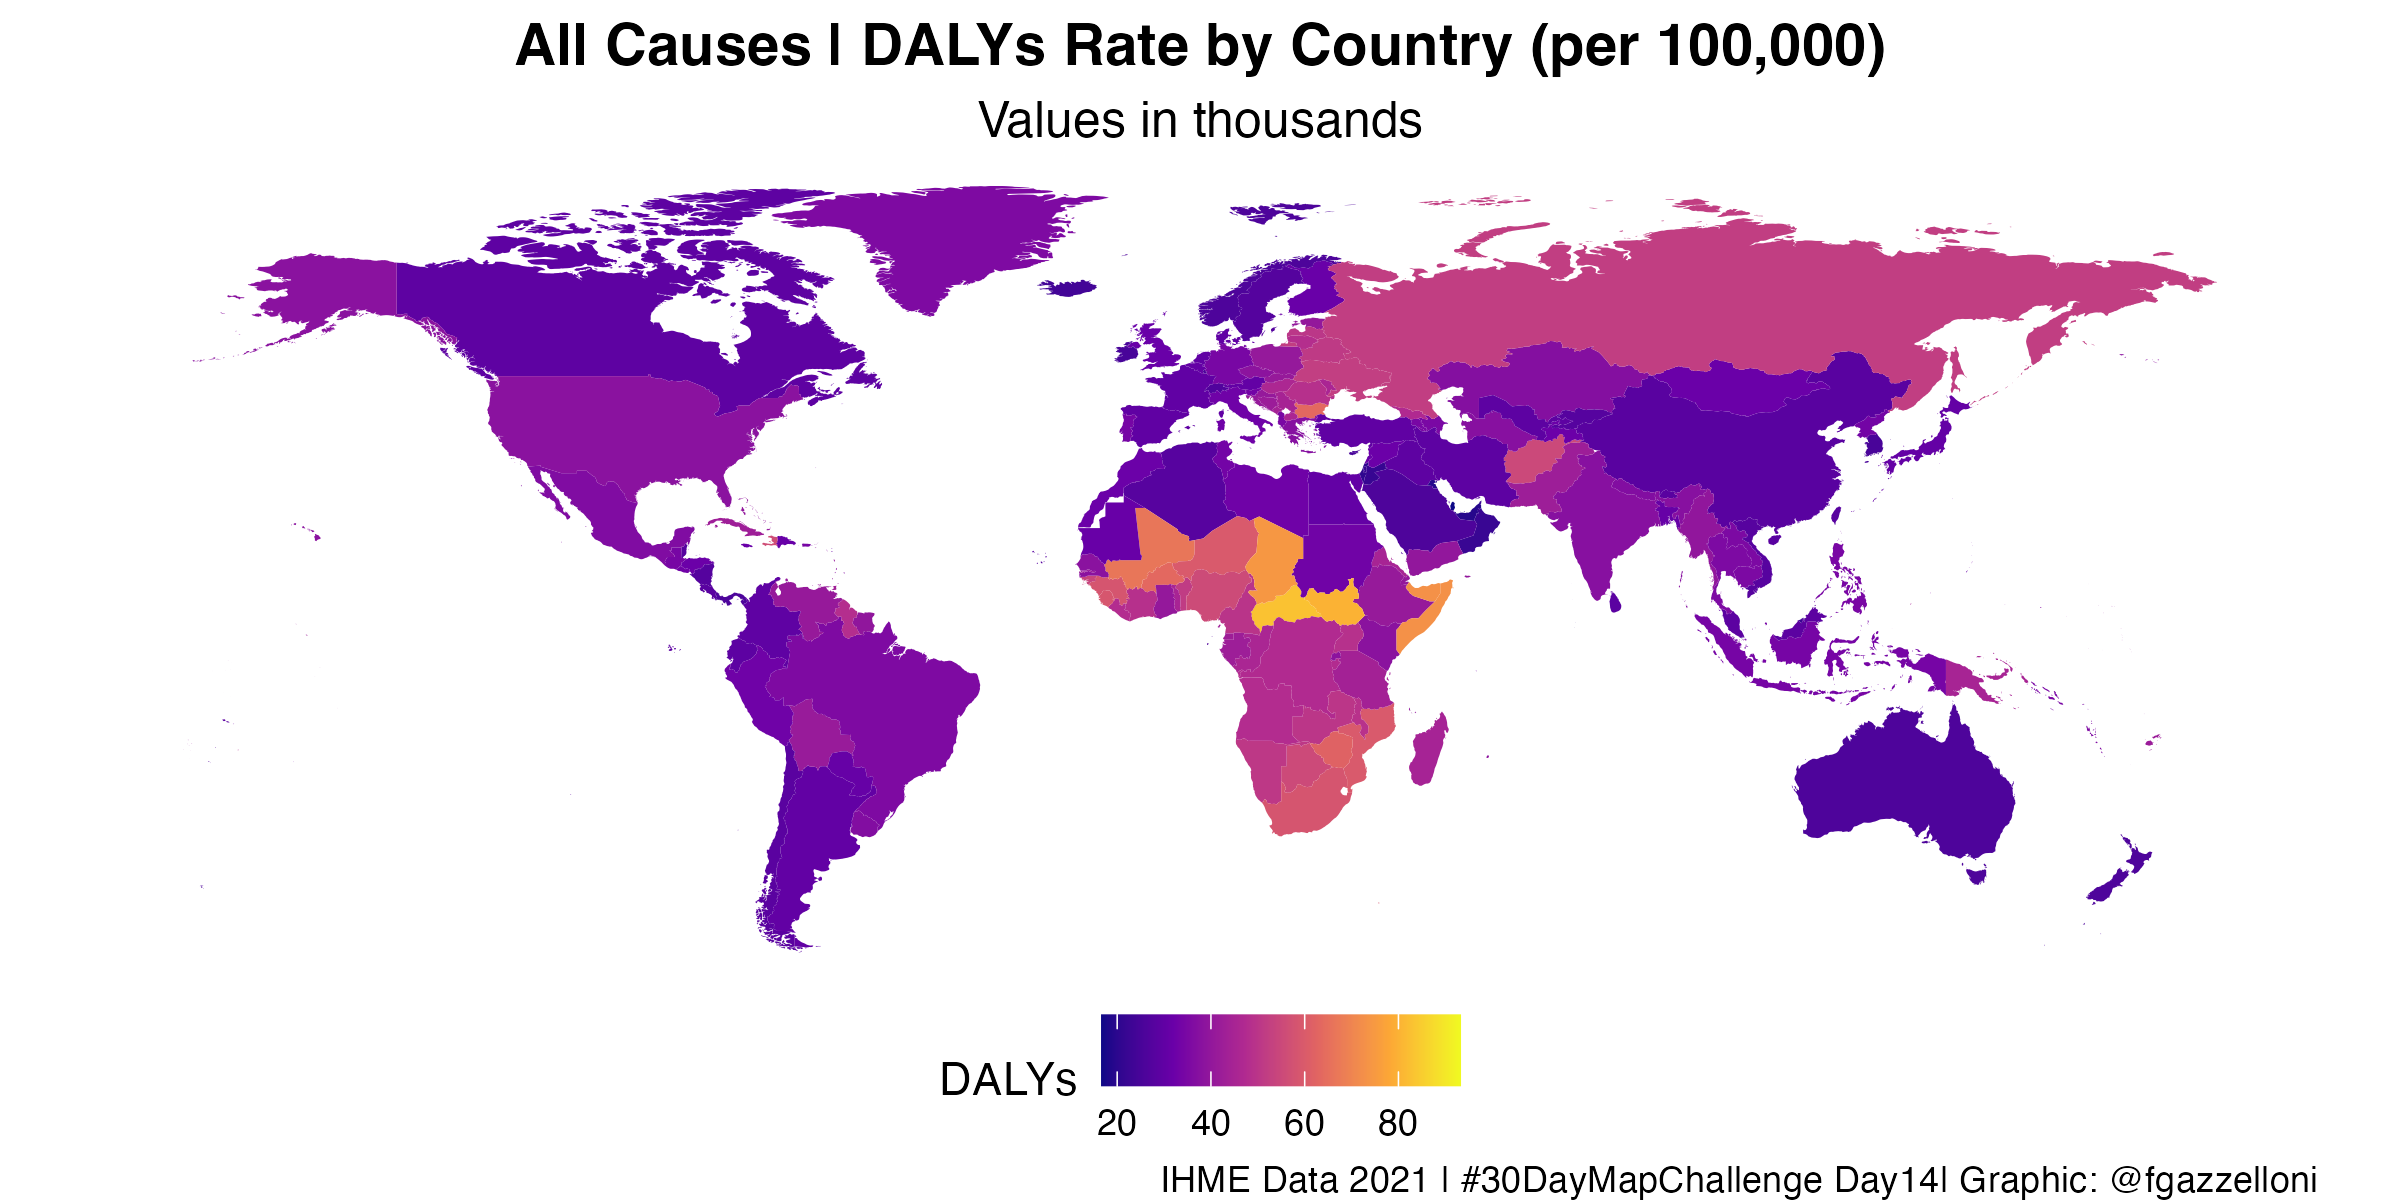
library(ggplot2)
dalys_country_comparison %>%
ggplot(mapping=aes(x=long, y=lat,fill = value, map_id = location)) +
  geom_polygon(aes(group=group)) +
  # change the values of the fill scale
  scale_fill_viridis_c(option = "plasma",
                       labels = scales::number_format(scale = 1e-3),
                       name = "DALYs") +
  expand_limits(x = dalys_country_comparison$long,
                y = dalys_country_comparison$lat) +
  coord_sf() +
  labs(title = "All Causes | DALYs Rate by Country (per 100,000)",
       subtitle = "Values in thousands",
       caption = "IHME Data 2021 | #30DayMapChallenge Day14| Graphic: @fgazzelloni") +
  theme_void() +
  theme(legend.position = "bottom",
        plot.title = element_text(size = 14,
                                  hjust = 0.5,
                                  face = "bold"),
        plot.subtitle = element_text(size = 12,
                                     hjust = 0.5))
Save as png
ggsave("day14_worldmap.png",
       bg = "white",
       width = 8, height = 4)