library(ggplot2)
library(maps)Overview
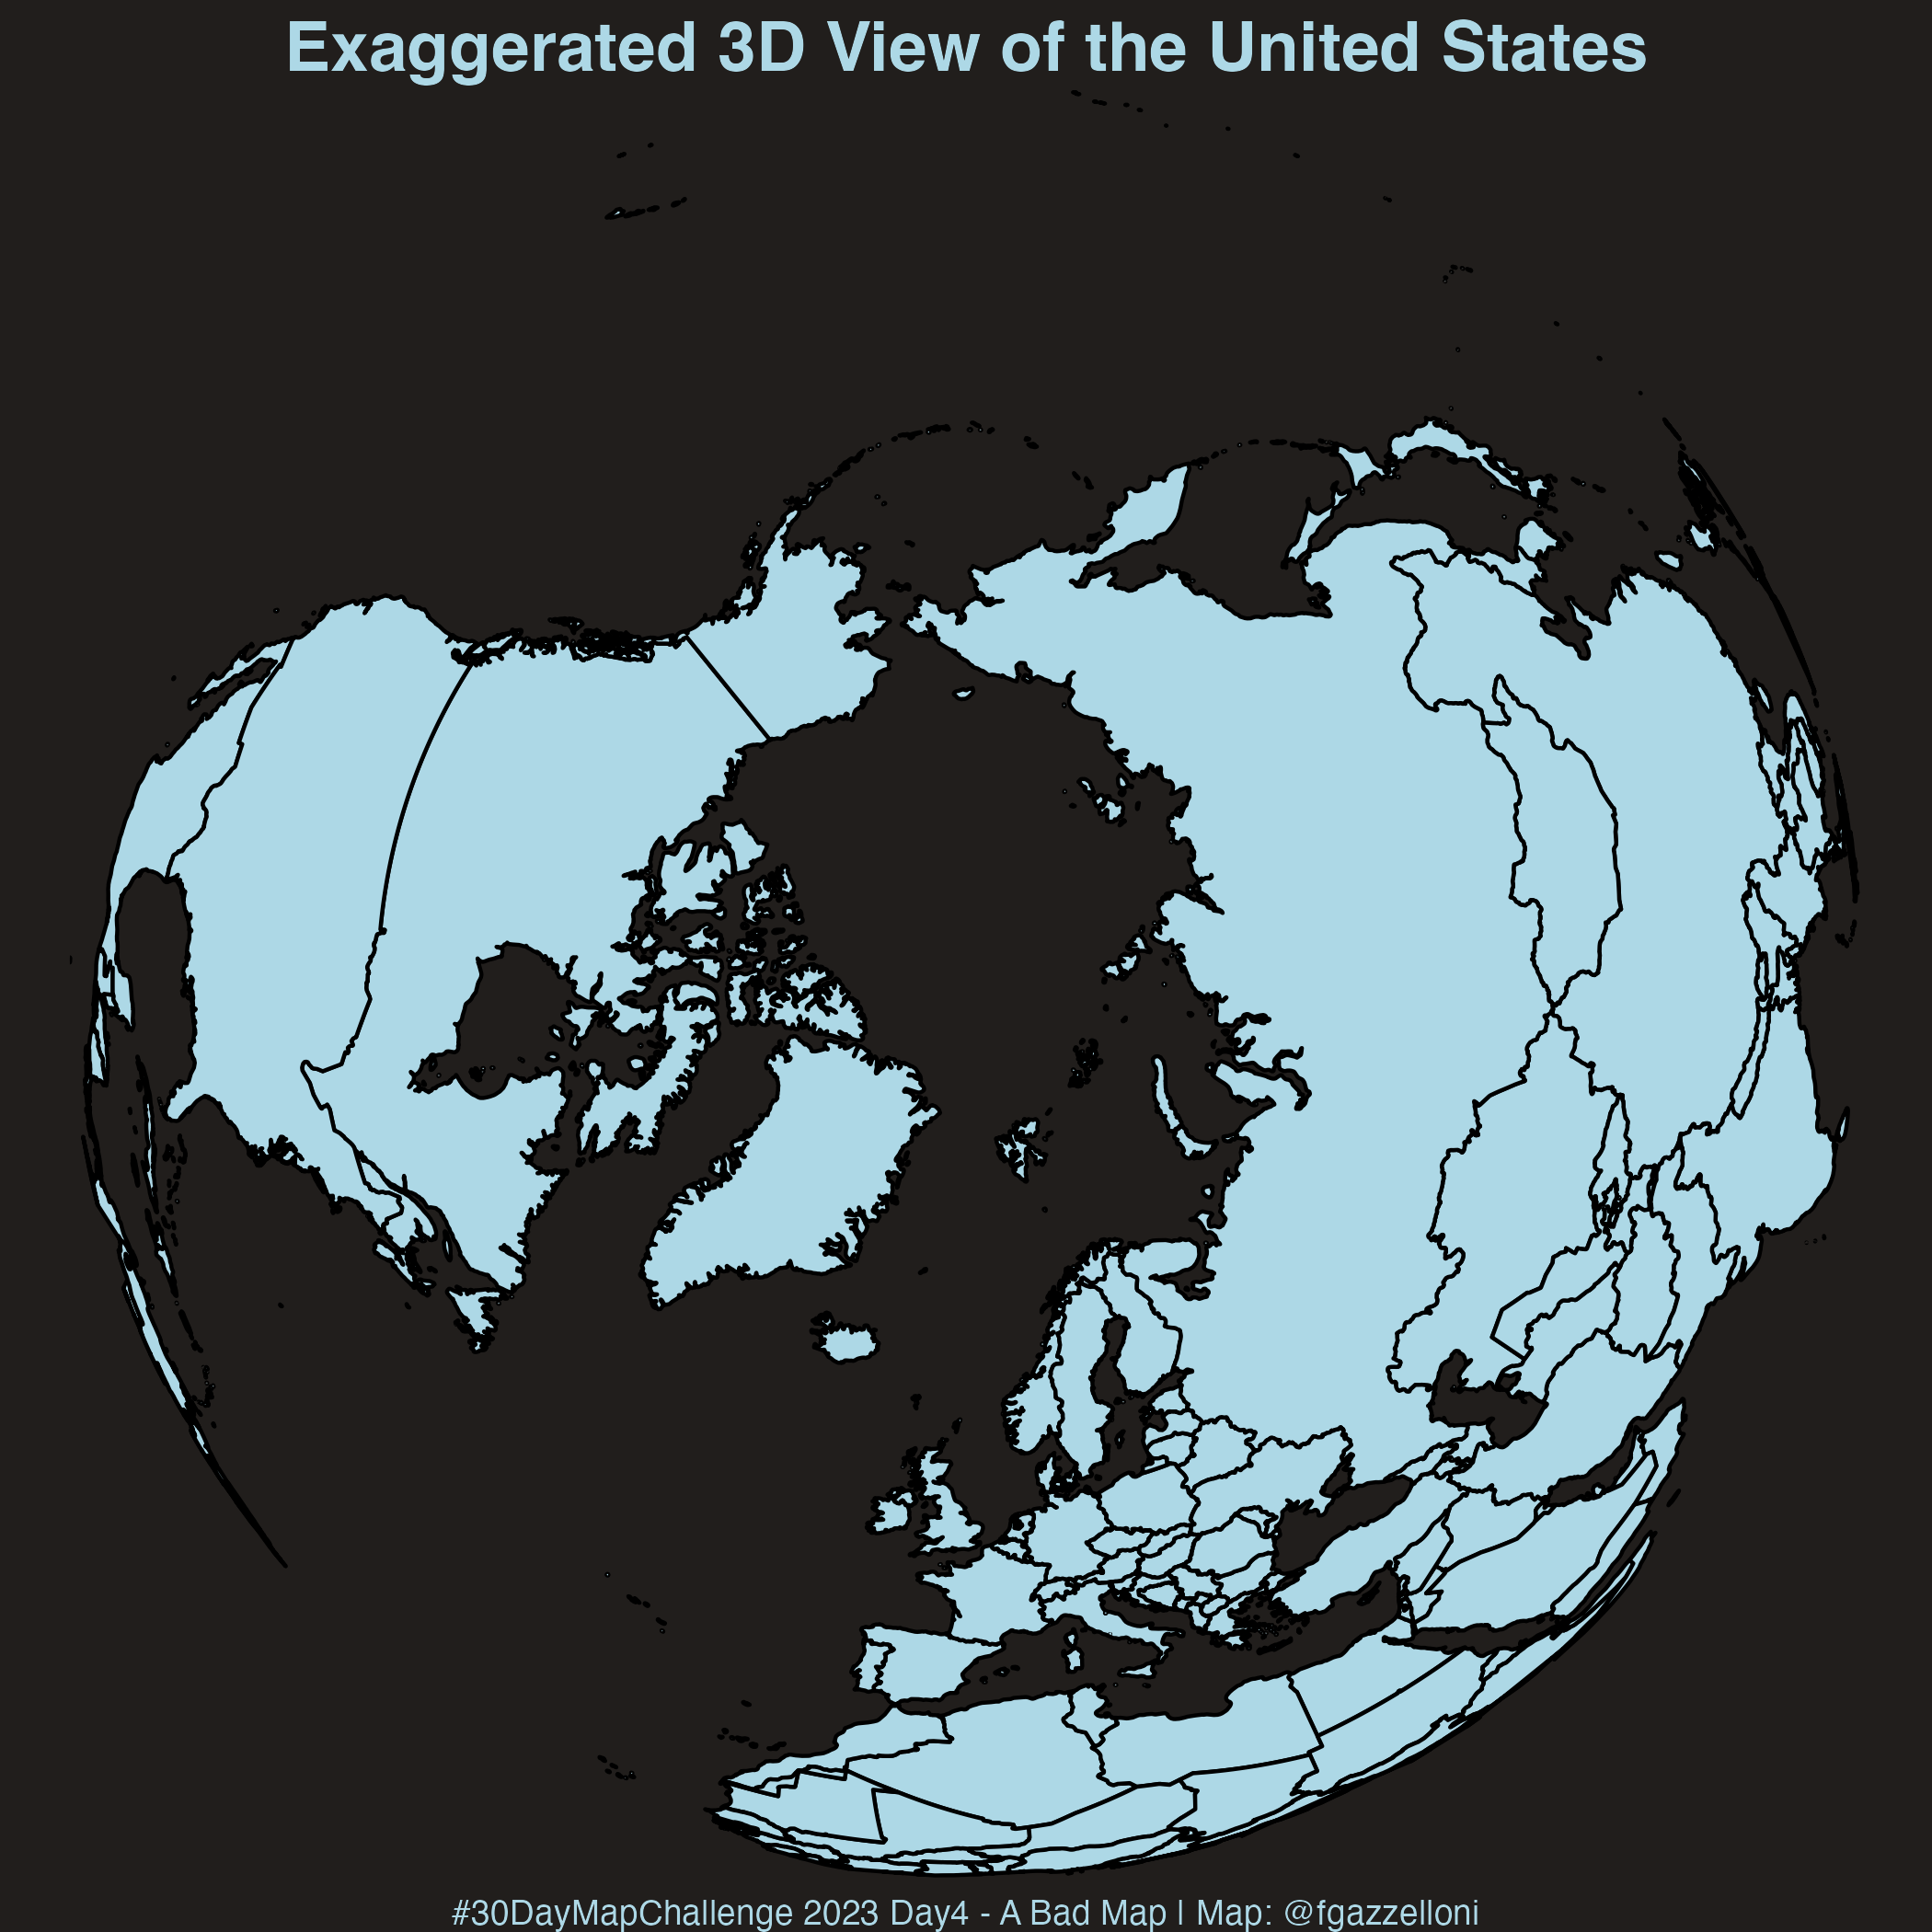
A Bad Map Exaggerated 3D View of the United States
Load necessary libraries
Extract map data for the United States
us_map <- map_data("world")Create a “bad” map with exaggerated 3D view
ggplot(data = us_map,
       aes(x = long, y = lat, group = group)) +
  geom_polygon(fill = "lightblue", color = "black") +
  coord_map("ortho", orientation = c(90, 0, 0)) +
  labs(title = "Exaggerated 3D View of the United States",
       caption="#30DayMapChallenge 2023 Day4 - A Bad Map | Map: @fgazzelloni")+
  theme_void() +
    theme(text=element_text(color="lightblue"),
          plot.title = element_text(face="bold",size=18,hjust=0.5),
plot.caption = element_text(size=9,hjust=0.5))ggsave("day4_a_bad_map.png",bg="#211e1c")