library(tidyverse)
library(sf)Overview
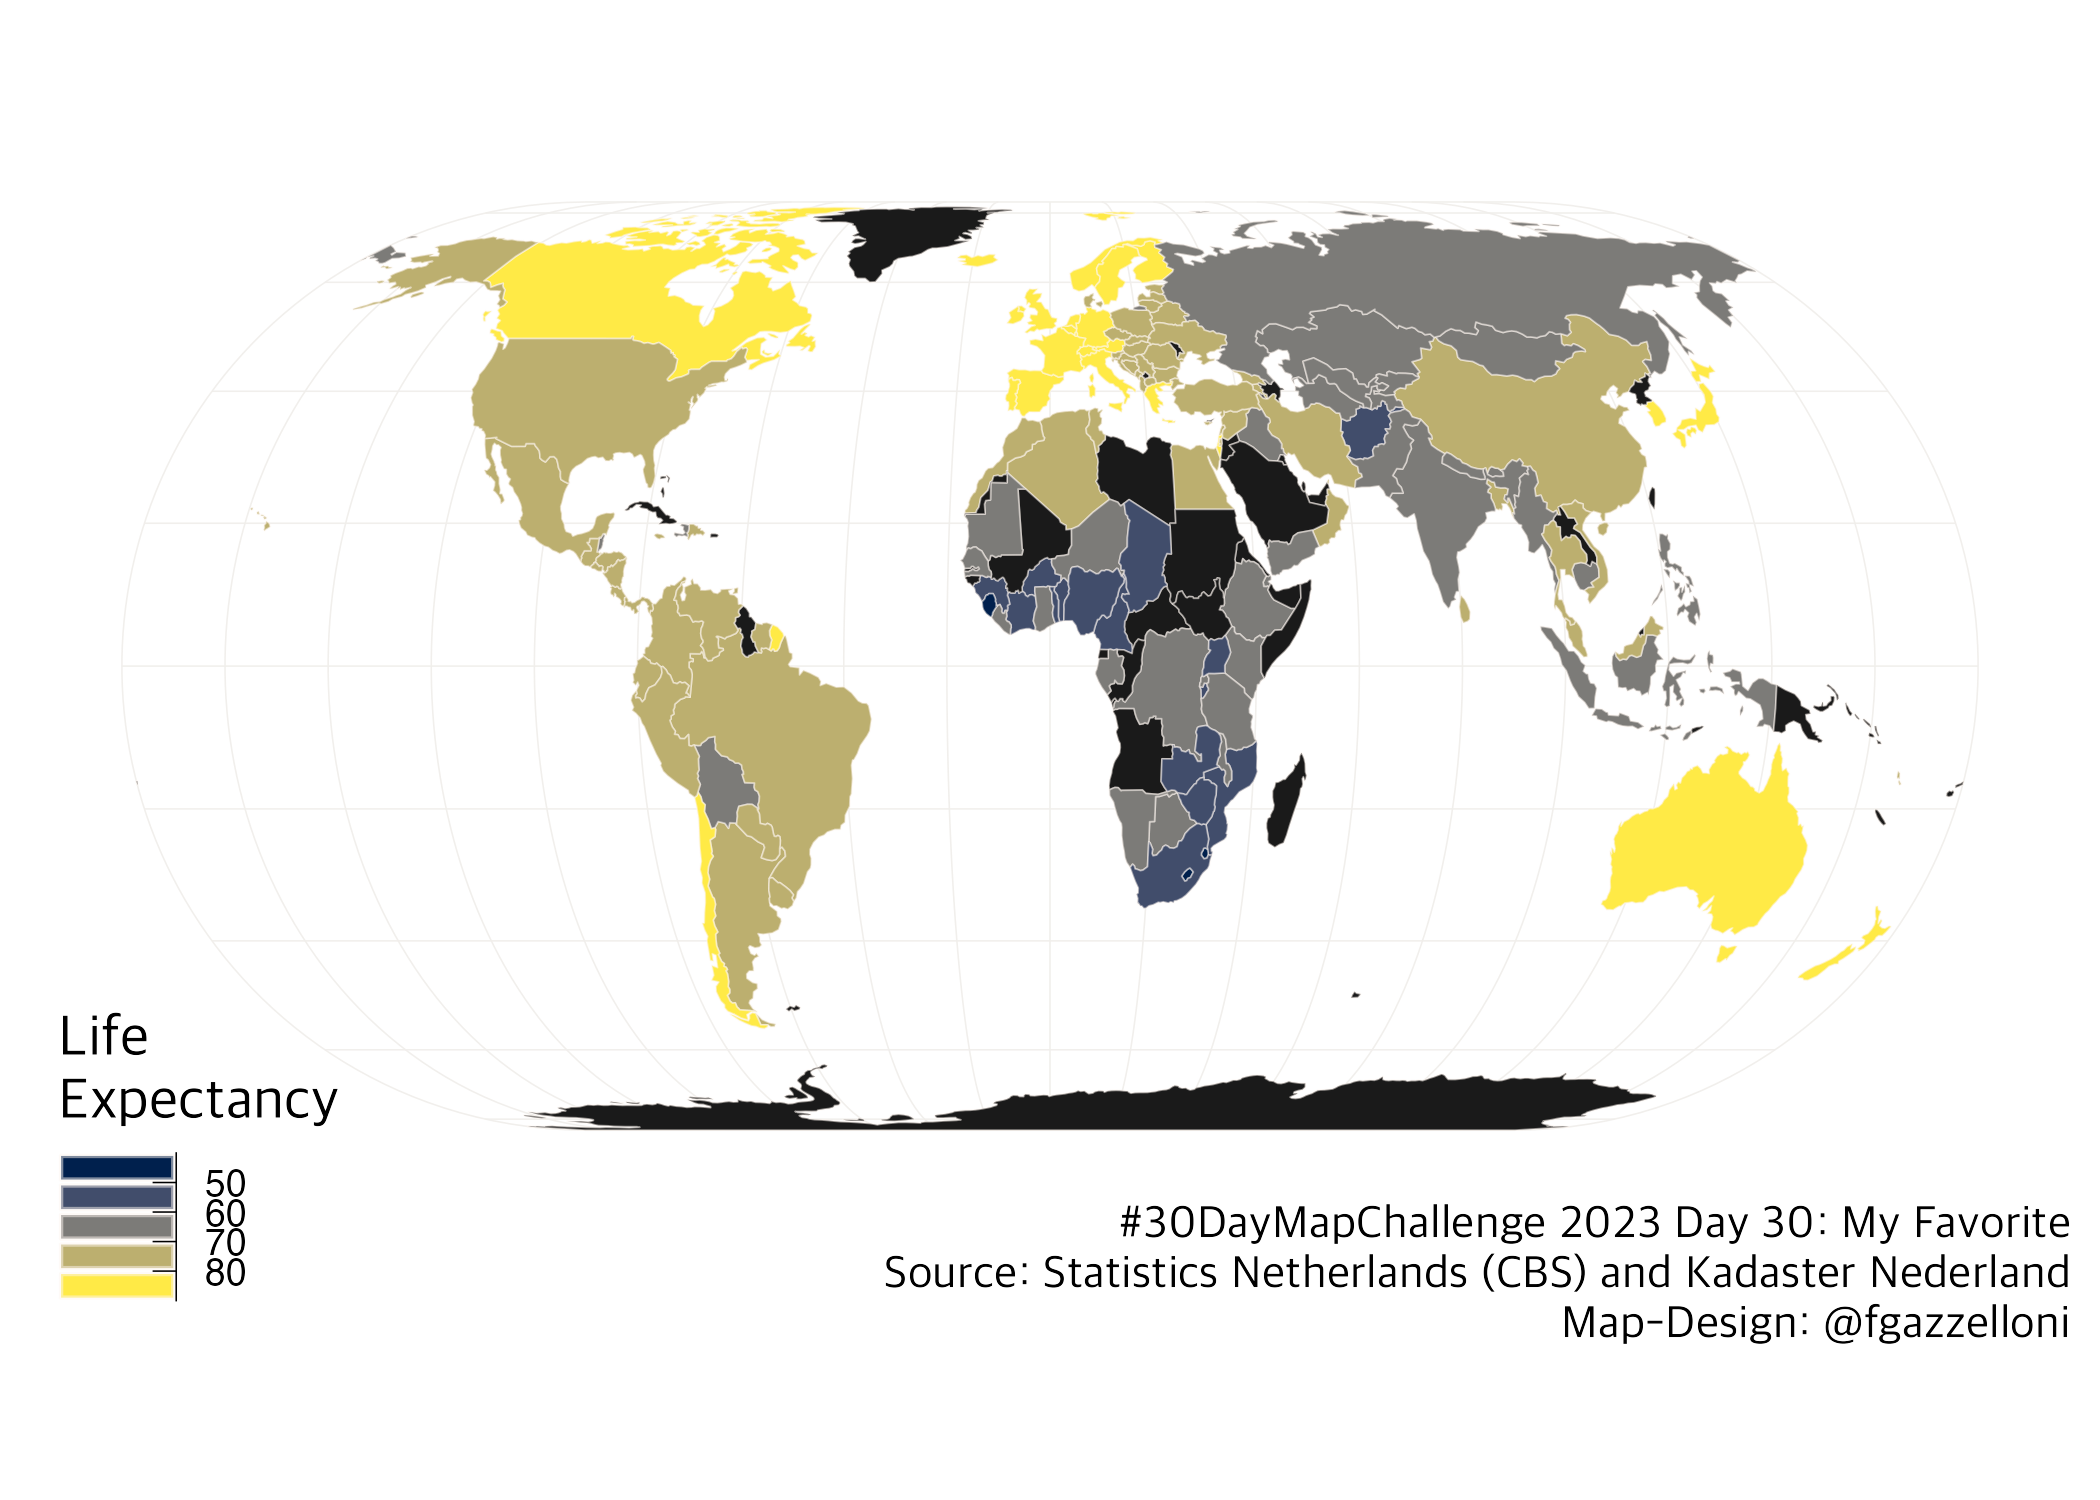
This last map of the #30DayMapChallenge month is my favourite view of the life expectancy. Source of data are Statistics Netherlands (CBS) and Kadaster Nederland via the {tmap} package, tmap::data("World").
library(tmap)
data("World")life_exp<-World%>%
select(life_exp)Build the graticule and select a projection. Use the {rgdal} package with: projInfo(type = "proj") to see the various options.
grat <- st_graticule(lat = c(-89.9, seq(-80, 80, 20), 89.9))
ggplot()+
    geom_sf(data= grat,
            mapping=aes(geometry=geometry),
            col=alpha("#f0eeeb",0.95),
            lwd=0.18
)library(rgdal)
projInfo(type = "proj")%>%headggplot()+
geom_sf(data= grat,
mapping=aes(geometry=geometry),
col=alpha("#f0eeeb",0.95),
lwd=0.18)+
coord_sf(crs='+proj=eck4')ggplot()+
geom_sf(data= grat,
mapping=aes(geometry=geometry),
col=alpha("#f0eeeb",0.95),
lwd=0.18
)+
geom_sf(data= life_exp,
mapping=aes(fill=life_exp,geometry=geometry),
color=alpha("#fdf6f0",0.5)
)+
guides(
fill=guide_bins(
title.position = 'top',
title.hjust = 0,
label.theme = element_text(size=9.1),
keywidth = unit(1,'cm'),
keyheight = unit(0.25,'cm')))+
scale_fill_viridis_b(
option='cividis',
na.value = "grey10")+
labs(fill="Life\nExpectancy",
caption="#30DayMapChallenge 2023 Day 30: My Favorite\nSource: Statistics Netherlands (CBS) and Kadaster Nederland\nMap-Design: @fgazzelloni")+
coord_sf(crs='+proj=eck4')+
#coord_sf(crs='+proj=lask')+
ggthemes::theme_map(base_size = 14,base_family = "Apple SD Gothic Neo")+
theme(legend.position = c(0,-0.15),
legend.background = element_blank())ggsave("day30_myfavorite.png",
bg="white",width=7,height = 5)