library(tidyverse)
library(WDI)
library(spData)
library(rworldmap)
library(sf)Overview
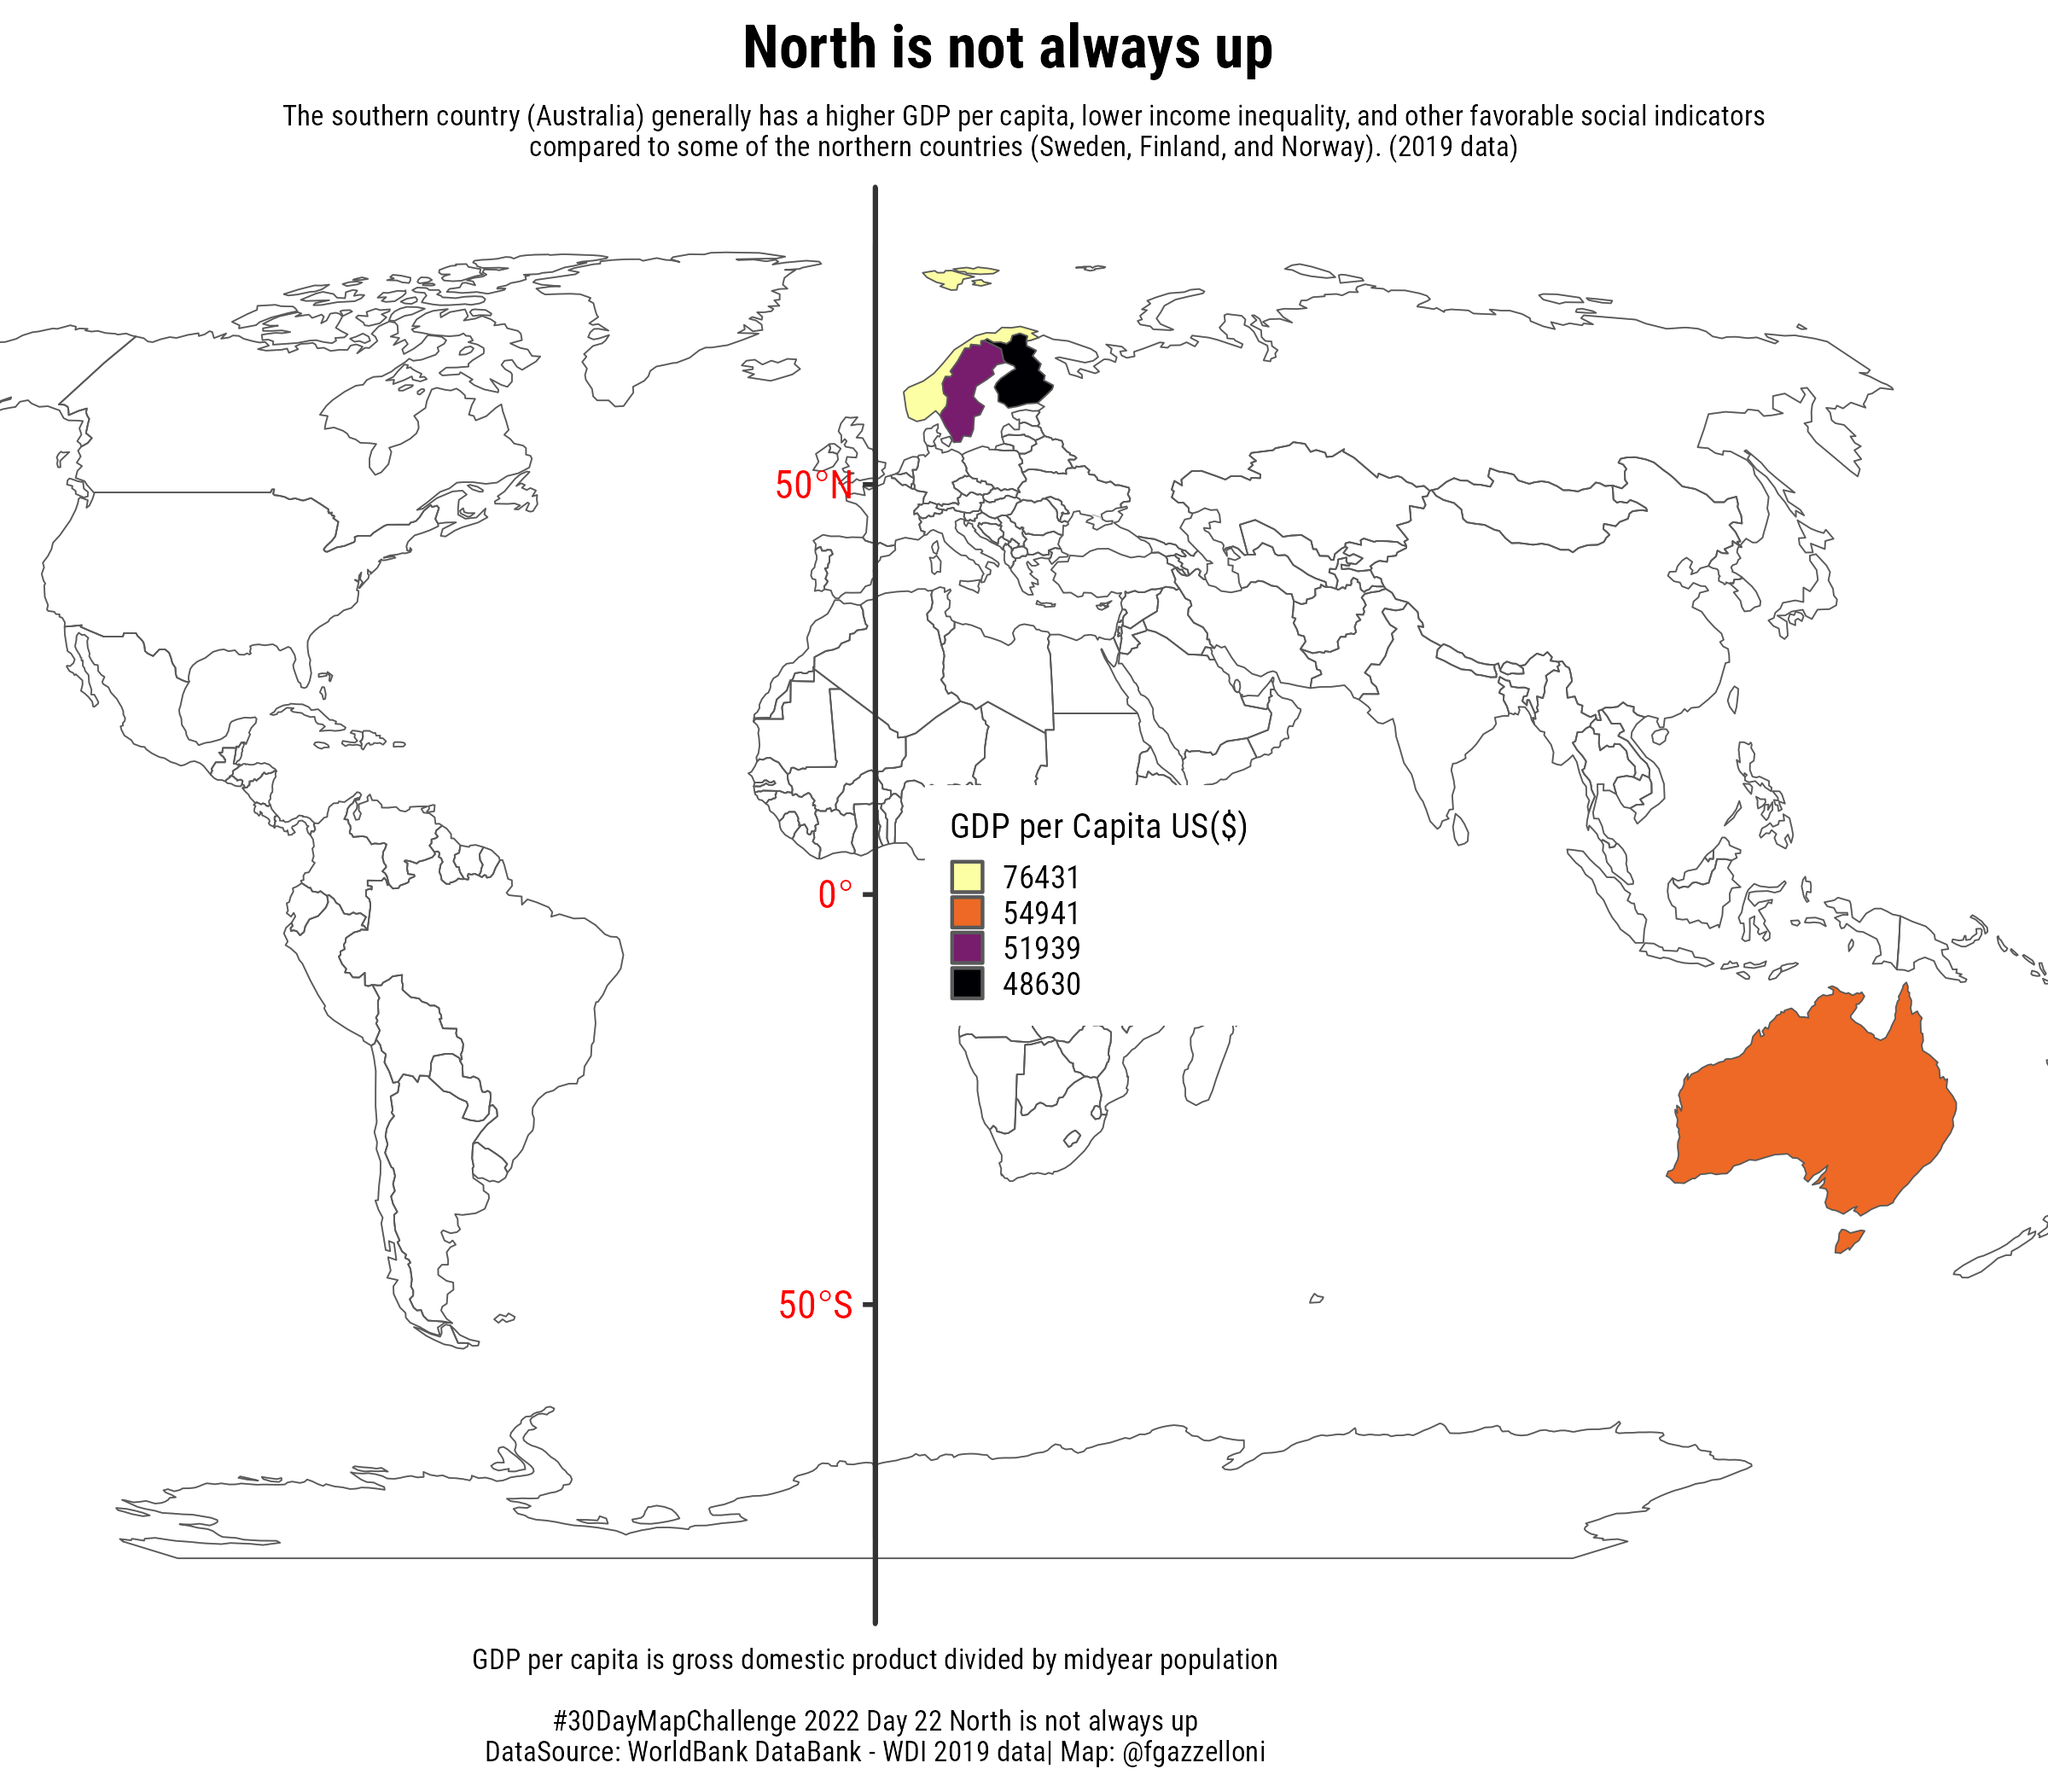
This Map represent four countries with diverse GDP. One in the south side of the earth, Australia has a higher GDP value compared to northern side countries. Data is from the Worldbank database.
- Southern Country:
Australia - Northern Countries:
Sweden,Finland, andNorway
These countries are geographically located in the northern hemisphere. When comparing certain economic and social indicators, it’s worth noting that the southern country (Australia) generally has a higher GDP per capita, lower income inequality, and other favorable social indicators compared to some of the northern countries (Sweden, Finland, and Norway).
countries <- c("SWE", "FIN", "NOR", "AUS")
indicators <- c("NY.GDP.PCAP.CD", "SI.POV.GINI", "SE.ADT.LITR.ZS", "SH.XPD.CHEX.PC.CD")

# Retrieve data
data <- WDI(country = countries,
            indicator = indicators,
start = 2019, end = 2019, extra = TRUE)world_geo<- spData::world%>%
dplyr::select(iso_a2,geom)
all_data <- world_geo %>%
left_join(data,by=c("iso_a2"="iso2c"))%>%
mutate(gpd_country=paste0(NY.GDP.PCAP.CD,",",country))library(mapview)
#library(lwgeom)
library(rnaturalearth)
world <- rnaturalearth::ne_countries(scale = 'small',
returnclass = 'sf')
# Fix polygons so they don't get cut in ortho projection
world <-st_cast(world,'MULTILINESTRING') %>%
st_cast('LINESTRING', do_split=TRUE) %>%
mutate(npts = mapview::npts(geometry, by_feature = TRUE)) %>%
st_cast('POLYGON')# map
ggplot() +
geom_sf(data=world, color="gray80",fill=NA) +
geom_sf(data=all_data,mapping=aes(fill=NY.GDP.PCAP.CD))+
coord_sf( crs= "+proj=ortho +lat_0=20 +lon_0=-10") ggplot() +
geom_sf(data=world, color="gray80",fill=NA)+
geom_sf(data=all_data,mapping=aes(fill=NY.GDP.PCAP.CD))+
coord_sf(crs="ESRI:54030")+
theme_bw()sf::st_bbox(world)sf::st_bbox(all_data)text=tibble(text=c("The southern country (Australia) generally has a higher GDP per capita, lower income inequality, and other favorable social indicators\ncompared to some of the northern countries (Sweden, Finland, and Norway)."))ggplot() +
geom_sf(data=world, color="gray80",fill=NA) +
geom_sf(data=all_data,
mapping=aes(fill=factor(round(NY.GDP.PCAP.CD))))+
scale_fill_manual(
na.value = "grey90",
values = (viridis::inferno(4)),
na.translate = FALSE,
guide = guide_legend(reverse = TRUE)
) +
# this restricts the map view
scale_x_continuous(limits = c(-10,20))+
coord_sf(crs="ESRI:54030",clip = "off")+
labs(fill="GDP per Capita US($)",
title="North is not always up",
subtitle=text$text,
caption="GDP per capita is gross domestic product divided by midyear population\n\n#30DayMapChallenge 2022 Day 22 North is not always up\nDataSource: WorldBank DataBank - WDI 2019 data| Map: @fgazzelloni")+
theme_bw(base_size = 14,base_family = "Roboto Condensed")+
theme(axis.text = element_text(color="red"),
axis.title = element_blank(),
plot.title.position = "plot",
plot.title = element_text(hjust=1,face="bold"),
plot.subtitle = element_text(size=8,hjust=0.5),
plot.caption = element_text(size=8,hjust = 0.5),
legend.key.size = unit(10,units = "pt"),
legend.text = element_text(size=9),
legend.title = element_text(size=10))ggsave("day22_day22_north-is-not-always-up.png",
width=8)