library(tidyverse)
library(sf)Overview
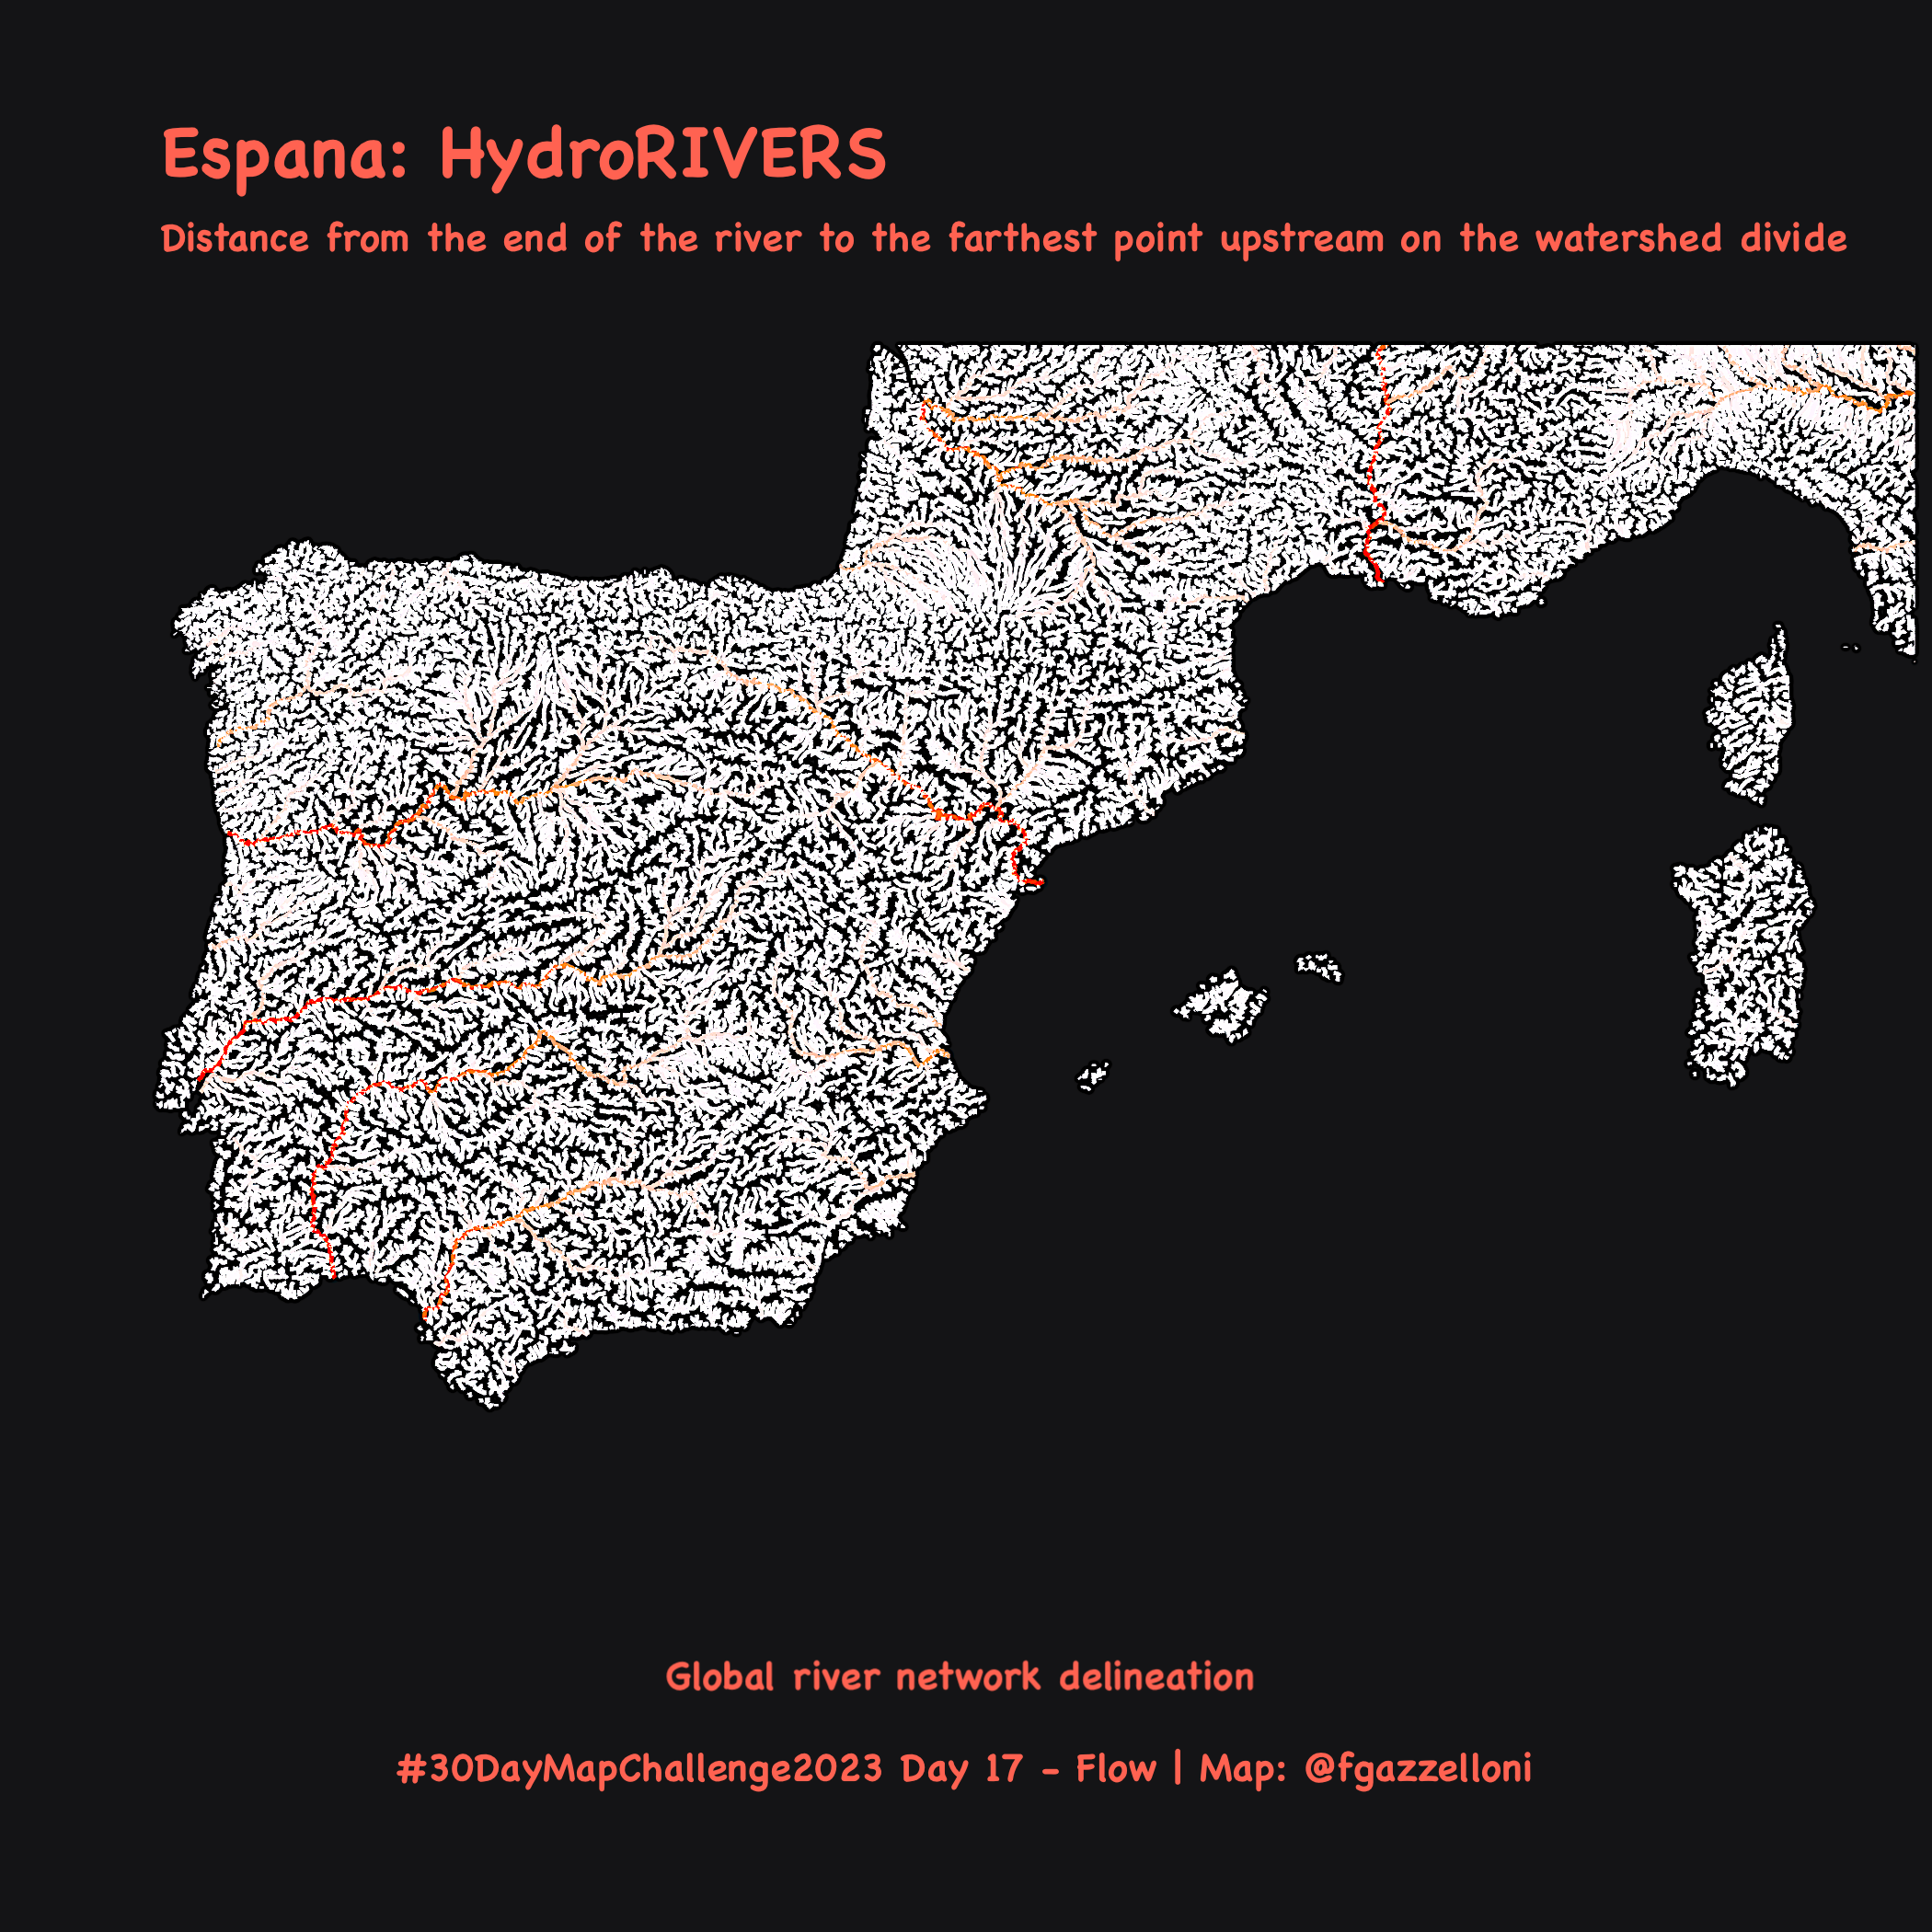
This map of the HydroRIVERS for the Iberia peninsula and surrounding areas is made coloring by the DIST_UP_KM.
rivers <- read_sf("data/HydroRIVERS_v10_eu_shp")rivers%>%select(LENGTH_KM)%>%summary()ggplot()+
geom_sf(data=rivers,
linewidth=0.1,aes(color=DIST_DN_KM),
show.legend = F)+
scale_color_gradient(low = "white",high = "black")+
ggnewscale::new_scale_color()+
geom_sf(data=rivers,
linewidth=0.5,aes(color=DIST_UP_KM),
show.legend = F)+
scale_color_gradient(low = "white",high = "red")+
scale_y_continuous(limits = c(35,45))+
scale_x_continuous(limits = c(-10,10))+
ggthemes::theme_map()ggsave("day17_flow.png",bg="grey")