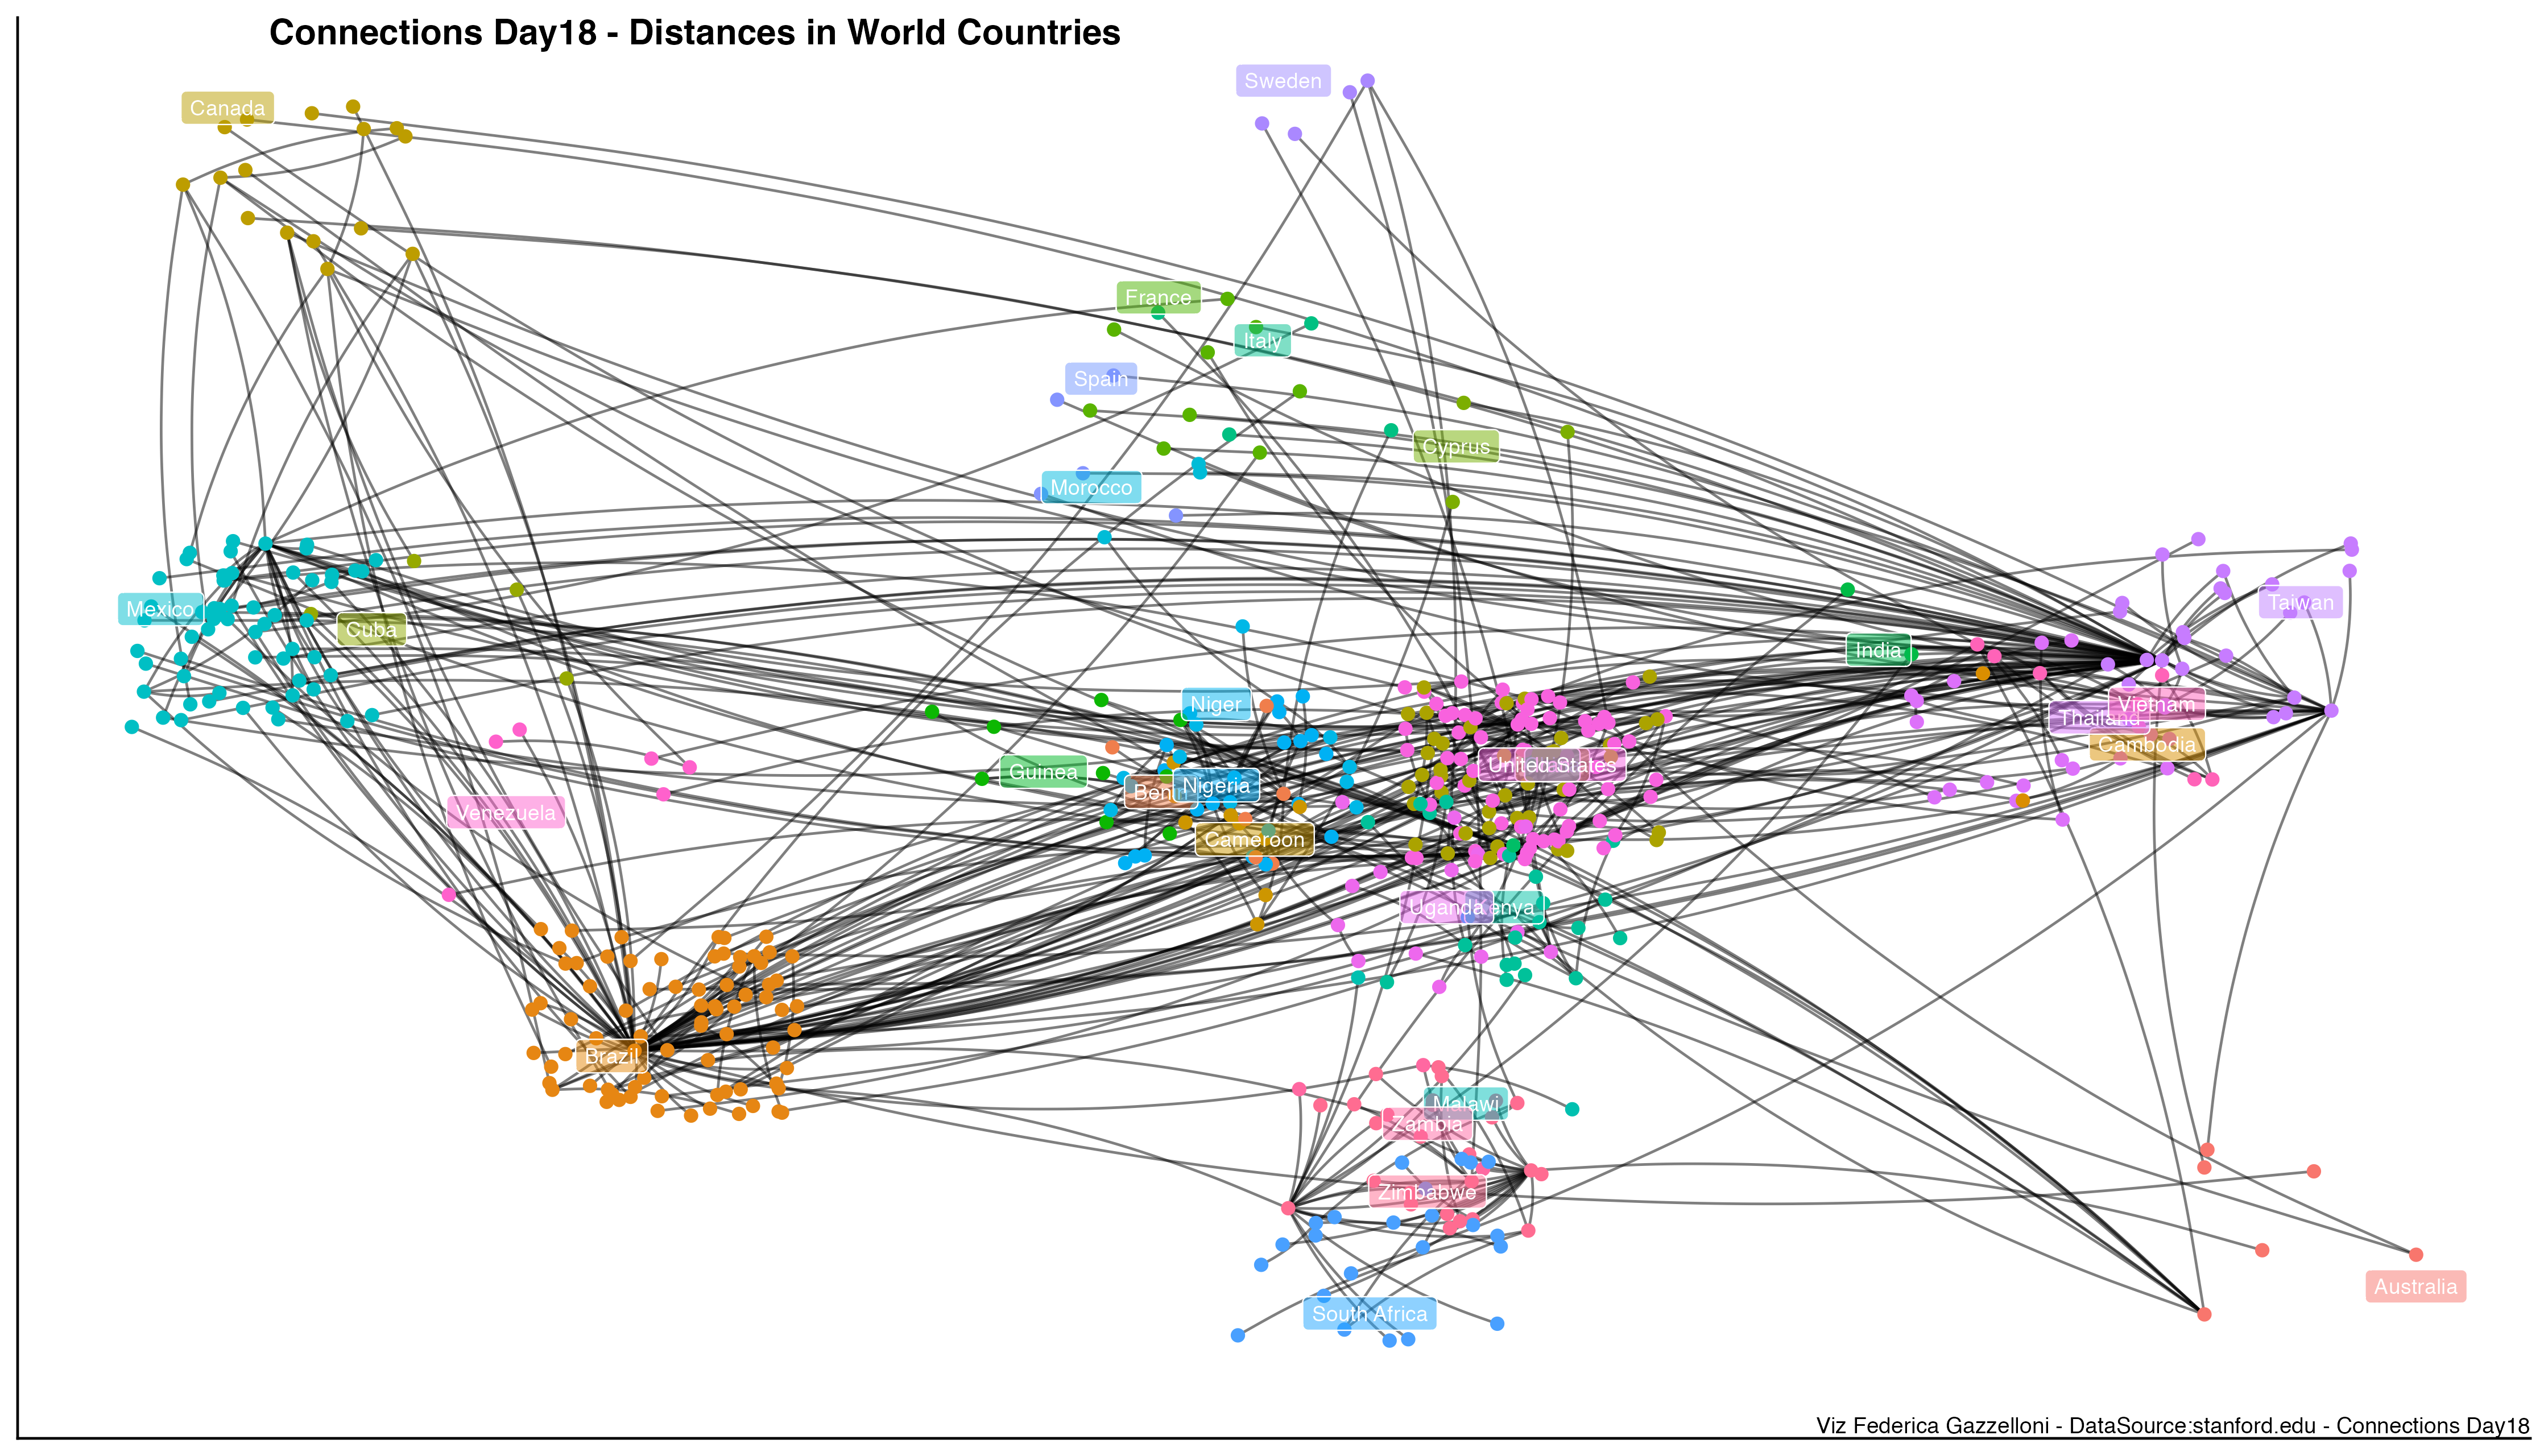
Networks
Slope
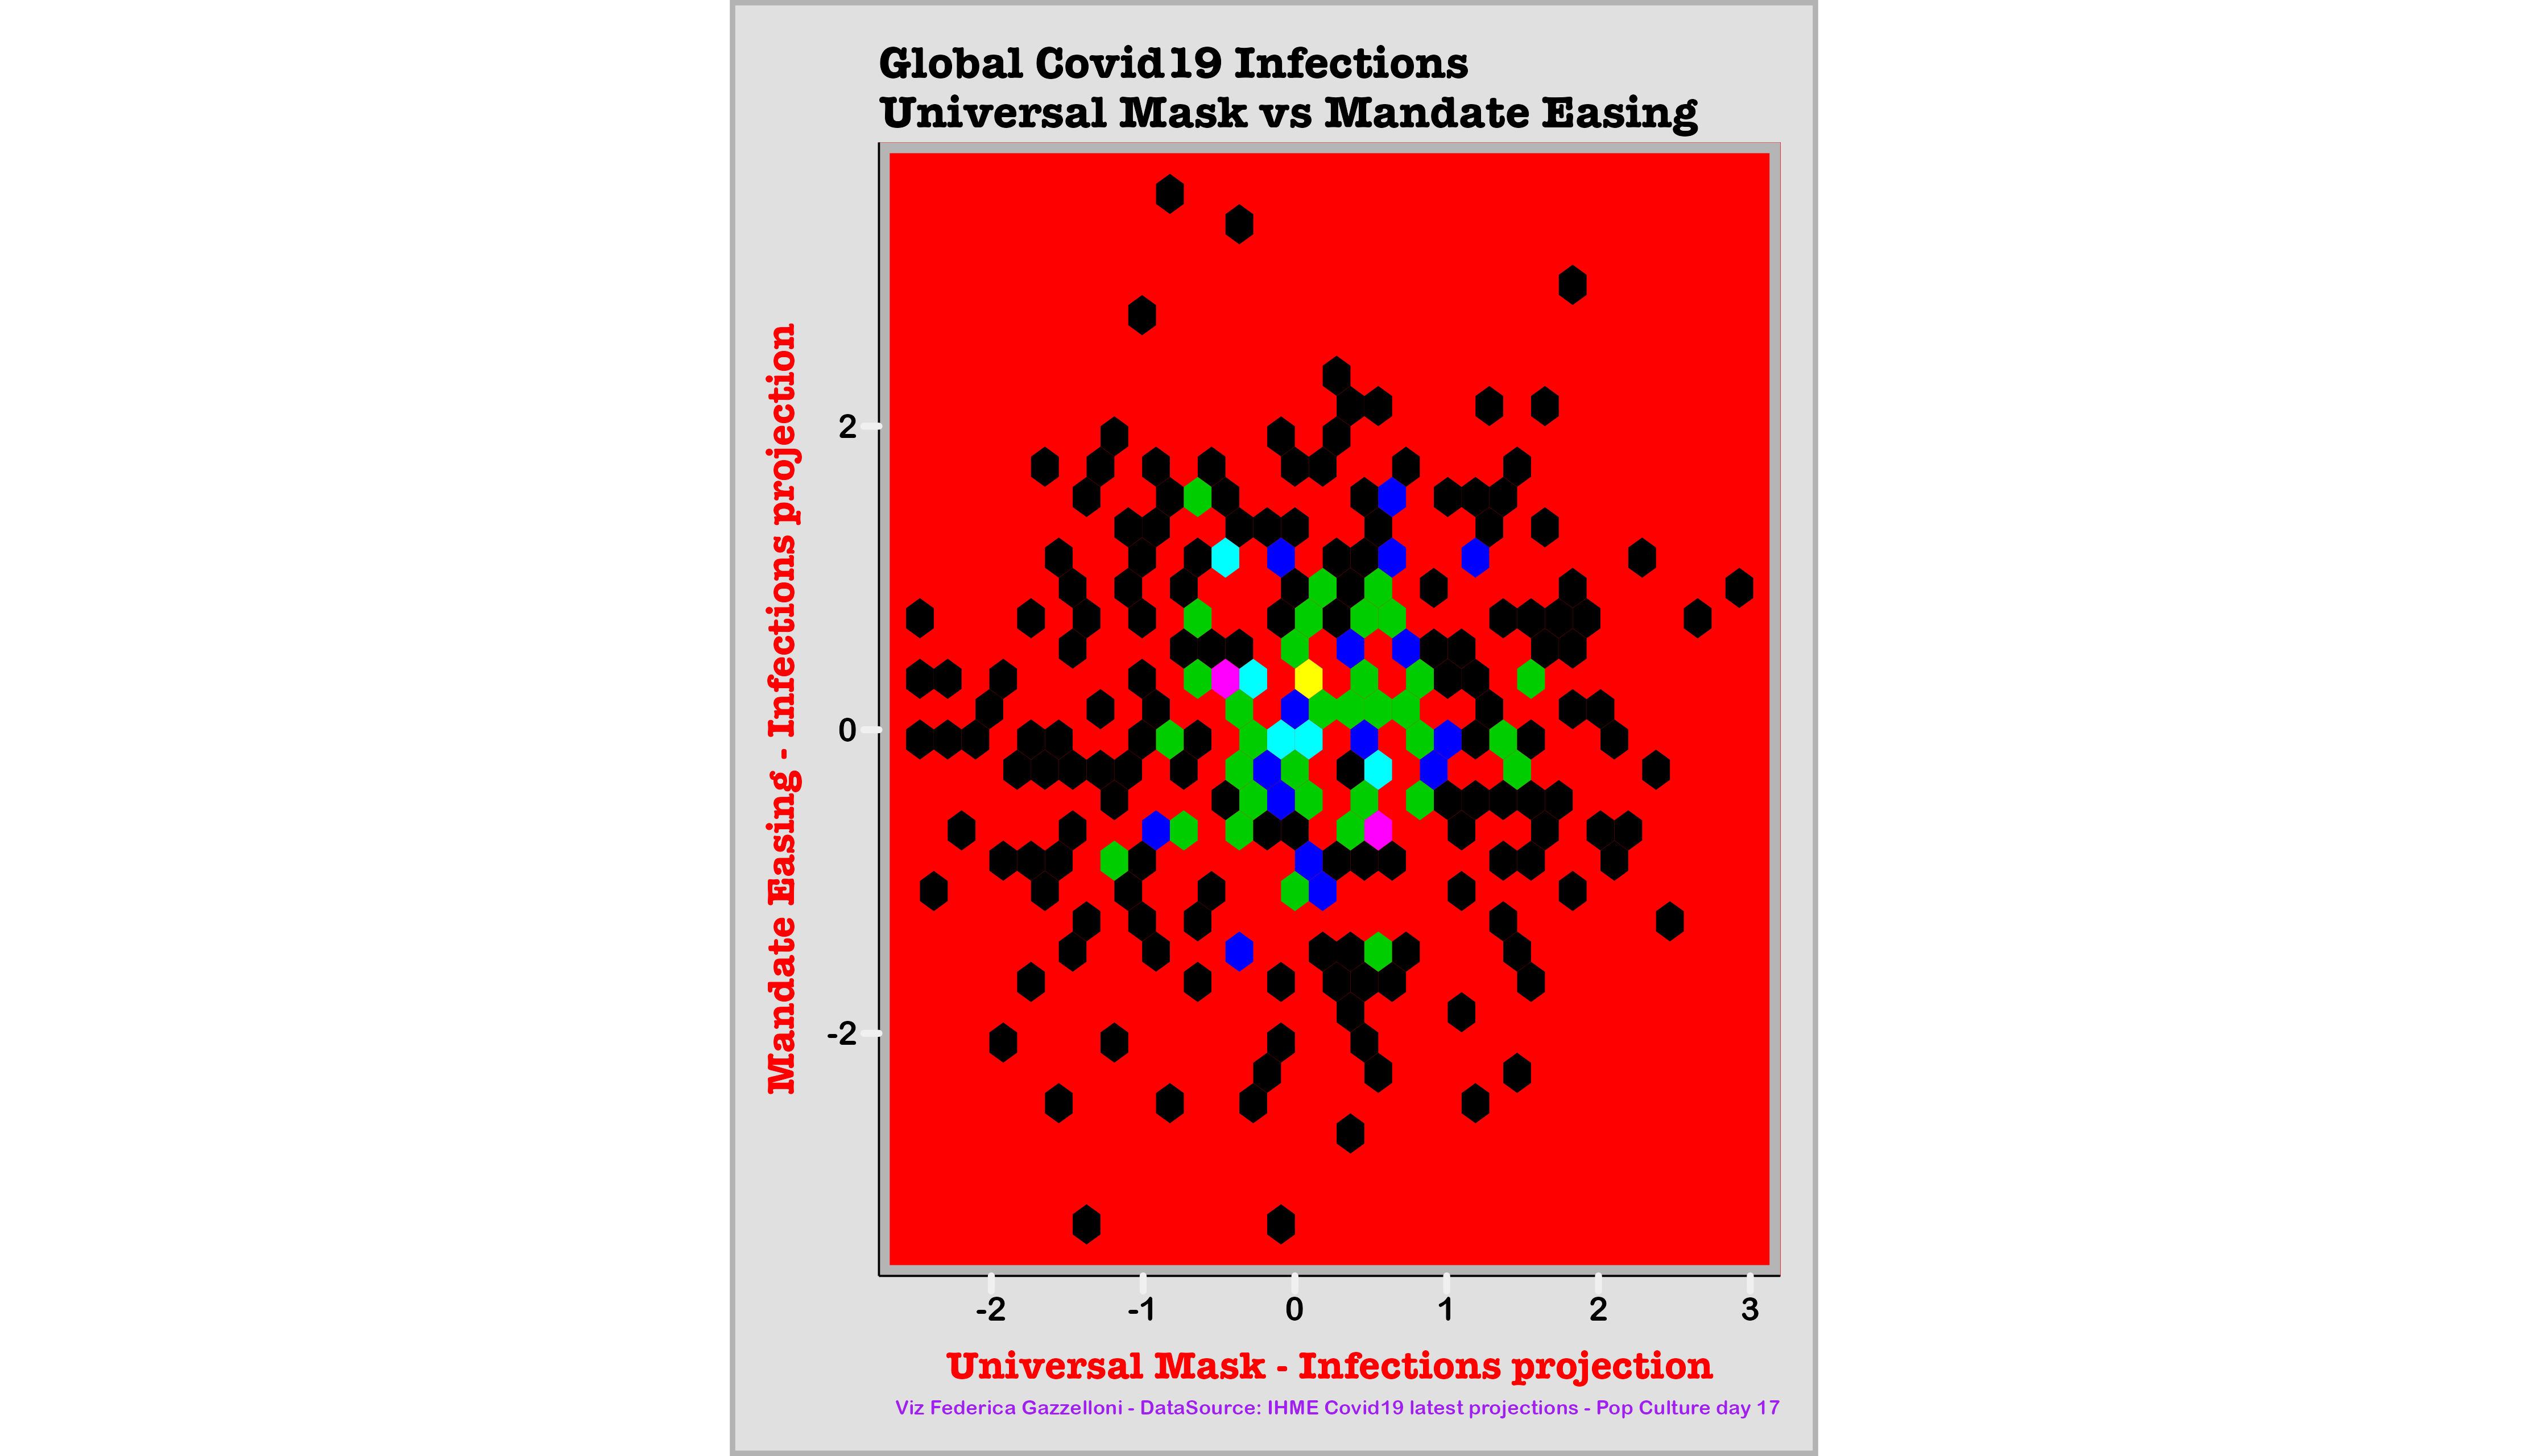
This plot explores the relationship between groups of countries with low covid19 deaths and their reported daily cases, using magical elements to highlight the theme of…
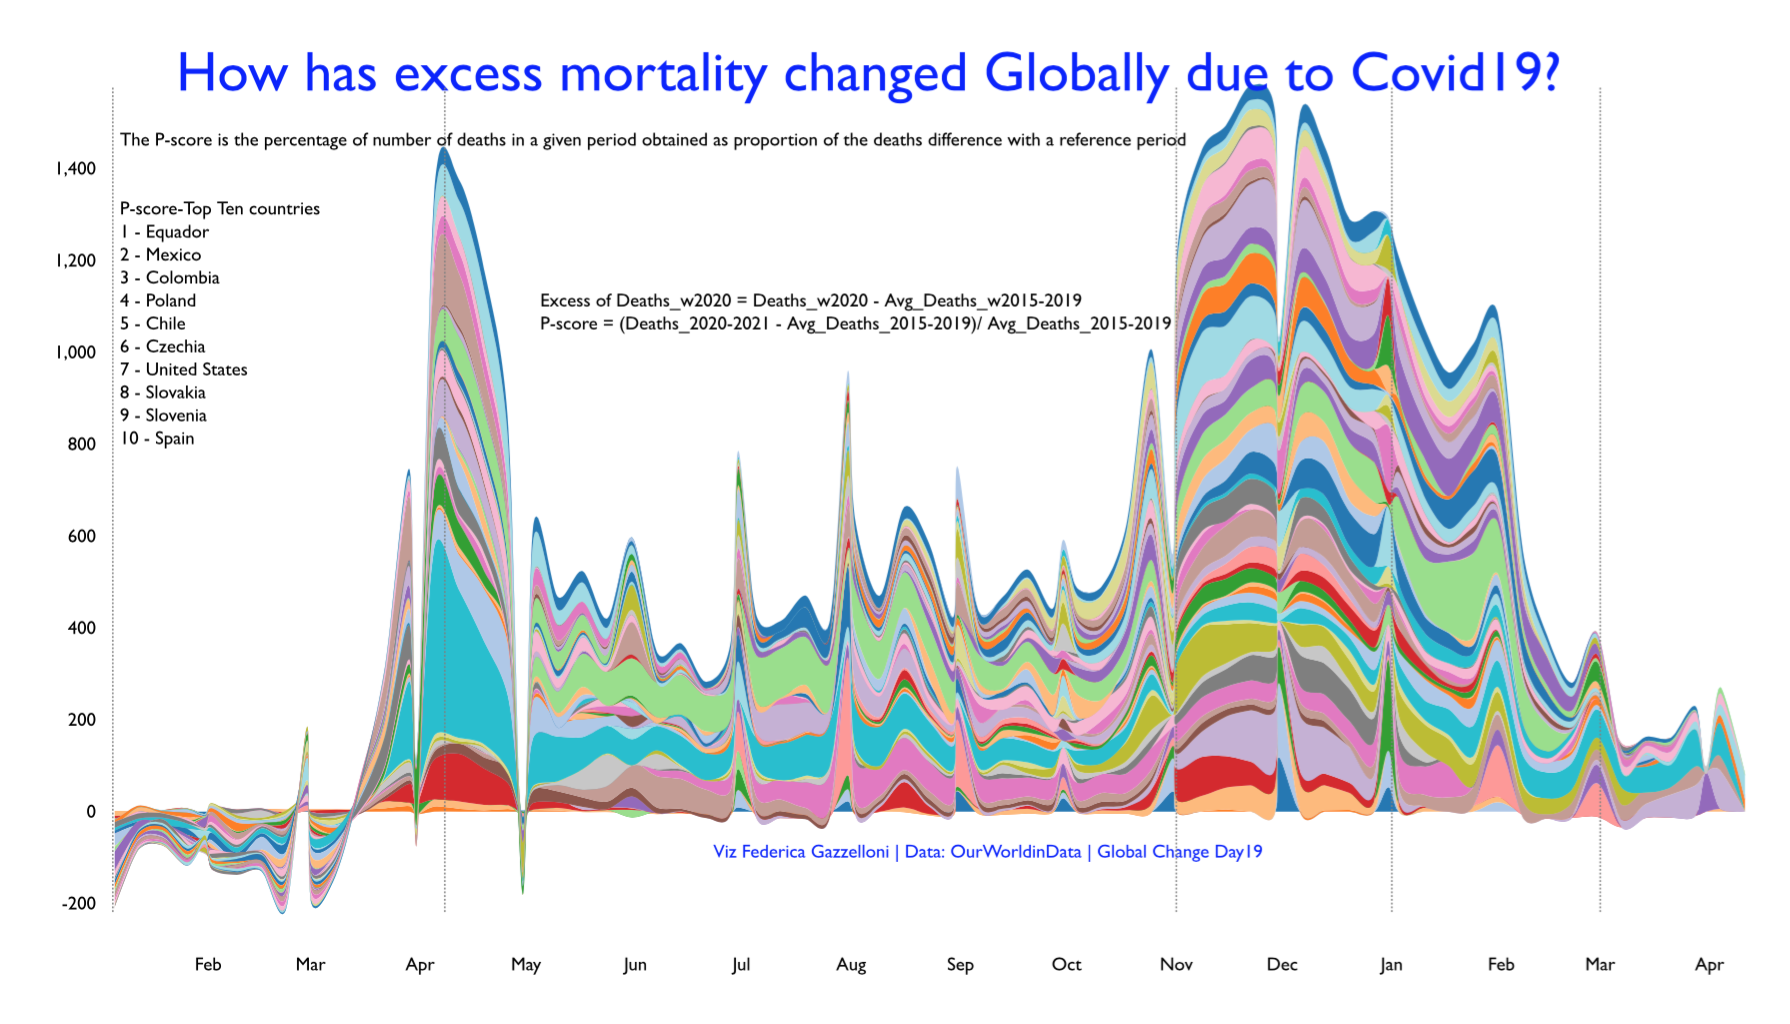
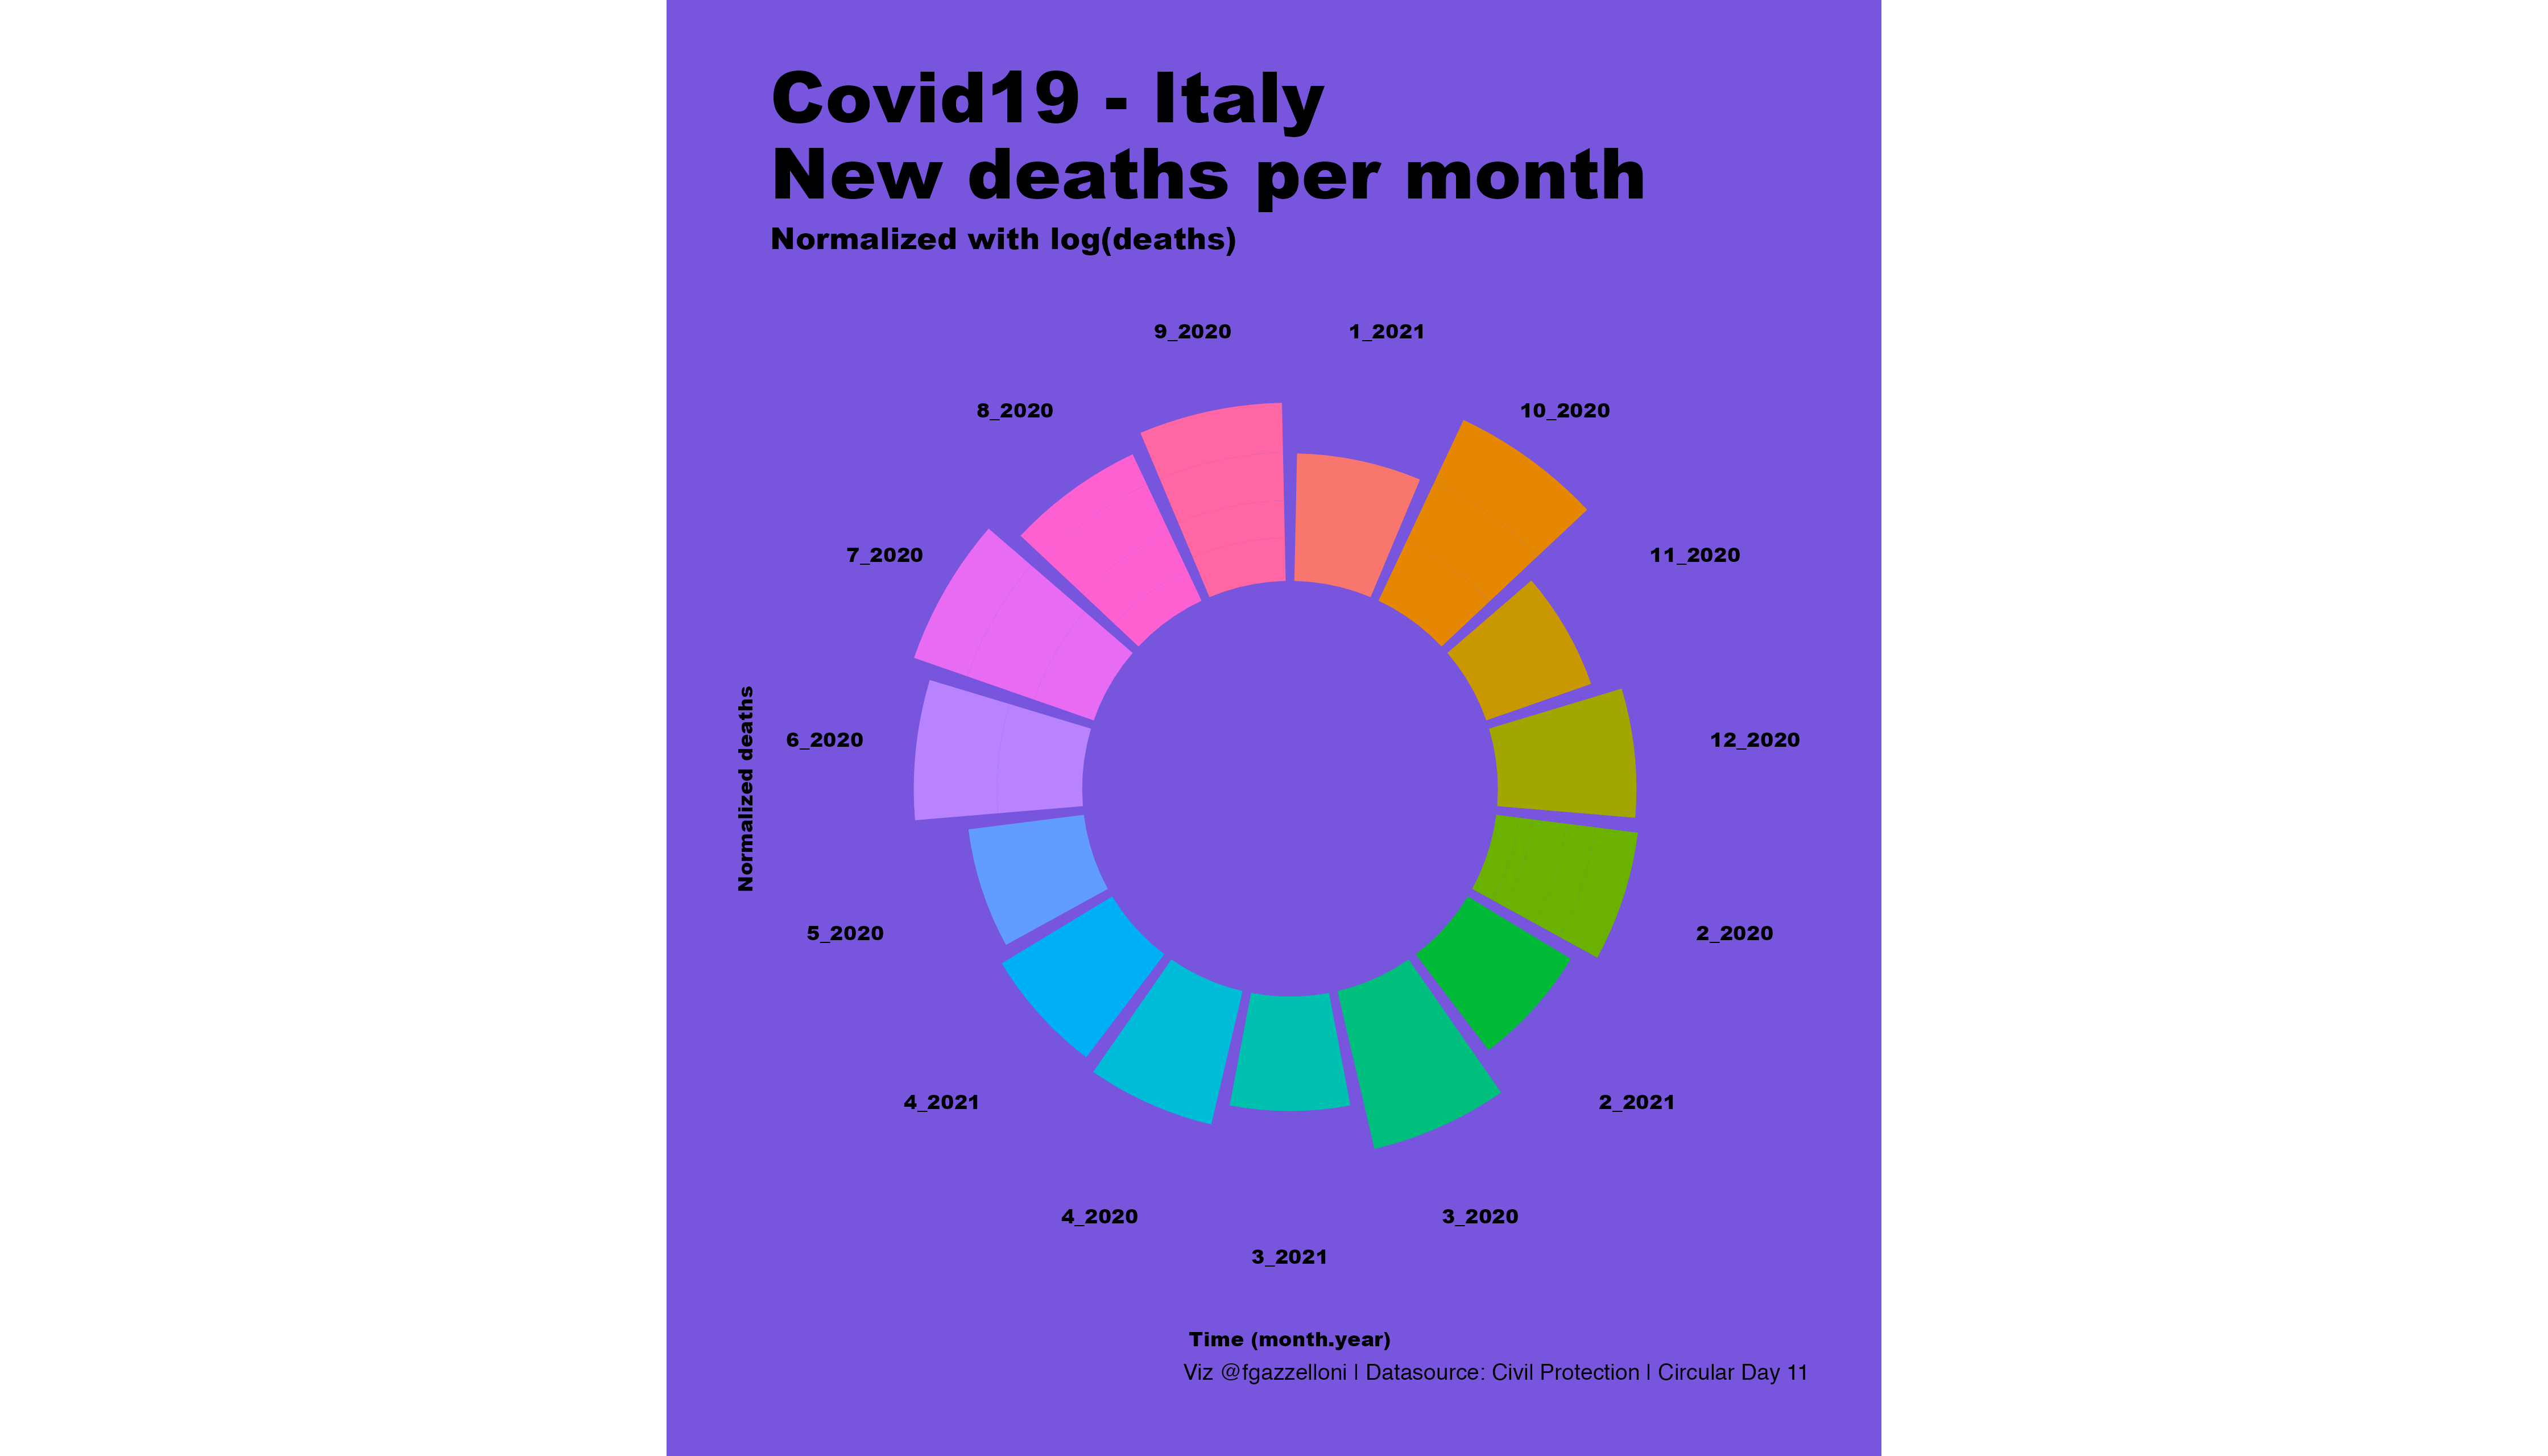
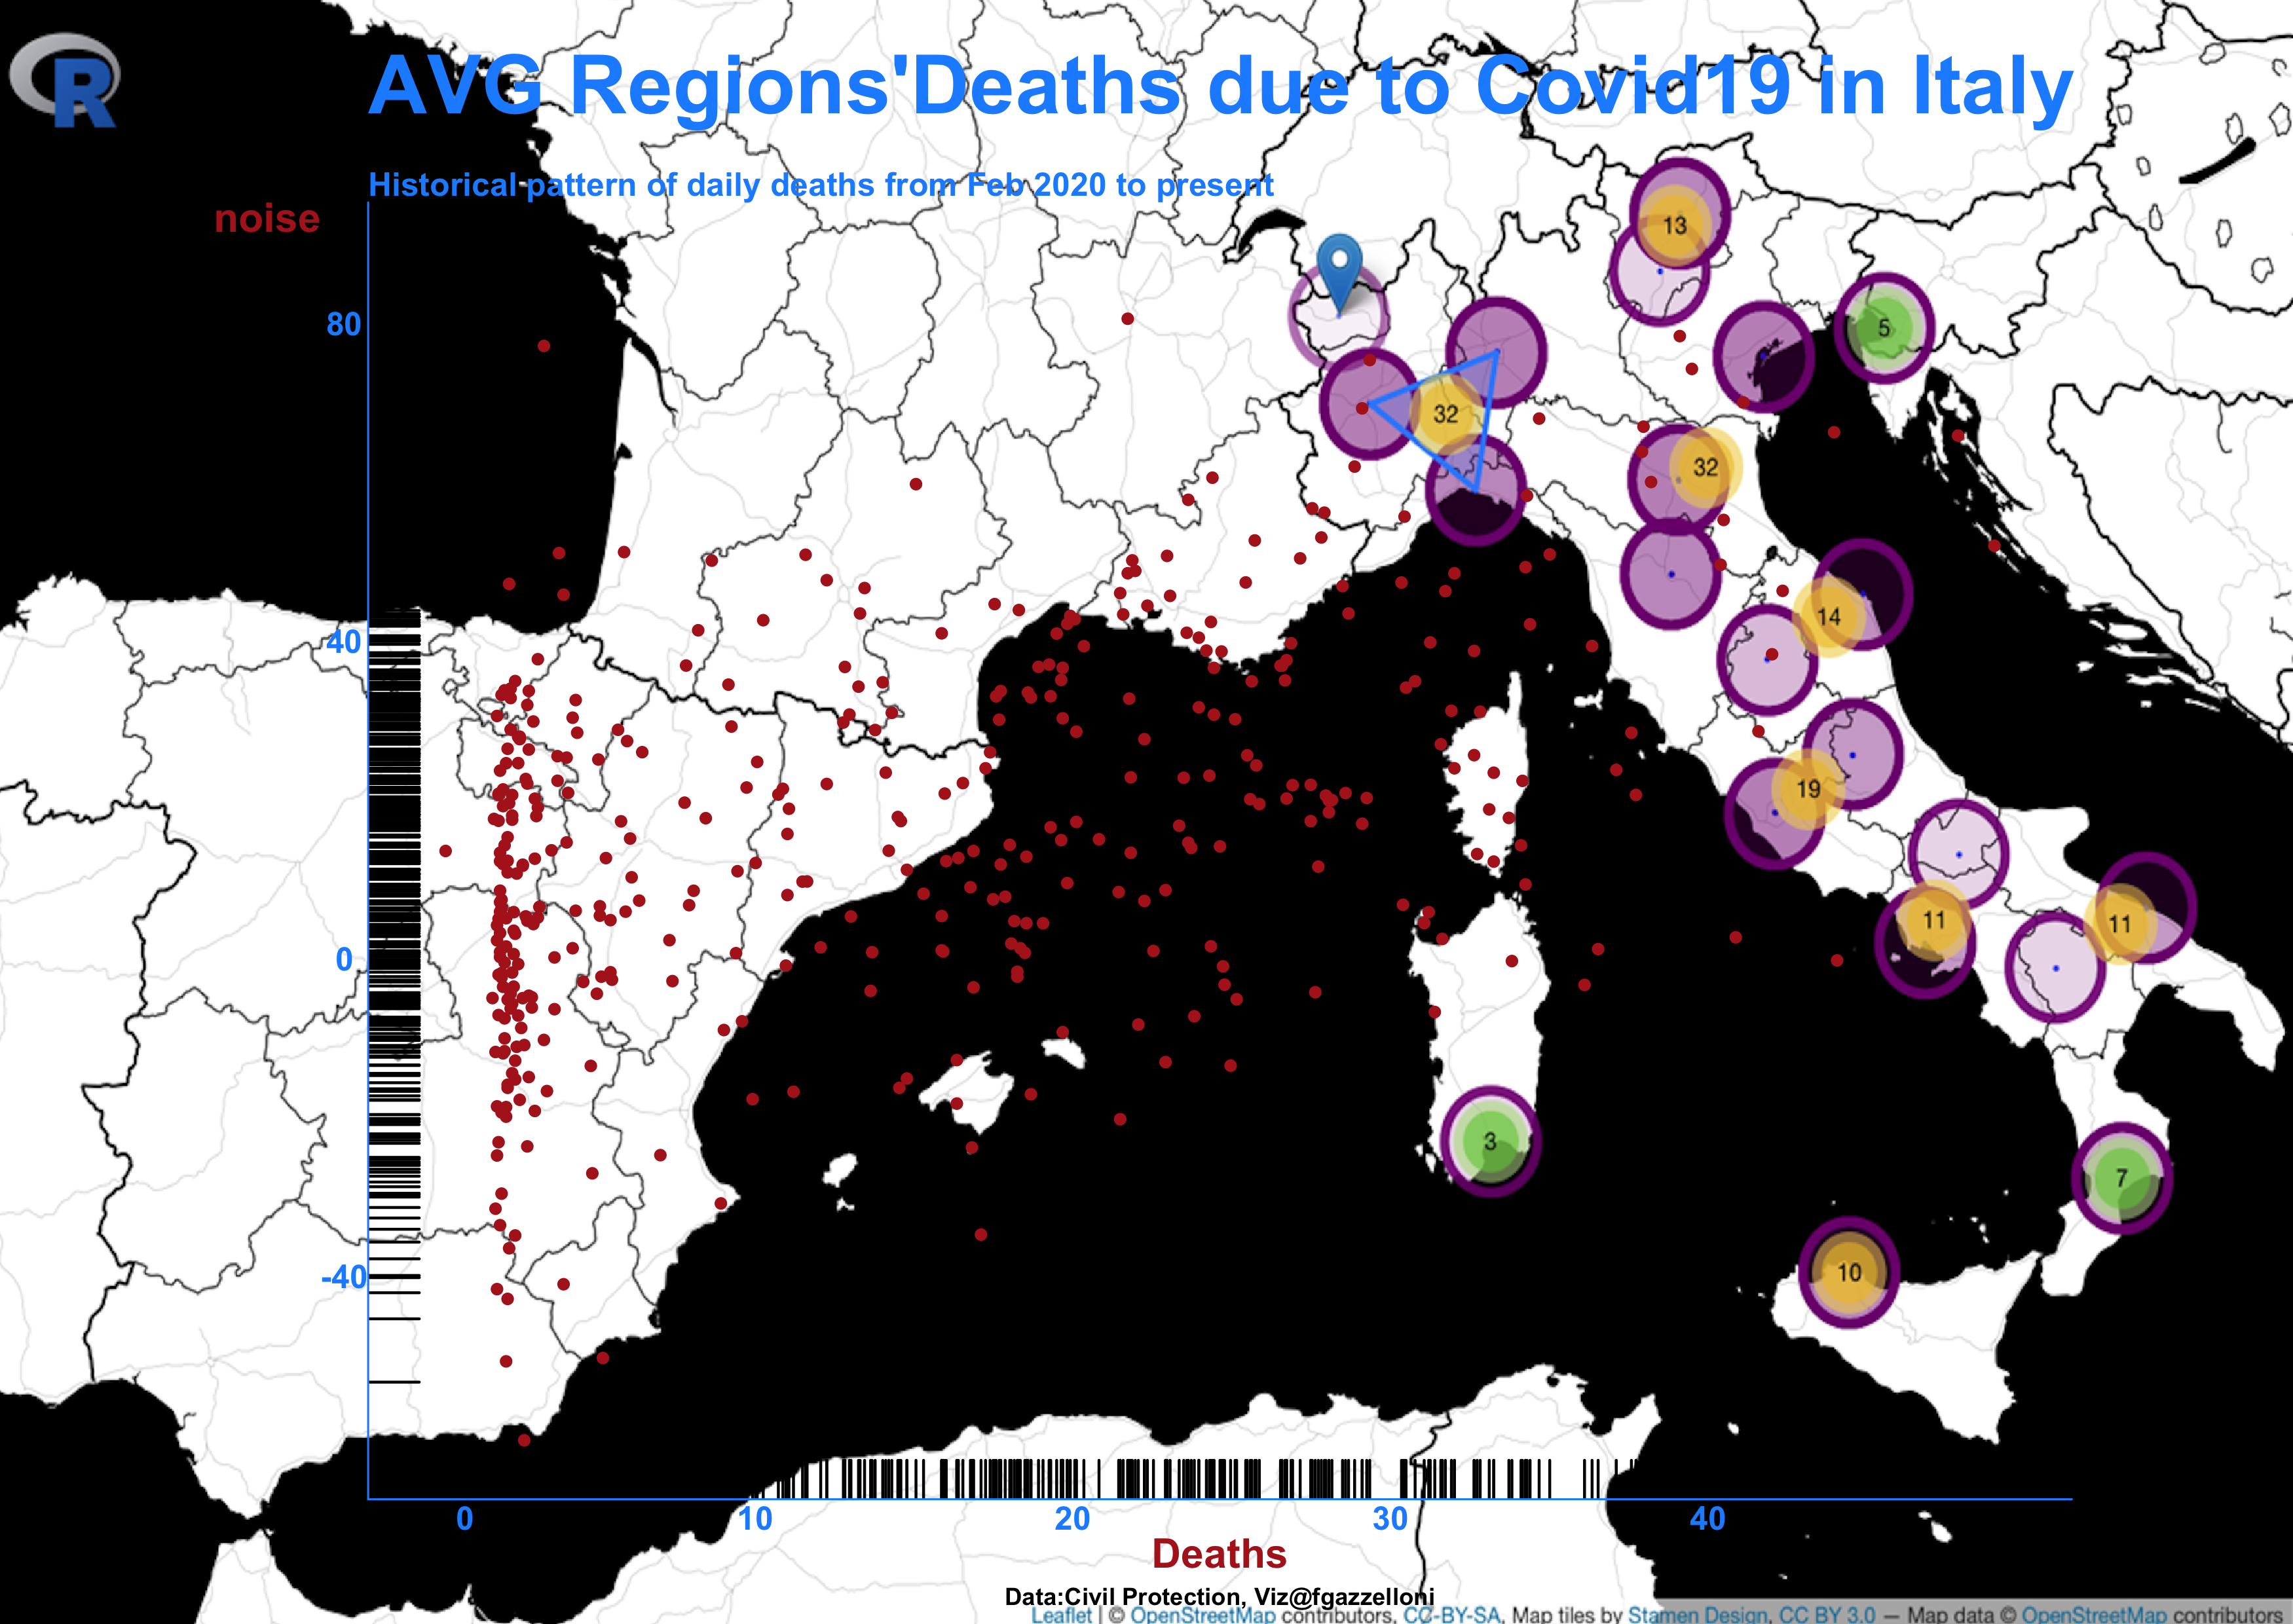
Historical pattern of daily deaths due to Covid19 in Italy from February 2020 to present.
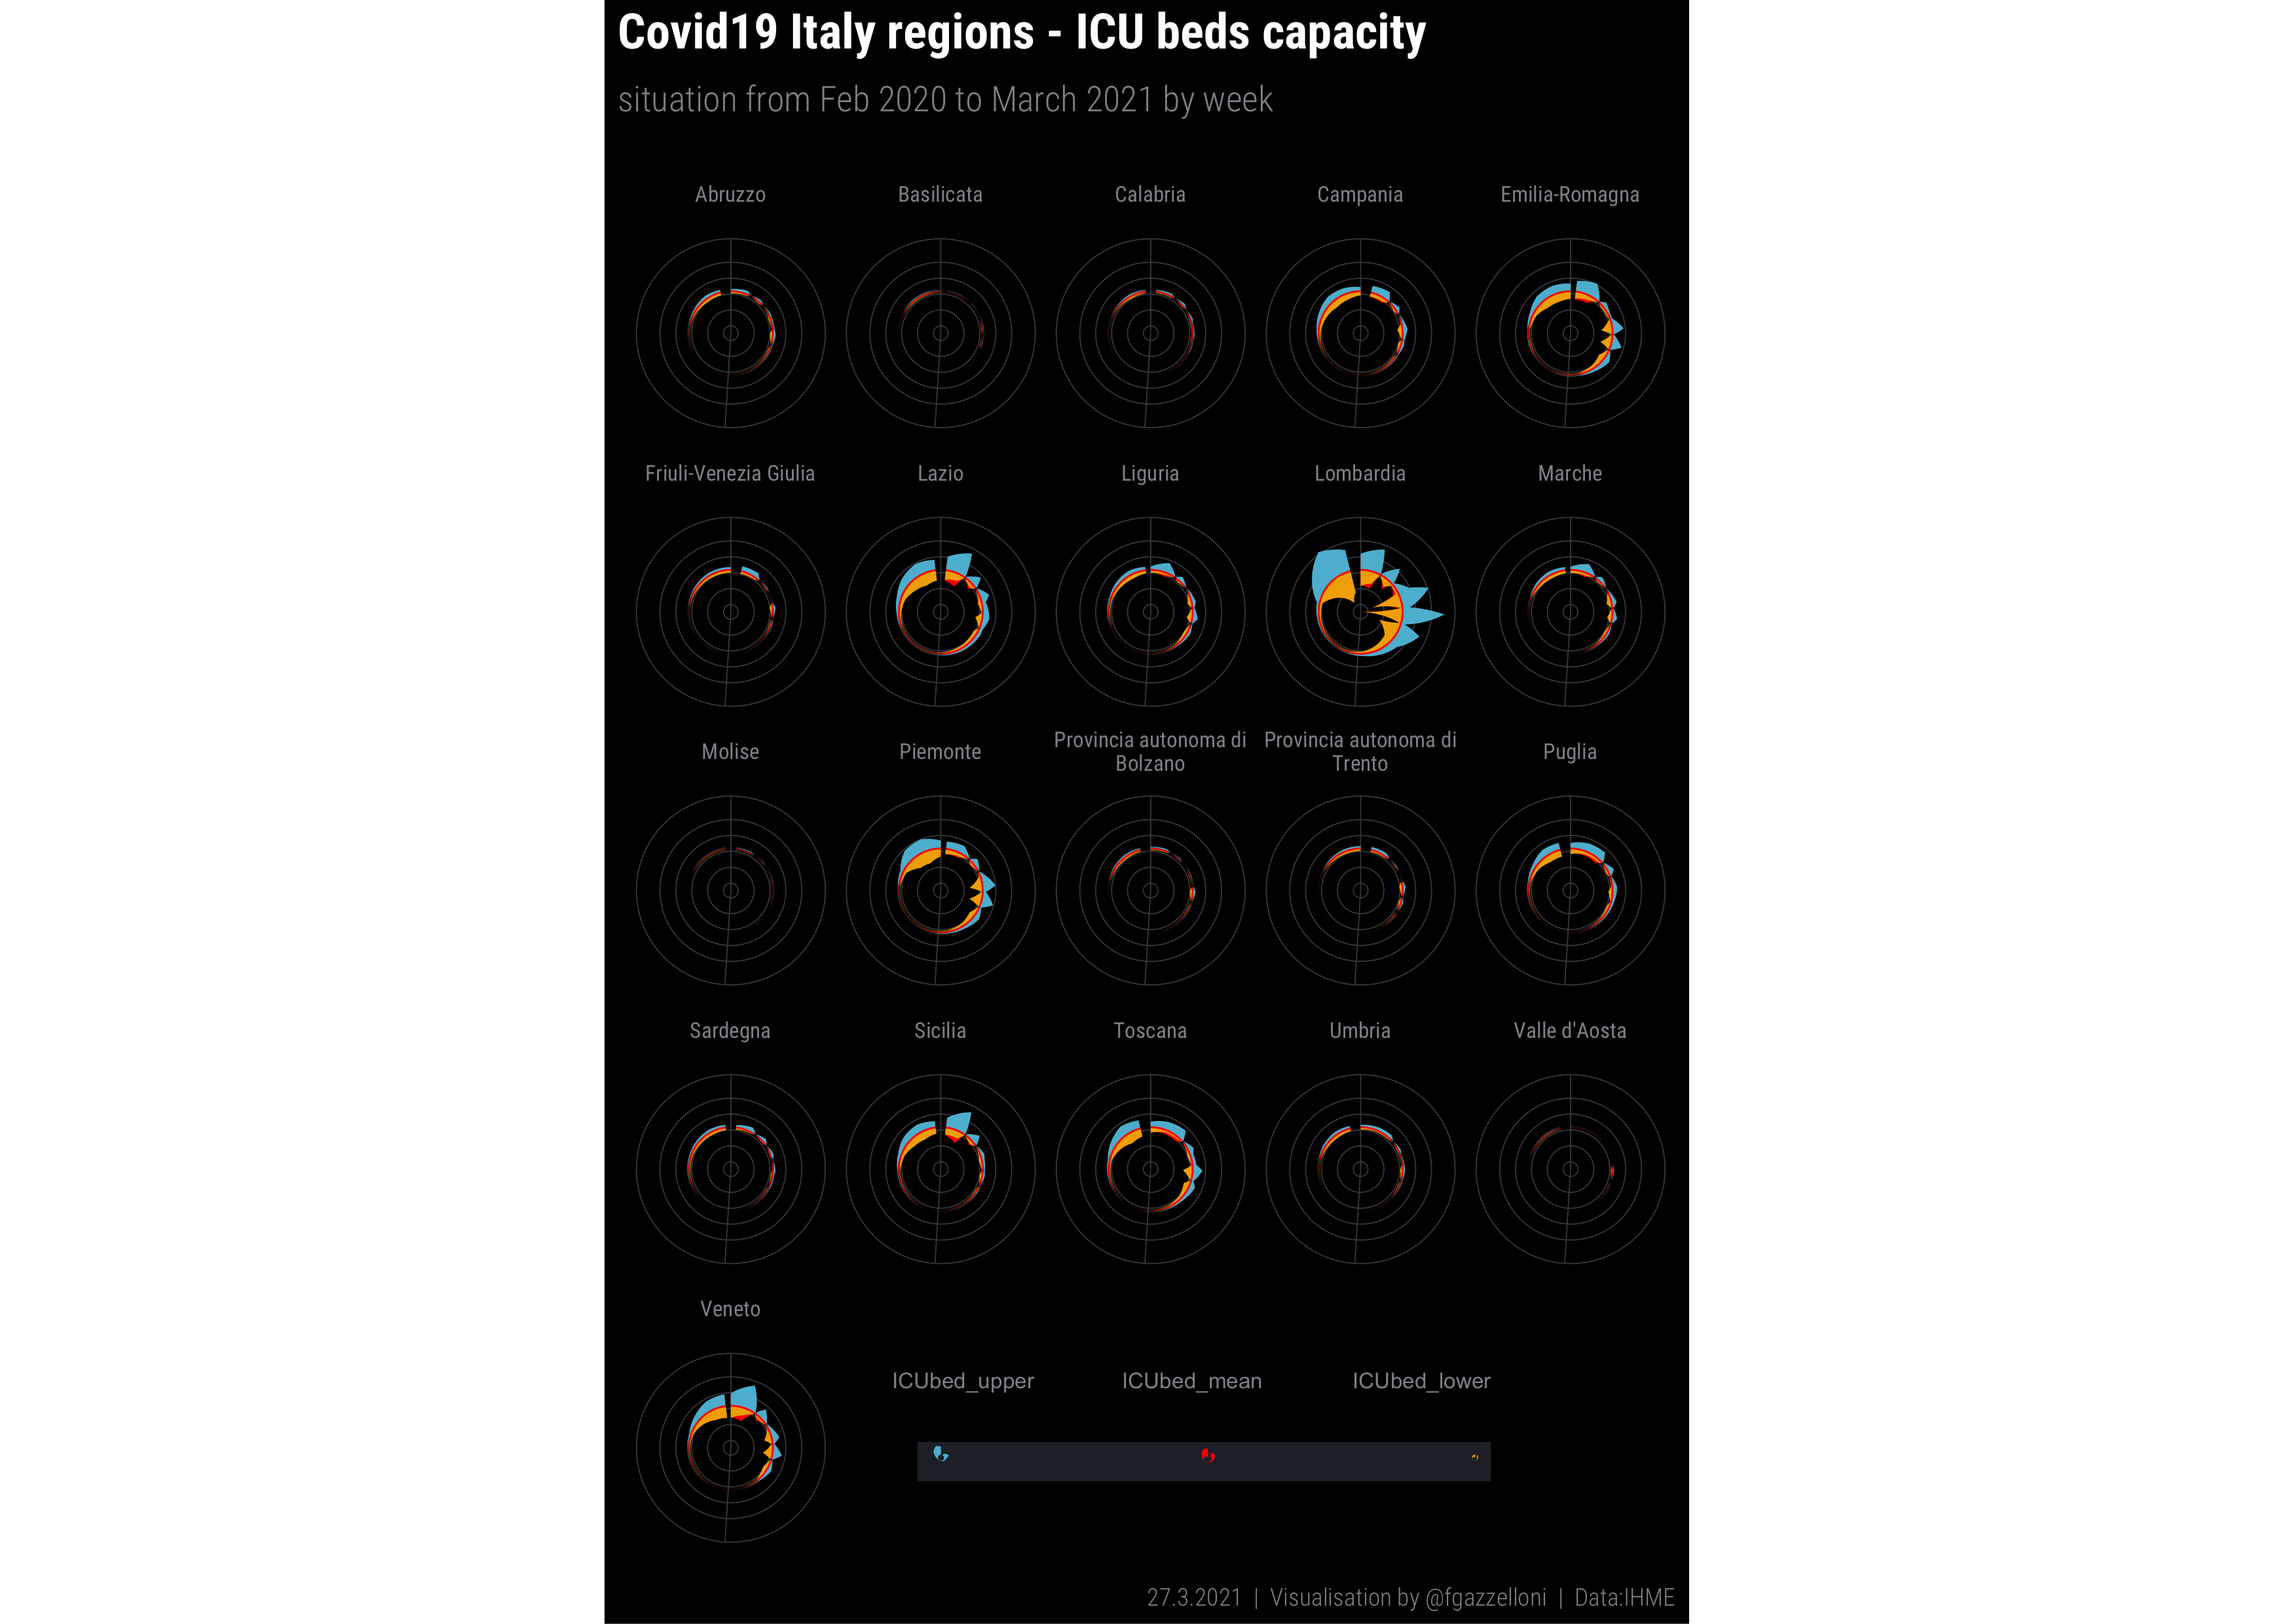
Covid-19 Pictogram: this visualization shows the ICU bed capacity in different Italian regions from February 2020 to March 2021.
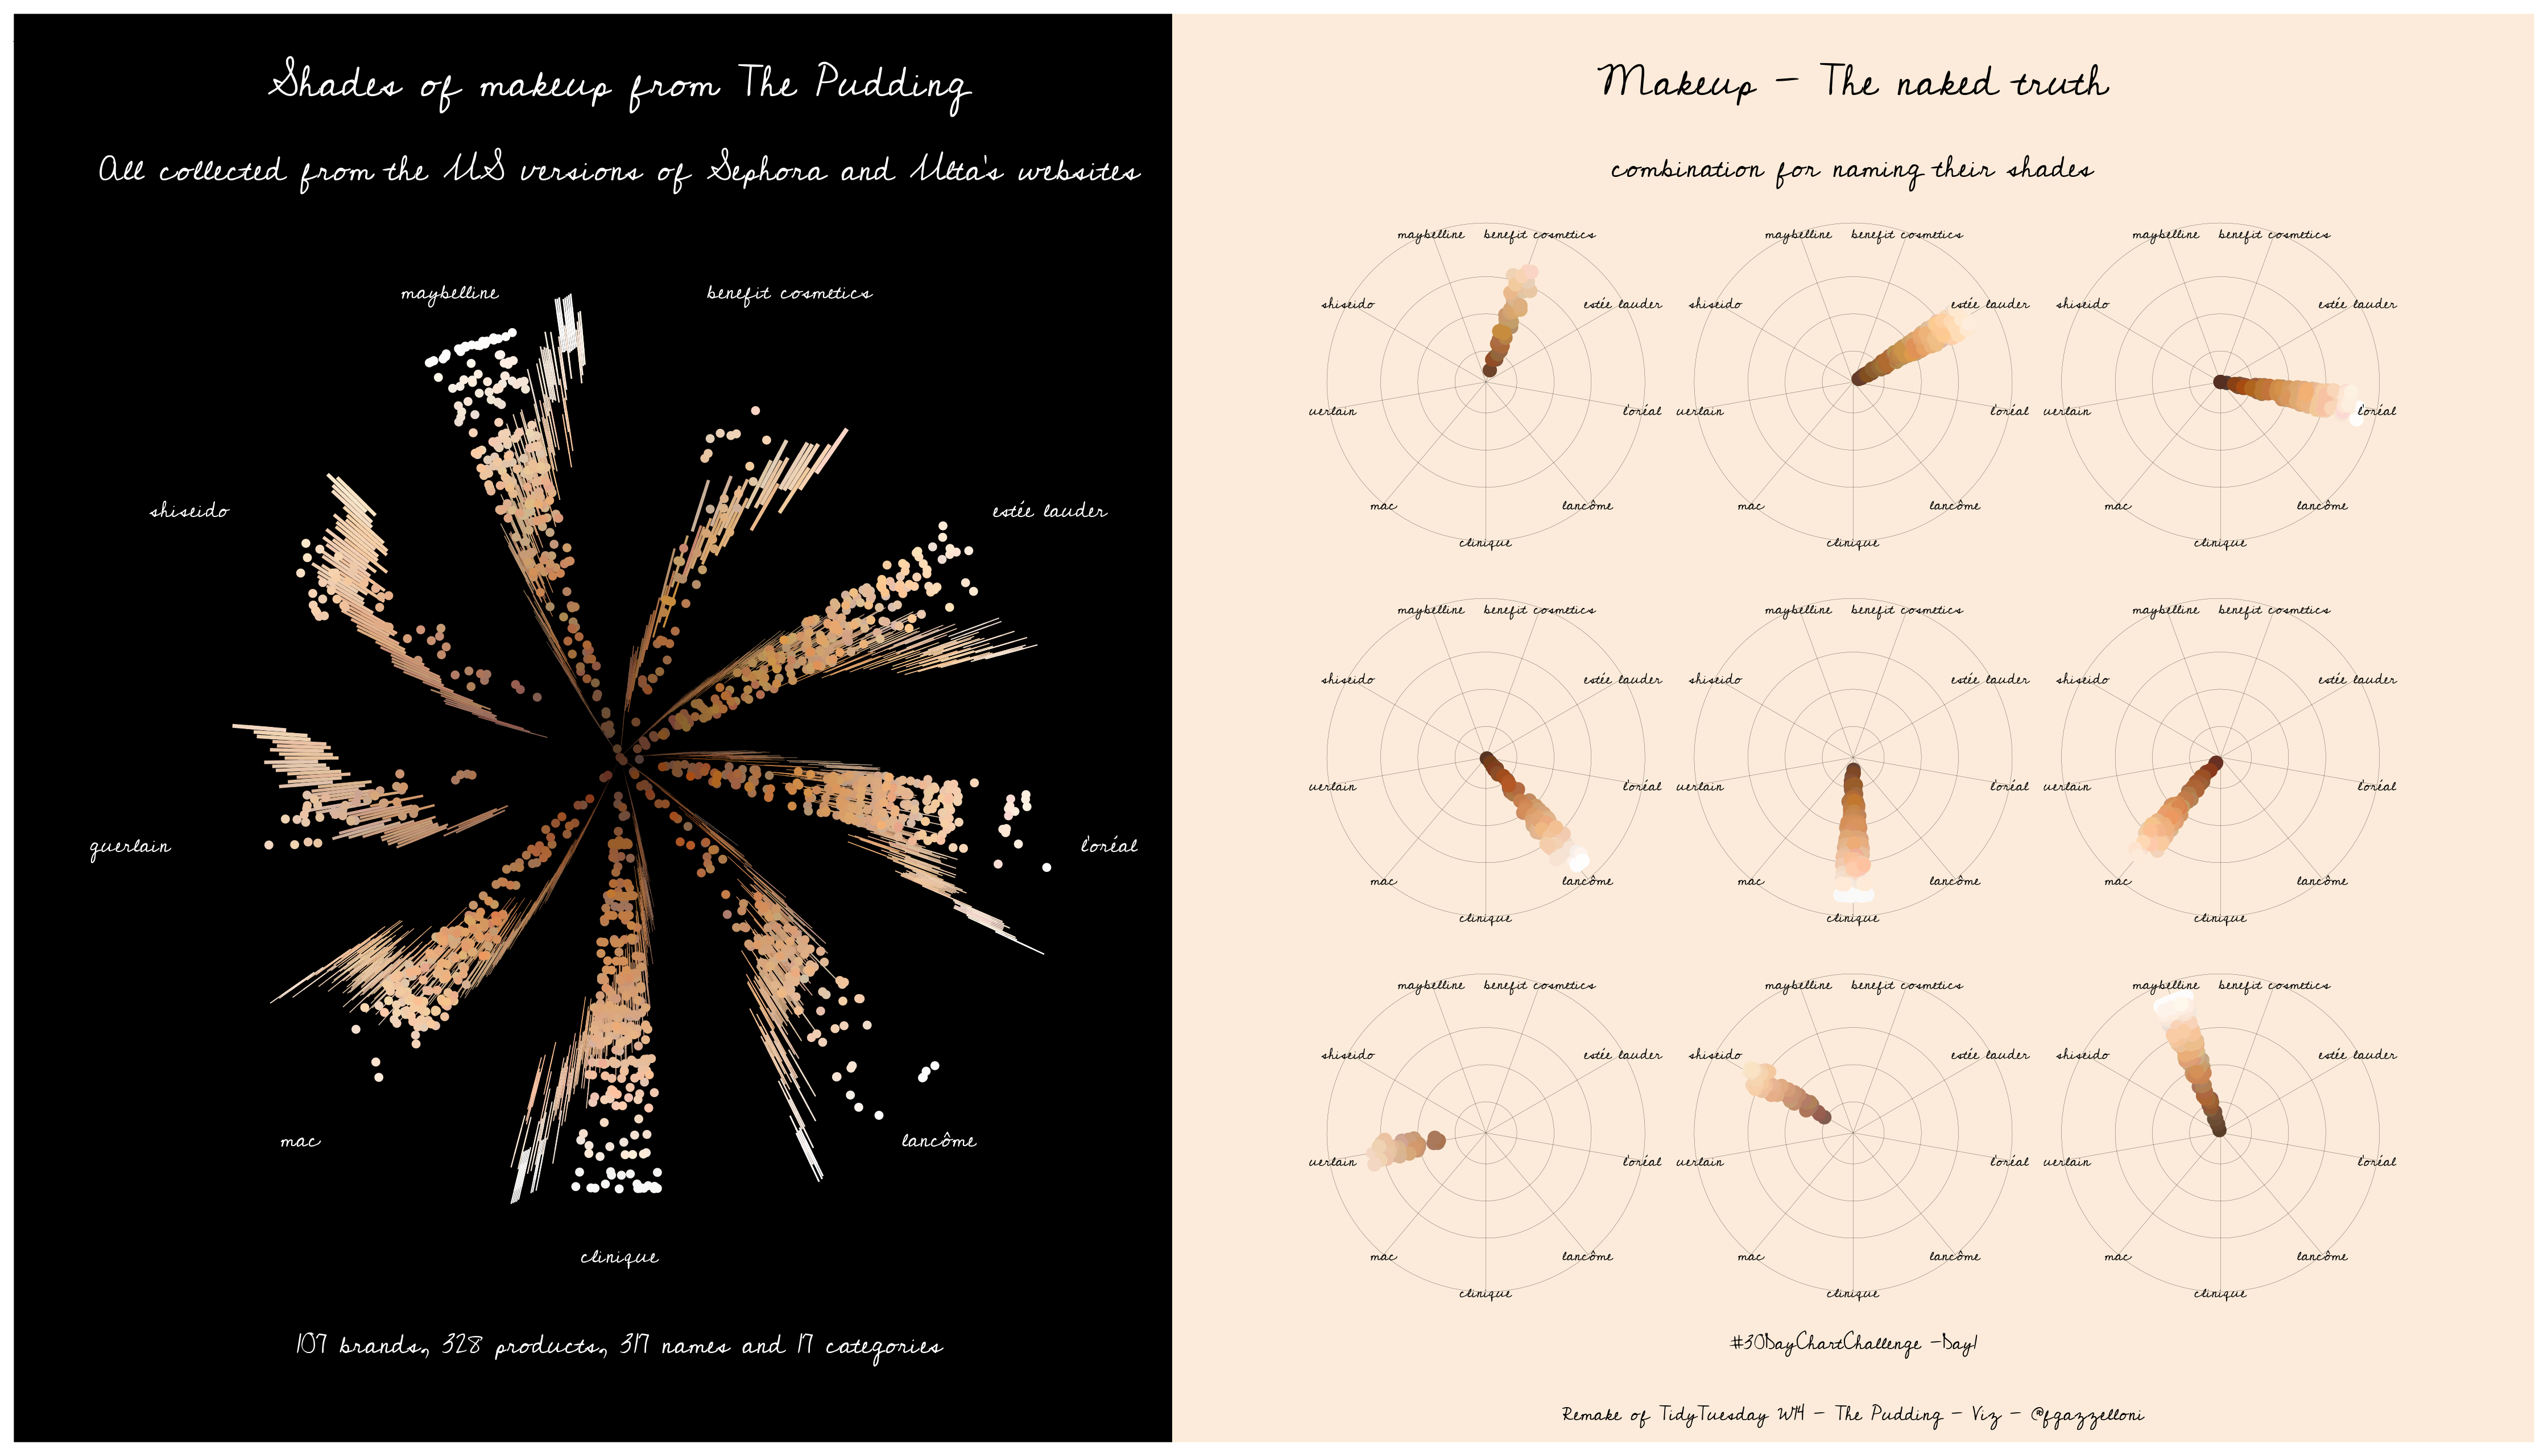
The Pudding Data used for this first visualization.