5 Quantifying magnitude
In the last chapter, we compared the “testing” and “estimation” approaches to inference. The “estimation” approach treats the task of statistical inference as using data to estimate the values of unknown quantities, expressed as population parameters. Confidence intervals (or credible intervals, if Bayesian methods are used) are placed around the estimates. These intervals convey the amount of uncertainty or “precision” in our estimates.
- Wider intervals mean more uncertainty and less precision.
- Narrower intervals mean less uncertainty and more precision
Estimates that quantify the magnitude of a phenomenon of interest can be referred to as “effect sizes”. In this chapter, we’ll look at some popular kinds of effect sizes, some potential sources of bias in effect sizes, and some critiques of how effect sizes are used in practice.
5.1 The case for effect sizes
Reporting effect sizes is often presented as an alternative to reporting p-values and statements of significance.
These two approaches are not mutually exclusive; one can always report a p-value, a statement about significance, and an effect size estimate.
The case for effect sizes is that magnitude is usually of interest. For instance, if I tell you that a drug will reduce the duration of your headache by a “statistically significant” amount of time, you will probably want to know what this amount of time is. “Significant” just means “some amount that would be unlikely to occur by chance if the drug didn’t do anything”. That’s not a lot of information. We are going to be more excited out the drug if it will make the duration of our headaches 8 hours shorter than we would if it made the duration 30 minutes shorter.
It is, sadly, uncommon to see effect sizes reported in popular media. Most articles written about scientific studies limit themselves to saying that something “worked” or “didn’t work”, or that some outcome got “larger” or “smaller”. The answer to “by how much?” is often left unanswered.
5.2 Some popular effect sizes
We’ll start by covering some popular effect sizes:
Cohen’s d, i.e. standardized mean difference
The linear correlation coefficient (\(r\)) and the coefficient of determination (\(R^2\))
Risk ratio, a.k.a. relative risk
Odds ratio
Standardized slope
5.2.1 Standardized mean difference (“Cohen’s d”)
- A “standardized” effect size that reports a difference in means relative to the standard deviation of data. There’s a sample version and a population version; the sample version estimates the population version:
\[ d = \frac{\bar{X}_1 - \bar{X}_2}{s} = \frac{diff \space in \space means}{std. dev.} \\ \\ \\ \delta = \frac{\mu_1 - \mu_2}{\sigma} = \frac{diff \space in \space means}{std. dev.} \]
- Since Cohen’s D is in standardized units, we can compare effect sizes for variables that otherwise would have different units or different amounts of natural variability. 21
5.2.1.1 Example: Comparing Outcomes in Athletics
We can compare athletes at the elite level (where variability is low) to athletes at the amateur level (where variability is high).
A difference of 10 sections in finishing times for a mile race would be considered large at the elite level, and probably small at the amateur level. Converting finishing times to Cohen’s D might allow us to compare elite and amateur athletes with respect to the strength of their competition.
We can also compare effect sizes for different events measured in different units, e.g. 1 std. dev. difference for shot put distance or 1000 m hurdles.
Anticipating a criticism: (Simpson 2017) Adrian Simpson presents a powerful critique of using standardized effect sizes to compare dissimilar studies. We will read his argument for this class.
5.2.1.2 “Small”, “medium” and “large”
- By convention, effect sizes of \(d = 0.1\) or \(d = 0.2\) are considered “small”. If \(d=0.2\), the means are \(\frac{1}{5}\) a standard deviation apart.
- Also by convention, \(d=0.5\) is often considered “medium”, and \(d = 0.8\) or \(d = 1.0\) are considered large.
- These numbers are given here only so that you’re aware of the convention. Please do not take them seriously. What counts all “small” or “large” depends entirely upon the context of the problem.
5.2.1.3 Cohen’s motivation
“Cohen” was a psychologist who popularized using power analysis in psychology. A power analysis is usually performed to decide what sample size is needed for an experiment, and Cohen claimed that most sample sizes were too small. These cutoffs were put forth in order to give some guidance to researchers, and also to make choosing values for a power analysis easier.
5.2.2 Some alternatives to the d statistic
Consider normally distributed populations, A and B, that have the same standard deviation but different means. Suppose the mean for B is larger than the mean for A.
- Cohen’s U3
This is the proportion of values in distribution B that lie above the mean of distribution A. If A and B had the same mean, Cohen’s U3 would be 0.5, or 50%.
- % Overlap
This is what it sounds like: the proportion of the “B” distribution that overlaps the “A” distribution. If A and B had the same mean, there would be 100% overlap.
- Probability of superiority
This is the probability that a randomly selected value from B will be larger than a randomly selected value from A. If A and B had the same mean, this would be 0.5, or 50%.
5.2.3 The linear correlation coefficient
“Correlation” comes from “co-relation”. Two variables X and Y “co-relate” if they have a mutual relation: as the value of X changes in one direction, the value of Y tends to change in a certain direction.
Positive correlation means that a X gets larger, Y gets larger. Equivalently, as X gets smaller, Y gets smaller.
Negative correlation means that as X gets larger, Y gets smaller. Equivalently, as X gets smaller, Y gets larger.
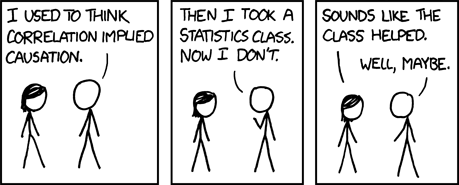
“Correlation does not imply causation”: the fact that we observe a tendancy for Y to change as X changes does not mean we may infer that changing X induces changes in Y, or vice versa.
- We will explore issues surrounding causation in the next chapter.
5.2.3.1 Formula for \(r\)
The most popular statistic for quantifying correlation is the “Pearson correlation”, a.k.a. “linear correlation coefficient”. It is denoted \(r\). Sometimes subscripts are added to denote the variables being correlated, e.g. \(r_{xy}\):
\[ r_{xy}=\frac{1}{n-1}\cdot \frac{\sum_{i = 1}^n(x_i - \bar{x})(y_i - \bar{y})}{s_x s_y} = \frac{1}{n-1}\cdot \sum_{i = 1}^n Z_{x_i}Z_{y_i} \]
Where \(s_x\) and \(s_y\) are the sample standard deviations for the variables \(x\) and \(y\), respectively. Facts about \(r\):
\(r\) ranges from -1 to 1
Negative \(r\) means negative correlation; positive \(r\) means positive correlation.
\(r=0\) means no correlation.
\(r=1\) means perfect positive correlation: values are in a perfect straight line sloping upwards.
\(r=-1\) means perfect negative correlation: values are in a perfect straight line sloping downwards.
Pearson correlation is closely related to slope in linear regression. Call the slope of a regression line \(b_1\). A formula for \(b_1\) in terms of \(r_{xy}\):
\[ b_1 = r_{xy} \cdot \frac{s_y}{s_x} \] Re-arranging gives:
\[ r_{xy} = b_1 \cdot \frac{s_x}{s_y} \]
5.2.3.2 Interpreting \(r\)
Most “interpretations” for \(r\) are unsatisfying. Do a search for “interpretation of correlation coefficient”, and you’ll probably get something along the lines of
\(r=-1\) and \(r=1\) mean perfect correlation; \(r=0\) means no correlation. Correlations closer to \(-1\) or \(1\) are stronger; correlations closer to 0 are weaker
This is unsatisfying because it doesn’t explain what any particular value of \(r\) quantifies. For instance, if \(r=0.4\), what does 0.4 quantify? 0.4 of what?
As we’ll soon see, there are many different kinds of correlation statistics besides Pearson correlation, all of which are bounded between \(-1\) and \(1\). We should want more from an “interpretation” of a statistic than a few facts that aren’t even specific to that particular statistic!
Thankfully, the formula for a regression slope in terms of the Pearson correlation suggests a more detailed interpretation:
\[ b_1 = r_{xy} \cdot \frac{s_y}{s_x} \]
If we interpret slope as “the difference in average \(y\) for a 1 unit difference in \(x\)”, then we can say that:
\(r\) is the average difference in standard deviations of \(y\) for a 1 standard deviation difference in \(x\)
If we assume that \(x\) causes \(y\), we could say that \(r_{xy}\) is the number of standard deviations by which \(y\) changes when \(x\) increases by 1 standard deviation.
This app demonstrates the connection between \(r_{xy}\) and the slope of a simple linear regression line:
How correlation relates to slope in simple linear regression
5.2.3.3 Spearman correlation: a non-parametric alternative:
Spearman correlation is a “non-parametric” alternative to Pearson correlation
“Non-parametric” statistics typically do not make distributional assumptions about where the data came from.
Pearson correlation assumes a linear relationship bewteen \(x\) and \(y\), and it assumes both variables are normally distributed.
Spearman correlation does not assume linearity or normality.
Calculating Spearman correlation is simple: change the values of \(x\) and \(y\) into “order” statistics, which are their ranks from 1 (smallest value) to \(n\) (largest value), and then calculate Pearson correlation using these order statistics. For instance, if our data are:
\[ \begin{split} & X: 5.1 &\ \ 86.0 &\ \ 23.2 &\ \ 1.07 &\ \ 487.0 \\ & Y: 0.67 &\ \ 1.2 &\ \ 0.77 &\ \ 0.002 &\ \ 0.83 \end{split} \]
Spearman correlation is the Pearson correlation for
\[ \begin{split} & X: 2 &\ \ 4 &\ \ 3 &\ \ 1 &\ \ 5 \\ & Y: 2 &\ \ 5 &\ \ 3 &\ \ 1 &\ \ 4 \end{split} \]
library(ggplot2)
x <- c(5.1,86.0,23.2,1.07,487)
y <- c(0.67,1.2,0.77,0.002,0.83)
ggplot(data.frame(x,y),aes(x=x,y=y))+geom_point()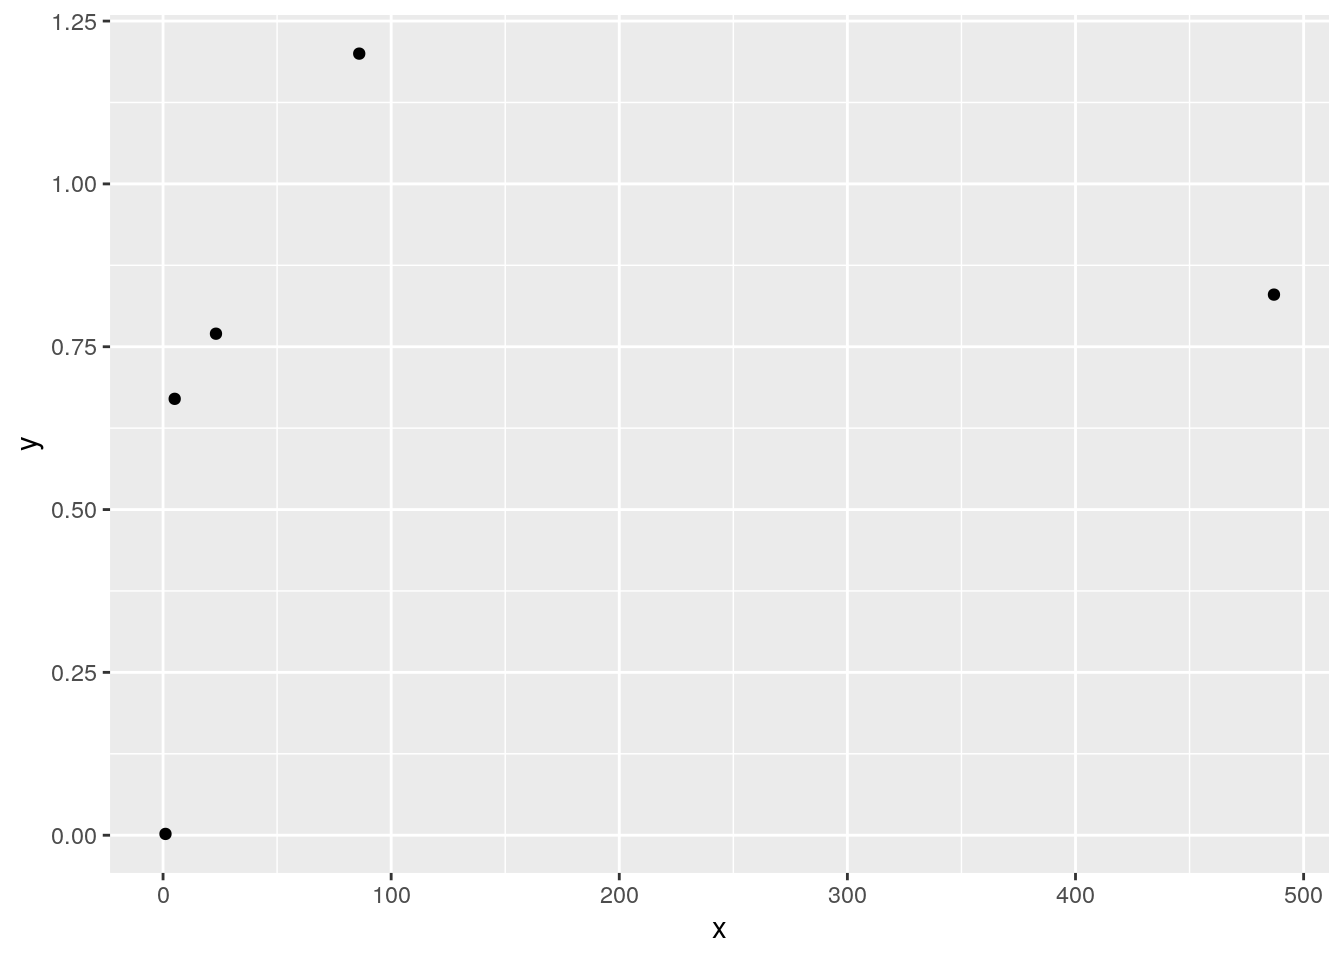
cor(x,y) # Pearson correlation## [1] 0.304925cor(rank(x),rank(y)) # Spearman correlation## [1] 0.9- There are more alternative correlation statistics that we will not cover in this class, such as Kendall’s Tau and Kruskall’s Gamma (these is particularly useful for quantifying correlation between ordinal variables). Correlation statistics are always scaled from -1 to 1, but they will produce different values for any given data set.
5.2.4 Coefficient of Determination (\(R^2\))
If we have two variables \(x\) and \(y\), \(R^2\) is literally \(r\), squared.
If you are familiar with “sums of squares”,
\[ R^2=\frac{Total\ sum\ of\ squares - Error\ sum\ of\ squares}{Total\ sum\ of\ squares} \] or
\[ R^2=\frac{Model\ sum\ of\ squares}{Total\ sum\ of\ squares} \] - \(R^2\) is typically interpreted as “The proportion of variability in the response variable that is attributable to variability in predictor variables”
\(R^2\) can be thought of as quantifying predictive power, i.e. how well the predictor variables in a regression model can predict values of the response variable.
\(R^2 = 1\) means zero prediction error; the model makes perfect predictions.
\(R^2 = 0\) means you may as well not use your predictor variables and always “predict” \(\bar{Y}\).
A useful interpretation: \(R^2\) is the proportional reduction in squared prediction error achieved by using a regression model, relative to only guessing the mean. In this sense, \(R^2\) is telling you how much better a model’s predictions for \(Y\) are than they’d be if it just predicted \(\bar{Y}\) all the time.
One major limitation on the “interpreability” of \(R^2\) is that it is based on square units
Formula:
\[ R^2 = \frac{Model\ sum\ of\ squares}{Total\ sum\ of\ squares}=\frac{\sum_{i = 1}^n (\hat{y}_i - \bar{y})^2}{\sum_{i = 1}^n (y_i - \bar{y})^2} \]
Interpreting \(R^2\) as “The proportion of variability in the response variable that is attributable to variability in predictor variables” involves a sleight of hand: the “variability” referenced in this interpretation is quantified in squared units.
We can relate this to the interpretability issue with standard deviation vs. Variance:
\[ s^2 = \frac{\sum^n_{i = 1} (y_i - \bar{y})^2}{n - 1} \]
\[ s = \sqrt\frac{\sum^n_{i = 1} (y_i - \bar{y})^2}{n - 1} \]
It is typically claimed that we should interpret standard deviation rather than variance because standard deviation is in the units of the variable of interest, whereas variance is in squared units.
By this standard, is there a problem with interpreting \(R^2\), which is after all a proportion of squared units in \(y\)?
Maybe the fact that it is a proportion makes this not so big a deal; the numerator and denominator are both in squared units. So, unlike with variance, \(R^2\) itself is not quantified in squared units.
5.2.5 Relative risk
Relative risk (a.k.a. risk ratio) is a ratio of probabilities
Consider some outcome whose probability is related to some predictor variable (e.g. getting COVID-19 is outcome, having vaccine is predictor)
\[ \frac{P(outcome|condtion \space A)}{P(outcome| condition \space B)} \]
5.2.5.1 COVID-19 example:
\[ \begin{split} \text{If}\ P(COVID-19\ |\ no \ vaccine) &= 0.03\\ \\ \text{ and } P(COVID-19| vaccine) &= 0.006 \\ \\ \text{ the relative risk is }RR=\frac{0.03}{0.006} &= 5. \end{split} \]
So, assuming these values, it is 5 times more likely to get COVID-19 if unvaccinated vs vaccinated (these are made up values; the real ones have changed over time as different variants became dominant).
“Risk” here just means probability. Relative risk is often used in medicine and epidemiology where the outcome is something negative, hence “risk”. There’s no prohibition on calculating the “risk” of something positive, for example:
\[ \frac{P(rainbow\ |\ it\ just\ stopped\ raining\ )}{P(rainbow\ |\ it's\ still\ raining )} \]
- Relative risk has an intuitive interpretation: it tells you how much more likely the numerator outcome is then the denominator outcome, or how many times more likely the outcome is under condition A then under condition B
5.2.6 Odds and odds ratio
- Odds of an outcome are defined as:
\[ \frac{P(outcome)}{1 - P(outcome)} \]
- So odds tell how much more likely an outcome is to occur then to not occur
5.2.6.1 Sports example:
- Suppose we think the Denver Nuggets have a 75% chance of beating the Utah Jazz. We could express this as odds:
\[ odds(Denver \space wins) = \frac{0.75}{1-0.75} = \frac{0.75}{0.25} = \text{3 to 1} \]
Interpretations:
- The probability of Denver winning is 3 times the probability of Denver losing.
- Denver should win 3 times for every 1 time they lose.
- If Denver and Utah play 4 games, we expect Denver to win 3 and lose 1.
5.2.6.2 Probability and Odds are not the same thing!
In ordinary English, we use “odds” and “probability” (or “likelihood”) interchangeably. In statistics, the distinction is very important.
Probabilities are bounded between 0 and 1. Odds are bounded between 0 and \(\infty\).
If probability is small, odds and probability are similar. If probability is large, they aren’t.
\(P(A) = 0.01\), \(odds(A) = \frac{0.01}{0.99} = 0.0101\ \text{to}\ 1\)
\(P(B) = 0.5\), \(odds(B) = \frac{0.5}{0.5} = 1 \text{ to } 1\)
\(P(C) = 0.975\), \(odds(C) = \frac{0.975}{0.025} = 39 \text{ to } 1\)
\(P(D) = 0.9993851\), \(odds(D) = \frac{0.9993851}{0.0006149} = 1625.281 \text{ to } 1\)
5.2.6.3 Why Bother with odds?
Nice interpretation; “3 to 1” vs. “75%”. Expressing a rate in terms of counting might feel more natural than expressing a rate as a proportion or percentage.
Regression coefficients in logistic regression models can interpreted as odds ratios when exponentiated:
$$
So, if \(\hat{\beta_1}=0.789\), then a one-unit difference in \(x_i\) is associated with an odds ratio of \(e^{0.789}=2.20\text{ to }1\)
- There are study designs in which sample relative risks are biased estimators of population relative risks, but sample odds ratios are unbiased estimators of population odds ratios. Popular example: case-control studies.
- Case-control design: We collect “cases” non-randomly. “Cases” are usually people with a disease, then we find “controls” people who are similar to cases, but don’t have the disease. Then for some risk factor of interest, we compute:
\[ OR= \frac{odds(disease\ |\ case) \hphantom{11}}{odds(disease\ |\ control)} \]
\[ OR= \frac{\frac{P(disease|case)}{1 - P(disease|case)}}{\frac{P(disease|control)}{1 - P(disease|control)}} \]
5.2.6.4 Interpreting odds ratios
Interpreting odds ratios can get hairy; consider \(OR = 1.8\)
The ratio for how much more likely the outcome is to occur rather than not occur under condition A is 1.8 times greater than the ratio for how much more likely the outcome is to occur rather than not occur under condition B.
We CANNOT say “The outcome is 1.8 times more likely under condition A than under condition B”! That is the interpretation of a relative risk. Not that this stops anyone…


Notice this line:
“Outbreaks were three and a half times more likely (adjusted odds ratio 3.5, 95% confidence interval 1.8-6.6) in schools without mask mandates”.
It is wonderful to see a confidence interval reported here, but unfortunately this interpretation is not correct. “Three and a half times more likely” is the interpretation of a relative risk. If the baseline (denominator) probability of the outcome is small, then odds ratio and relative risk are similar. But, as baseline probability increases, odds ratio gets larger compared to relative risk. For instance, here are two relative risks that would both lead to an odds ratio of 3.5:
\[ \begin{split} RR &= \frac{0.28}{0.1}=2.8 \\ \\ \Rightarrow\ OR &= \frac{\frac{0.28}{0.72}}{\frac{0.1}{0.9}}=\frac{0.389}{0.111}=3.5\text{ to }1 \\ \\ &vs. \\ \\ RR &= \frac{0.78}{0.5}=1.56 \\ \\ \Rightarrow\ OR &= \frac{\frac{0.78}{0.22}}{\frac{0.5}{0.5}}=\frac{3.5}{1}=3.5\text{ to }1 \end{split} \]
So, if probability of a COVID-19 outbreak in schools with mask mandates was 0.1, an odds ratio of 3.5 would mean outbreaks were 2.8 times more likely in schools without mask mandates. If baseline probability of a COVID-19 outbreak in schools with mask mandates was 0.5, an odds ratio of 3.5 would mean outbreaks were 1.56 times more likely in schools without mask mandates.
5.2.6.5 Case-Control study linking smoking to lung cancer
One of the earliest studies showing a link between smoking and lung cancer used a case-control design: researchers observed cases (people with lung cancer), found one control (someone without lung cancer but otherwise similar, e.g. same age) per case, then compared smoking ratios among those with lung cancer and those without:
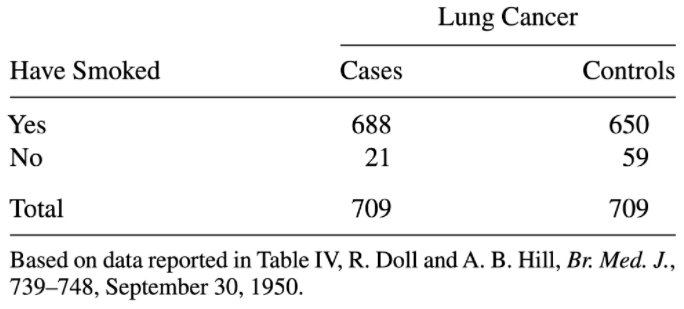
(From Agresti’s 2006 textbook on categorical data analysis)
It would obviously be invalid to use the relative probabilities of smoking vs. not smoking in this sample as an estimate for the population rates of smoking and non-smoking: the data was collected in a manner that intentionally makes this 50/50! For this reason, it would also not be valid to use the relative risk of cancer given smoking vs. not smoking; we have over-sampled cancer cases.
However, we can use sample odds ratio as an estimate of population odds ratio. This is because, when we calculate an odds, the denominators “fall out”. Try calculating it yourself to see:
\[ OR=\frac{odds(cancer\ |\ smoker)}{odds(cancer\ |\ non-smoker)} \]
5.2.6.6 Odds ratios are weird
Odds ratios are less intuitive then relative risks, but sometimes we must use them due to our particular study design (e.g. case control studies), and sometimes they give the most natural interpretation of a statistical outcome (e.g. coefficients in a logistic regression model).
Remember again that RR and OR cannot be converted to one another without assuming the values of underlying probabilities. Another example:
Suppose relative risk = 2. Consider possible values that produce this:
A: \(RR = \frac{.1}{.05} = 2 \hphantom{1111}\) \(OR = \frac{\frac{1}{9}}{\frac{5}{95}} = 2.11\)
B: \(RR = \frac{.8}{.4} = 2 \hphantom{1111}\) \(OR = \frac{\frac{80}{20}}{\frac{40}{60}} = 6\)
So if all we know is risk ratio or odds ratio, we cannot convert to the other.
This online calculator allows you to perform a conversion, given a baseline probability.
5.3 Problems with effect size
This chapter has put forth the case for using interpretable effect sizes in statistical inference. But, as always, there are some problems we need to be aware of. This section will cover:
- How selection for significance biases published effect sizes upward
- How using “standardizing” effect sizes doesn’t automatically make them comparable
- The “Crud Factor”
5.3.1 Selection for significance biases published effect sizes
“Selection for significance” refers to any procedure where we retain significant results and discard non-significant results.
This takes two common forms:
- “p-hacking”: data are analyzed in a way that takes advantage of flexibility in analysis. Analyses that produce 𝑝<0.05 are retained. No one gets to know how many analyses were tried.
- “publication bias”: journals and authors choose not to publish papers where the main result of interest is not statistically significant. No one gets to see the studies that “didn’t work”.
In most disciplines, statistically significant results are much more likely to be published in journals than non-significant results. This creates a biased impression of the state of research.Literature reviews only turn up “successes”. Little to no information on “failures”.
Publication bias has another awful consequence that isn’t as well known. Because significant results tend to have larger effect sizes than non-significant results, selection for significance amounts to censoring smaller estimates, which biases effect sizes upward.
Another way to think of it: we usually use unbiased estimators to estimate parameter values. If you take an unbiased estimator and then condition it on \(p<0.05\), you get a biased estimator.
The amount of bias is greater when power is lower, because more non-significant results are being thrown away.
Gelman and Carlin call this phenomenon a “Type M” (for magnitude) error. Formally, this is the expected amount by which an estimate differs from the parameter value, given that the result is significant. Lower power implies a greater Type M error.
They also define a “Type S” (for sign) error, which is the probability an estimate will have the wrong sign, given that it is significant. Thankfully, Type S errors are only a concern when power is very low.
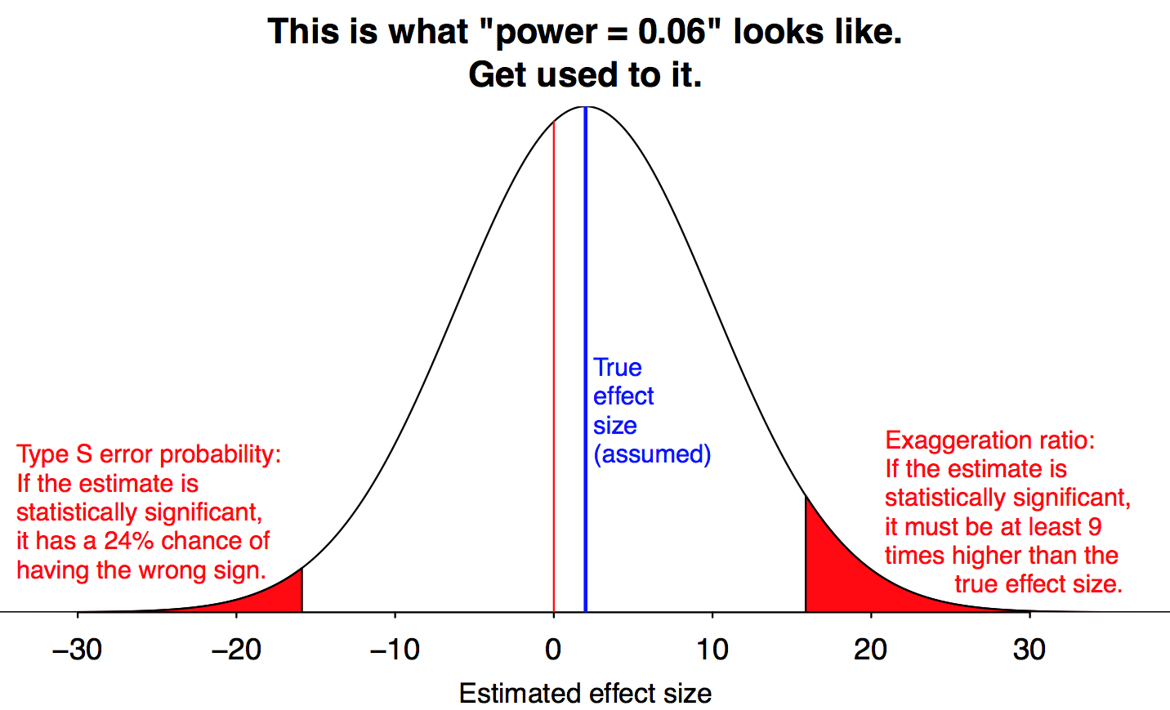
Here is a simulation where population effect size is d = 0.5 (half a standard deviation difference in means), and power is 30%.
Red bars are significant results. Under publication bias, grey bars are discarded.
Mean of significant results is \(d = 0.89\). Type M error is \(78\%:\)
\[ \frac{0.89-0.5}{0.5}=0.78 \]
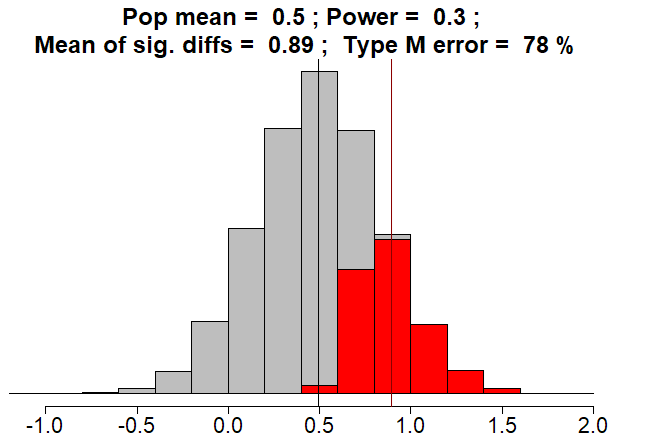
Fun fact: the true population mean effective size of d = 0.5 is not statistically significant!
This will always be true when power is less than \(50\%\). It is a mathematical certainty.
To repeat: If power is less than \(50\%\),THE TRUTH WILL NOT BE STATISTICALLY SIGNIFICANT!!
5.3.2 Replication studies and registered reports
Can publication bias be avoided? There is an approach that attempts to prevent publication bias known as “registered reports”. To understand this, we’ll first look at the standard approach.
Under the traditional approach to publishing research, the authors of a research paper (a.k.a. “manuscript”) send it a journal for publication. If the journal’s editor think the paper might be worth publishing, the editor will assign experts in the relevant field or fields to review it. The reviewers (who are usually anonymous to the manuscript’s authors) will provide feedback to the authors and the editor, and make a recommendation to the editor. Typical recommendations are:
- “Accept without revision” (this rarely happens)
- “Accept with minor revisions”
- “Accept with major revisions”
- “Revise and resubmit”
- “Reject”
The editor then takes the feedback and recommendations from the reviewers, and makes a decisions. If the editor agrees that revisions should be made, the editor will send reviewers’ feedback to the authors, who can then implement all of the recommendations, or respond to the editor with their reasons for not implementing some or all of the recommendations. The final decision on whether to publish rests with the journal editor.
This process is called peer review. If “Publication bias” is when the decision to publish is influenced by how the results turned out. A common form of publication bias is the phenomenon by which statistically significant results are more likely to be published than are non-significant results.
Registered reports is an alternative to the traditional publication process. From the website:
Registered Reports is a publishing format that emphasizes the importance of the research question and the quality of methodology by conducting peer review prior to data collection. High quality protocols are then provisionally accepted for publication if the authors follow through with the registered methodology.
This format is designed to reward best practices in adhering to the hypothetico-deductive model of the scientific method. It eliminates a variety of questionable research practices, including low statistical power, selective reporting of results, and publication bias, while allowing complete flexibility to report serendipitous findings.

Under registered reports, the decision of whether or not to publish is made prior to the results being known. The principle here is that the value of a scientific study should be assessed based on the importance of the question being asked and the quality of the proposed methodology. If the question is worth asking, aren’t the results worth knowing, however they turn out?
Papers published under this model are very unlikely to be subject to publication bias. The other kinds of papers unlikely to be subject to publication bias are replication studies. These are studies which attempt to replicate previously published results. Because the aim is to assess how well prior science replicates, there should not be an incentive to only publish “successes” (in fact, some have claimed that replication researchers are biased toward publishing failures).
A famous 2015 paper attempted to replicate 100 studies from top psychology journals, and found that about 40% “successfully replicated” (how replication should be defined is a controversial topic).
The “Many Labs” projects tooks a different approach: instead of performing single replication attempts for lots of studies, they perform lots of replication attempts for small numbers of studies.
5.3.3 Comparing replication studies to meta-analyses
So, we have statistical theory that says publication bias should bias estimated effect sizes upward, and that this bias gets worse as power gets lower. The questions then are:
- How bad is the publication bias in a given body of scientific literature?
- What was the statistical power for the published studies in a given body of scientific literature?
There are meta-analytic tools for assessing publication bias, some of which also attempt to correct this bias. Most analyze some combination of the distributions of p-values, test statistics, standard errors, effect size estimates, and sample sizes.
Here is a paper looking at descriptively at p-values and noting how many fall just below 0.05..
There are meta-analytic tools for assessing average power among a set of studies.
Here is a method known as “z-curve”
A 2020 study compared published meta-analyses (which combined studies potentially subjectm to publication bias) to published replication studies (in which there is no publication bias; replication studies will report results whether or not they are statistically significant):
https://www.nature.com/articles/s41562-019-0787-z
Here is the abstract:
Many researchers rely on meta-analysis to summarize research evidence. However, there is a concern that publication bias and selective reporting may lead to biased meta-analytic effect sizes. We compare the results of meta-analyses to large-scale preregistered replications in psychology carried out at multiple laboratories. The multiple-laboratory replications provide precisely estimated effect sizes that do not suffer from publication bias or selective reporting. We searched the literature and identified 15 meta-analyses on the same topics as multiple-laboratory replications. We find that meta-analytic effect sizes are significantly different from replication effect sizes for 12 out of the 15 meta-replication pairs. These differences are systematic and, on average, meta-analytic effect sizes are almost three times as large as replication effect sizes. We also implement three methods of correcting meta-analysis for bias, but these methods do not substantively improve the meta-analytic results.
How bad of a problem is publication bias and effect size bias? It depends on the field of research, but in some fields the problem is severe.
References
we will also see that this practice in controversial↩︎