Chapter 7 Exploring Platform Preferences based on Age Categories
For this assignment, I will analyze data from different streaming platforms along with the age of the subscribers to see if age plays a significant role when it comes to streaming platform preference.
7.1 Data Preparation
Let’s set up and clean the data.
library(readxl)
streaming_data <- read_excel("data/Streaming Services and Age.xlsx")
head(streaming_data)
## # A tibble: 6 × 2
## AgeCat Platform
## <chr> <chr>
## 1 18–25 Other
## 2 18–25 Hulu
## 3 18–25 Netflix
## 4 18–25 Netflix
## 5 18–25 Amazon
## 6 18–25 NetflixLet’s create a contingency table for each age category per platform of preference.
##
##         Amazon Disney+ Hulu Netflix Other
##   18–25      4      22   23      47     4
##   26–40     11      25   16      41     7
##   41+       39      14    7      23    17
7.2 Visualization
## Warning: package 'ggthemes' was built under R version 4.5.2##
## Attaching package: 'ggthemes'## The following object is masked from 'package:mosaic':
##
## theme_mapstacked_bar_chart <- ggplot(streaming_data, aes(x=Platform, fill = AgeCat)) +
geom_bar(position = "fill") +
labs(
title="Stacked Bar Chart Preferences By Age Group",
x = "Platform",
y = "Age Group"
) +
theme_fivethirtyeight()
stacked_bar_chart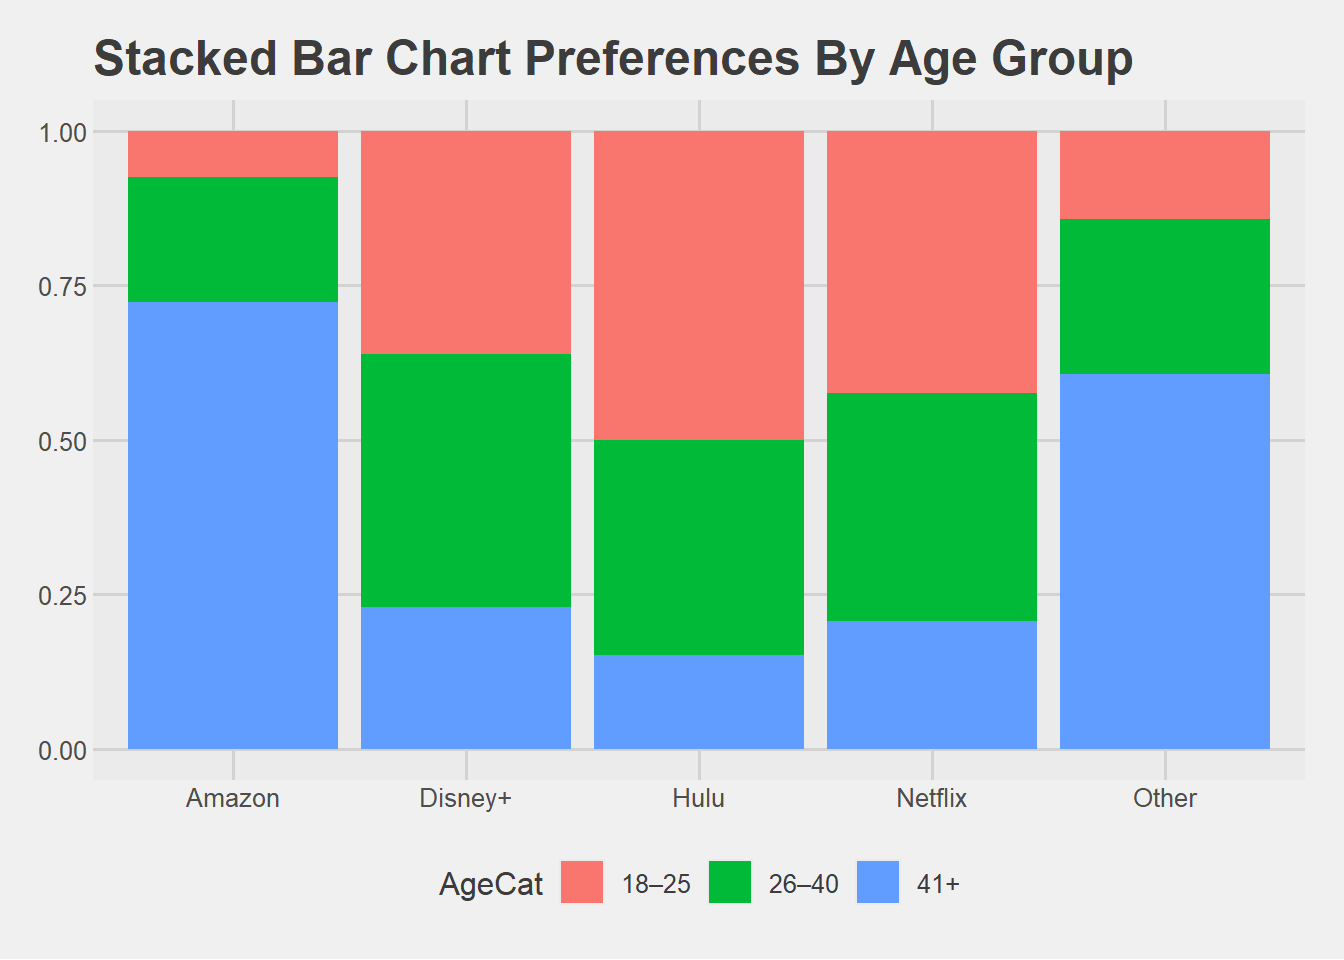
Figure 7.1: This graph shows how streaming platform selections vary by age category.
library(tidyverse)
library(ggthemes)
clustered_stacked_graph <- ggplot(streaming_data, aes(x=Platform, fill = AgeCat)) +
geom_bar(position = "dodge") +
geom_text(
stat = "count",
aes(label=after_stat(count)),
position = position_dodge(width = 0.8),
vjust=-0.2,
size = 3)
labs(
title="Clustured Bar Chart Preferences By Age Group",
x = "Platform",
y = "AgeCat"
) +
theme_fivethirtyeight()## NULL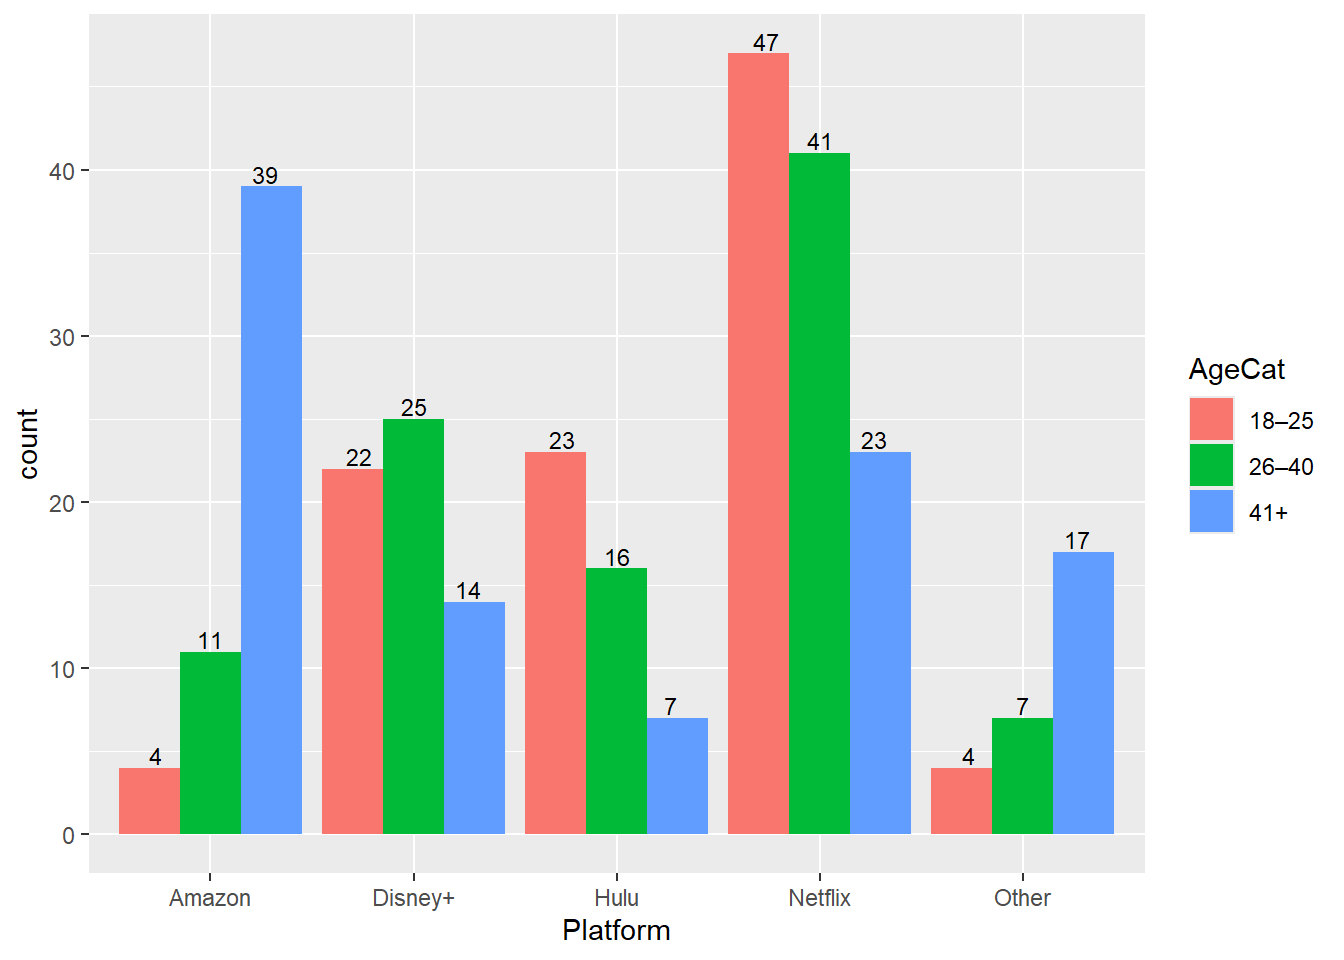
Figure 7.2: This graph shows streaming platform preferences by age category.
7.3 Chi-Square Test of Independence
Let’s perform a Chi-square of Independence to see whether Age Category and Platform Preference are related.
##
##  Pearson's Chi-squared test
##
## data:  c_table
## X-squared = 68.044, df = 8, p-value = 1.203e-11
The Chi-Square statistic (χ² = 68.044), Degrees of freedom (df = 8), and the p-value = 1.203e-11.
7.4 Observed, Expected, and Residual Values
Let’s examine Observed counts, Expected counts, and Residuals from the table.
##
##         Amazon Disney+ Hulu Netflix Other
##   18–25      4      22   23      47     4
##   26–40     11      25   16      41     7
## 41+ 39 14 7 23 17##
## Amazon Disney+ Hulu Netflix Other
## 18–25 18 20.33333 15.33333 37 9.333333
## 26–40 18 20.33333 15.33333 37 9.333333
## 41+ 18 20.33333 15.33333 37 9.333333##
## Amazon Disney+ Hulu Netflix Other
## 18–25 -3.2998316 0.3696106 1.9578900 1.6439899 -1.7457431
## 26–40 -1.6499158 1.0349098 0.1702513 0.6575959 -0.7637626
## 41+ 4.9497475 -1.4045204 -2.1281413 -2.3015858 2.5095057The 18-25 age group showed less than the epxected values for Amazon (Obs = 4, Exp = 18, and Res = -3.30) and just a little bit more for Disney+ (Obs = 25, Exp = 20.33, and Res = 0.37), and much more than the expected values for Hulu and Netflix [Hulu ( Obs = 23, Exp = 20, and Res = 1.96), Netflix (Obs = 47, Exp = 37, and Res = 1.64)].
The 26-40 age group showed more than the epxected values for Amazon (Obs = 11, Exp = 18, and Res = -1.65) and just a little bit more for Disney+ (Obs = 25, Exp = 20.33, and Res = 1.03) and Hulu (Obs = 15, Exp = 15.33, and Res = -2.13), and way more than the expected values for Netflix (Obs = 41, Exp = 15.33, and Res = 0.66).
The 41+ age group showed more than the epxected values for Amazon (Obs = 39, Exp = 18, and Res = 4.95) and just a little bit less for Disney+ (Obs = 14, Exp = 20.33, and Res = -1.40) and more for Hulu (Obs = 23, Exp = 15.33, and Res = -2.13), and way less for Netflix (Obs = 23, Exp = 15.33, and Res = -2.30).
7.5 Contributions to the Chi-Square Statistic
##
##              Amazon     Disney+        Hulu     Netflix       Other
##   18–25 10.88888889  0.13661202  3.83333333  2.70270270  3.04761905
##   26–40  2.72222222  1.07103825  0.02898551  0.43243243  0.58333333
## 41+ 24.50000000 1.97267760 4.52898551 5.29729730 6.29761905##
## Amazon Disney+ Hulu Netflix Other
## 18–25 16.00277665 0.20077087 5.63363056 3.97200744 4.47891125
## 26–40 4.00069416 1.57404361 0.04259834 0.63552119 0.85729161
## 41+ 36.00624747 2.89913133 6.65599073 7.78513459 9.25525020## Warning: package 'pheatmap' was built under R version 4.5.2pheatmap(perc_cont,
display_numbers = TRUE,
cluster_rows = FALSE,
cluster_cols = FALSE,
main = "% Contribution to Chi-Square Statistic")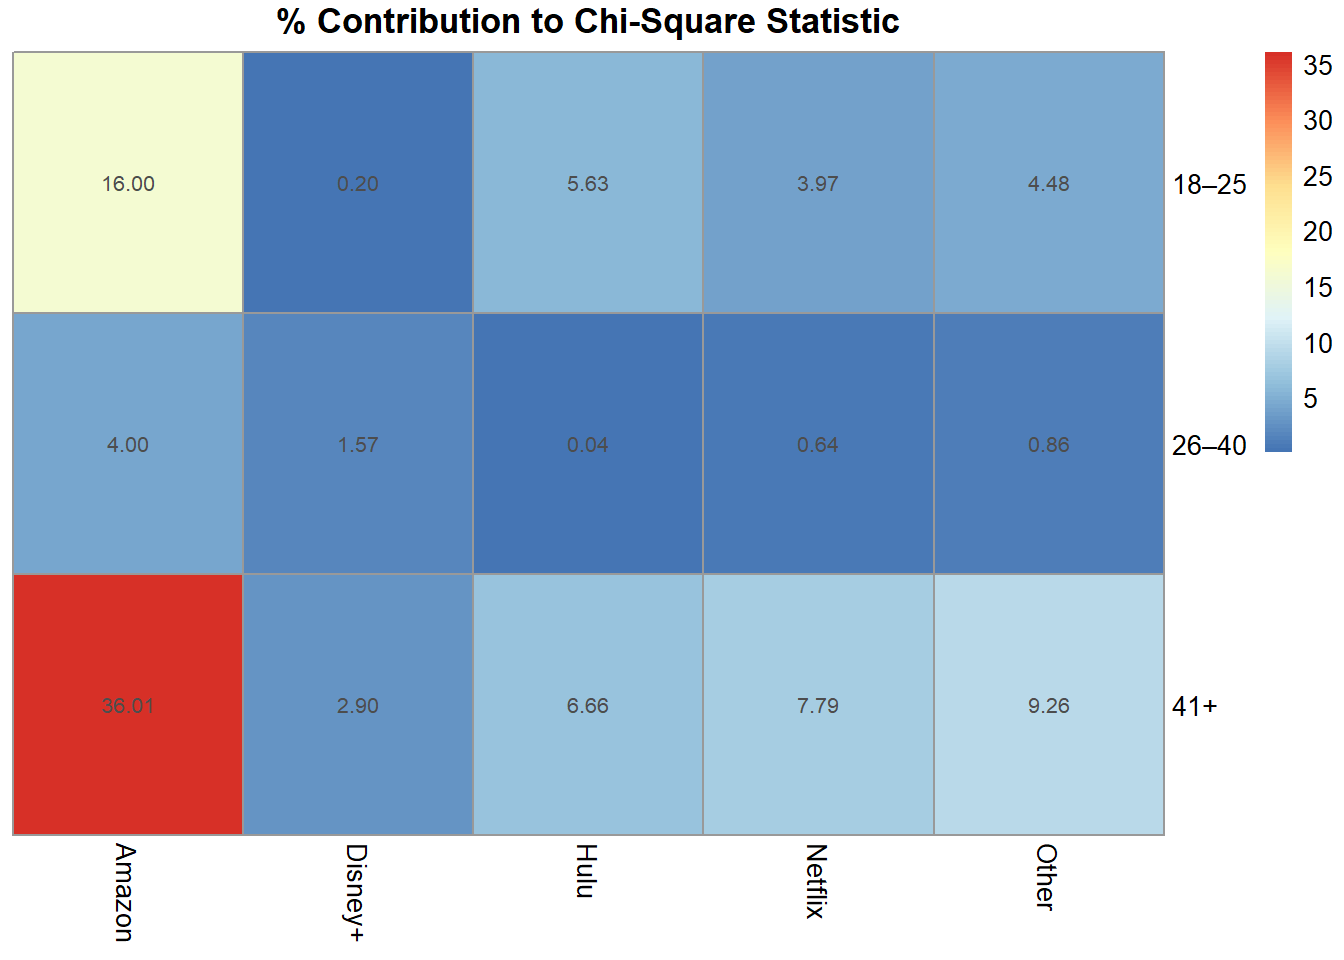
The cell that contributes the most to the Chi-square statistic is the 41+ (Amazon) while it seems like groups, such as 18-25 and 26-40 do not seem to show a preference when it comes to streaming platforms.
7.6 Effect Size (Cramer’s V)
## Warning: package 'DescTools' was built under R version 4.5.2##
## Attaching package: 'DescTools'## The following objects are masked from 'package:Hmisc':
##
## %nin%, Label, Mean, Quantile## The following object is masked from 'package:mosaic':
##
## MAD## [1] 0.3367584The effect size 0.3368, which is statistically considered to be a moderate effect between AgeCat and Platform variables.
7.7 Final Interpretation
The Chi-Square test revealed a significant relationship between age and platform preference, χ²(8, N = 300) = 68.004, p = 1.203e-11. The largest contributions came from the 41+ age group and Amazon cells. Cramer’s V = 0.37 indicates a weak-to-moderate association. This suggests that older viewers favor Amazon, while younger adults seem to show a preference for streaming platforms such as Netflix like. These insights could help streaming services tailor content and marketing strategies to specific age demographics.