8.4 Many respondents
8.4.1 Estimate part-worths and importance weights
Now, let’s carry out the conjoint analysis on the full dataset to get an idea of which ice creams the 15 respondents, on average, liked the most and how important each attribute is:
conjoint_allrespondents <- conjoint(icecream, rvar = "rating", evar = c("Flavor","Packaging","Light","Organic")) # same as before, but different dataset.

summary(conjoint_allrespondents)
## Conjoint analysis
## Data : icecream
## Response variable : rating
## Explanatory variables: Flavor, Packaging, Light, Organic
##
## Conjoint part-worths:
## Attributes Levels PW
## Flavor Chocolate 0.000
## Flavor Mango 1.522
## Flavor Raspberry 0.522
## Flavor Strawberry 0.767
## Flavor Vanilla 1.389
## Packaging Cone 0.000
## Packaging Homemade waffle -0.244
## Packaging Pint -0.100
## Light Low fat 0.000
## Light No low fat 0.478
## Organic Not organic 0.000
## Organic Organic 0.307
## Base utility ~ 4.358
##
## Conjoint importance weights:
## Attributes IW
## Flavor 0.597
## Packaging 0.096
## Light 0.187
## Organic 0.120
##
## Conjoint regression results:
##
## coefficient
## (Intercept) 4.358
## Flavor|Mango 1.522
## Flavor|Raspberry 0.522
## Flavor|Strawberry 0.767
## Flavor|Vanilla 1.389
## Packaging|Homemade waffle -0.244
## Packaging|Pint -0.100
## Light|No low fat 0.478
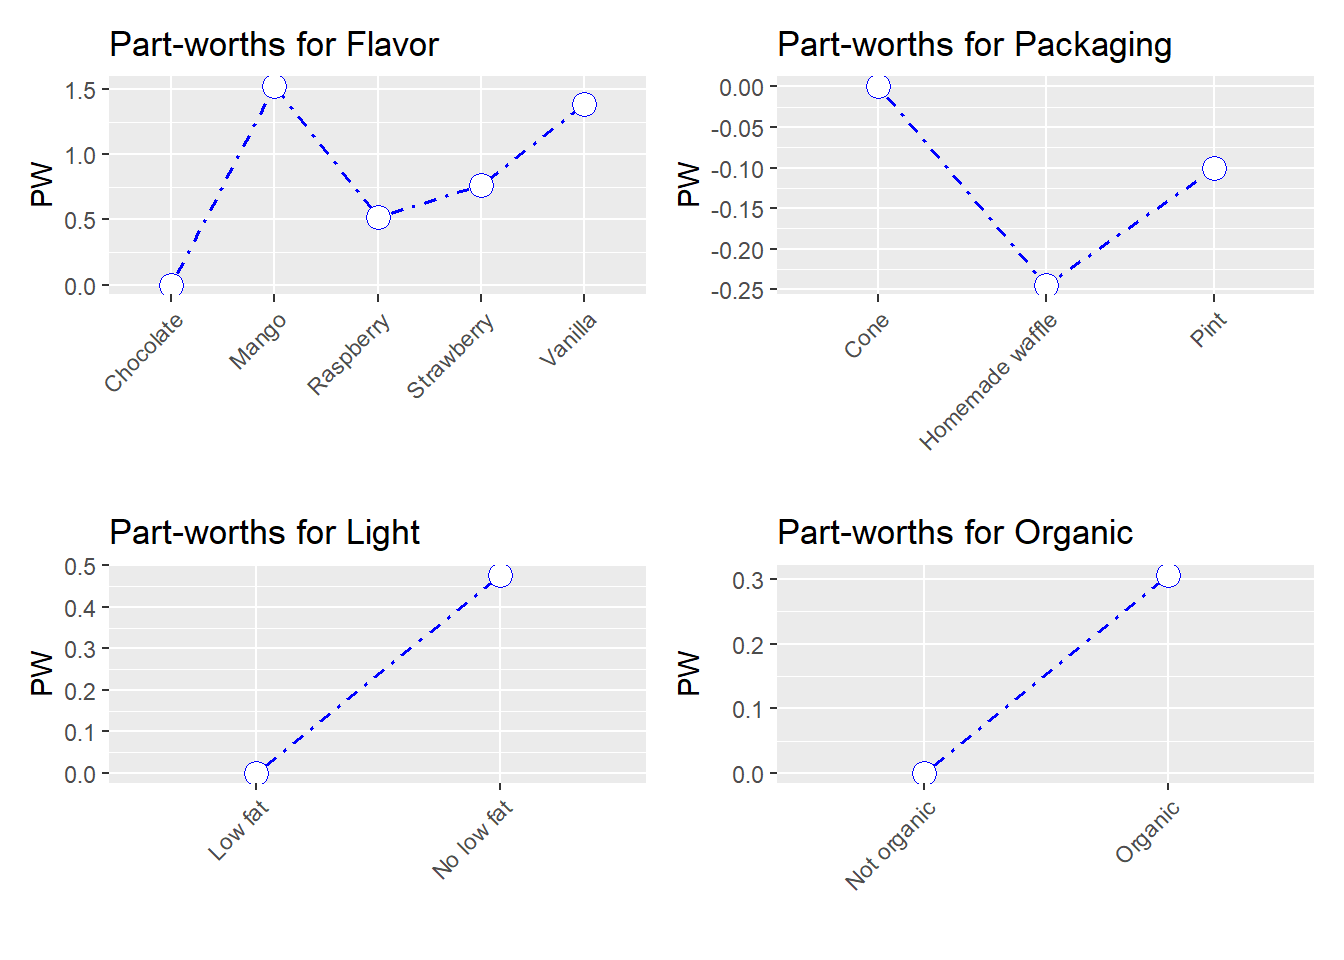
## Organic|Organic 0.307Flavor is by far the most important attribute. Let’s plot these results:
plot(conjoint_allrespondents)
From this, we predict that, on average, people would most like an organic, non low fat, mango ice cream in a cone.
The importance weights tell us how strongly each attribute determines the average rating of an ice cream. Flavor is the most important attribute and packaging is the least important attribute. This respondent’s rating is determined for 59.7 percent by flavor and for 9.6 percent by packaging.
8.4.2 Profiles: predicted utilities
Let’s predict the ratings of all possible ice creams:
predict(conjoint_allrespondents, profiles.all) %>% # check previous sections for profiles.all
  arrange(desc(Prediction)) # show the ice creams with the highest predicted rating on top
## Conjoint Analysis
## Data : icecream
## Response variable : rating
## Explanatory variables: Flavor, Packaging, Light, Organic
## Prediction dataset : profiles.all
## Rows shown : 20 of 60
##
## Flavor Packaging Light Organic Prediction
## Mango Cone No low fat Organic 6.664
## Mango Pint No low fat Organic 6.564
## Vanilla Cone No low fat Organic 6.531
## Vanilla Pint No low fat Organic 6.431
## Mango Homemade waffle No low fat Organic 6.420
## Mango Cone No low fat Not organic 6.358
## Vanilla Homemade waffle No low fat Organic 6.287
## Mango Pint No low fat Not organic 6.258
## Vanilla Cone No low fat Not organic 6.224
## Mango Cone Low fat Organic 6.187
## Vanilla Pint No low fat Not organic 6.124
## Mango Homemade waffle No low fat Not organic 6.113
## Mango Pint Low fat Organic 6.087
## Vanilla Cone Low fat Organic 6.053
## Vanilla Homemade waffle No low fat Not organic 5.980
## Vanilla Pint Low fat Organic 5.953
## Mango Homemade waffle Low fat Organic 5.942
## Strawberry Cone No low fat Organic 5.909
## Mango Cone Low fat Not organic 5.880
## Vanilla Homemade waffle Low fat Organic 5.809Same conclusions as before: we predict that, on average, people would most like an organic, non low fat, mango ice cream in a cone.