1 Preface

Suggested citation:
Ziller, Conrad (2024). Introduction to Statistics and Data Analysis – A Case-Based Approach. Available online at https://bookdown.org/conradziller/introstatistics
To download the R-Scripts and data used in this book, go HERE.
A PDF-version of the book can be downloaded HERE.
Motivation for this Book
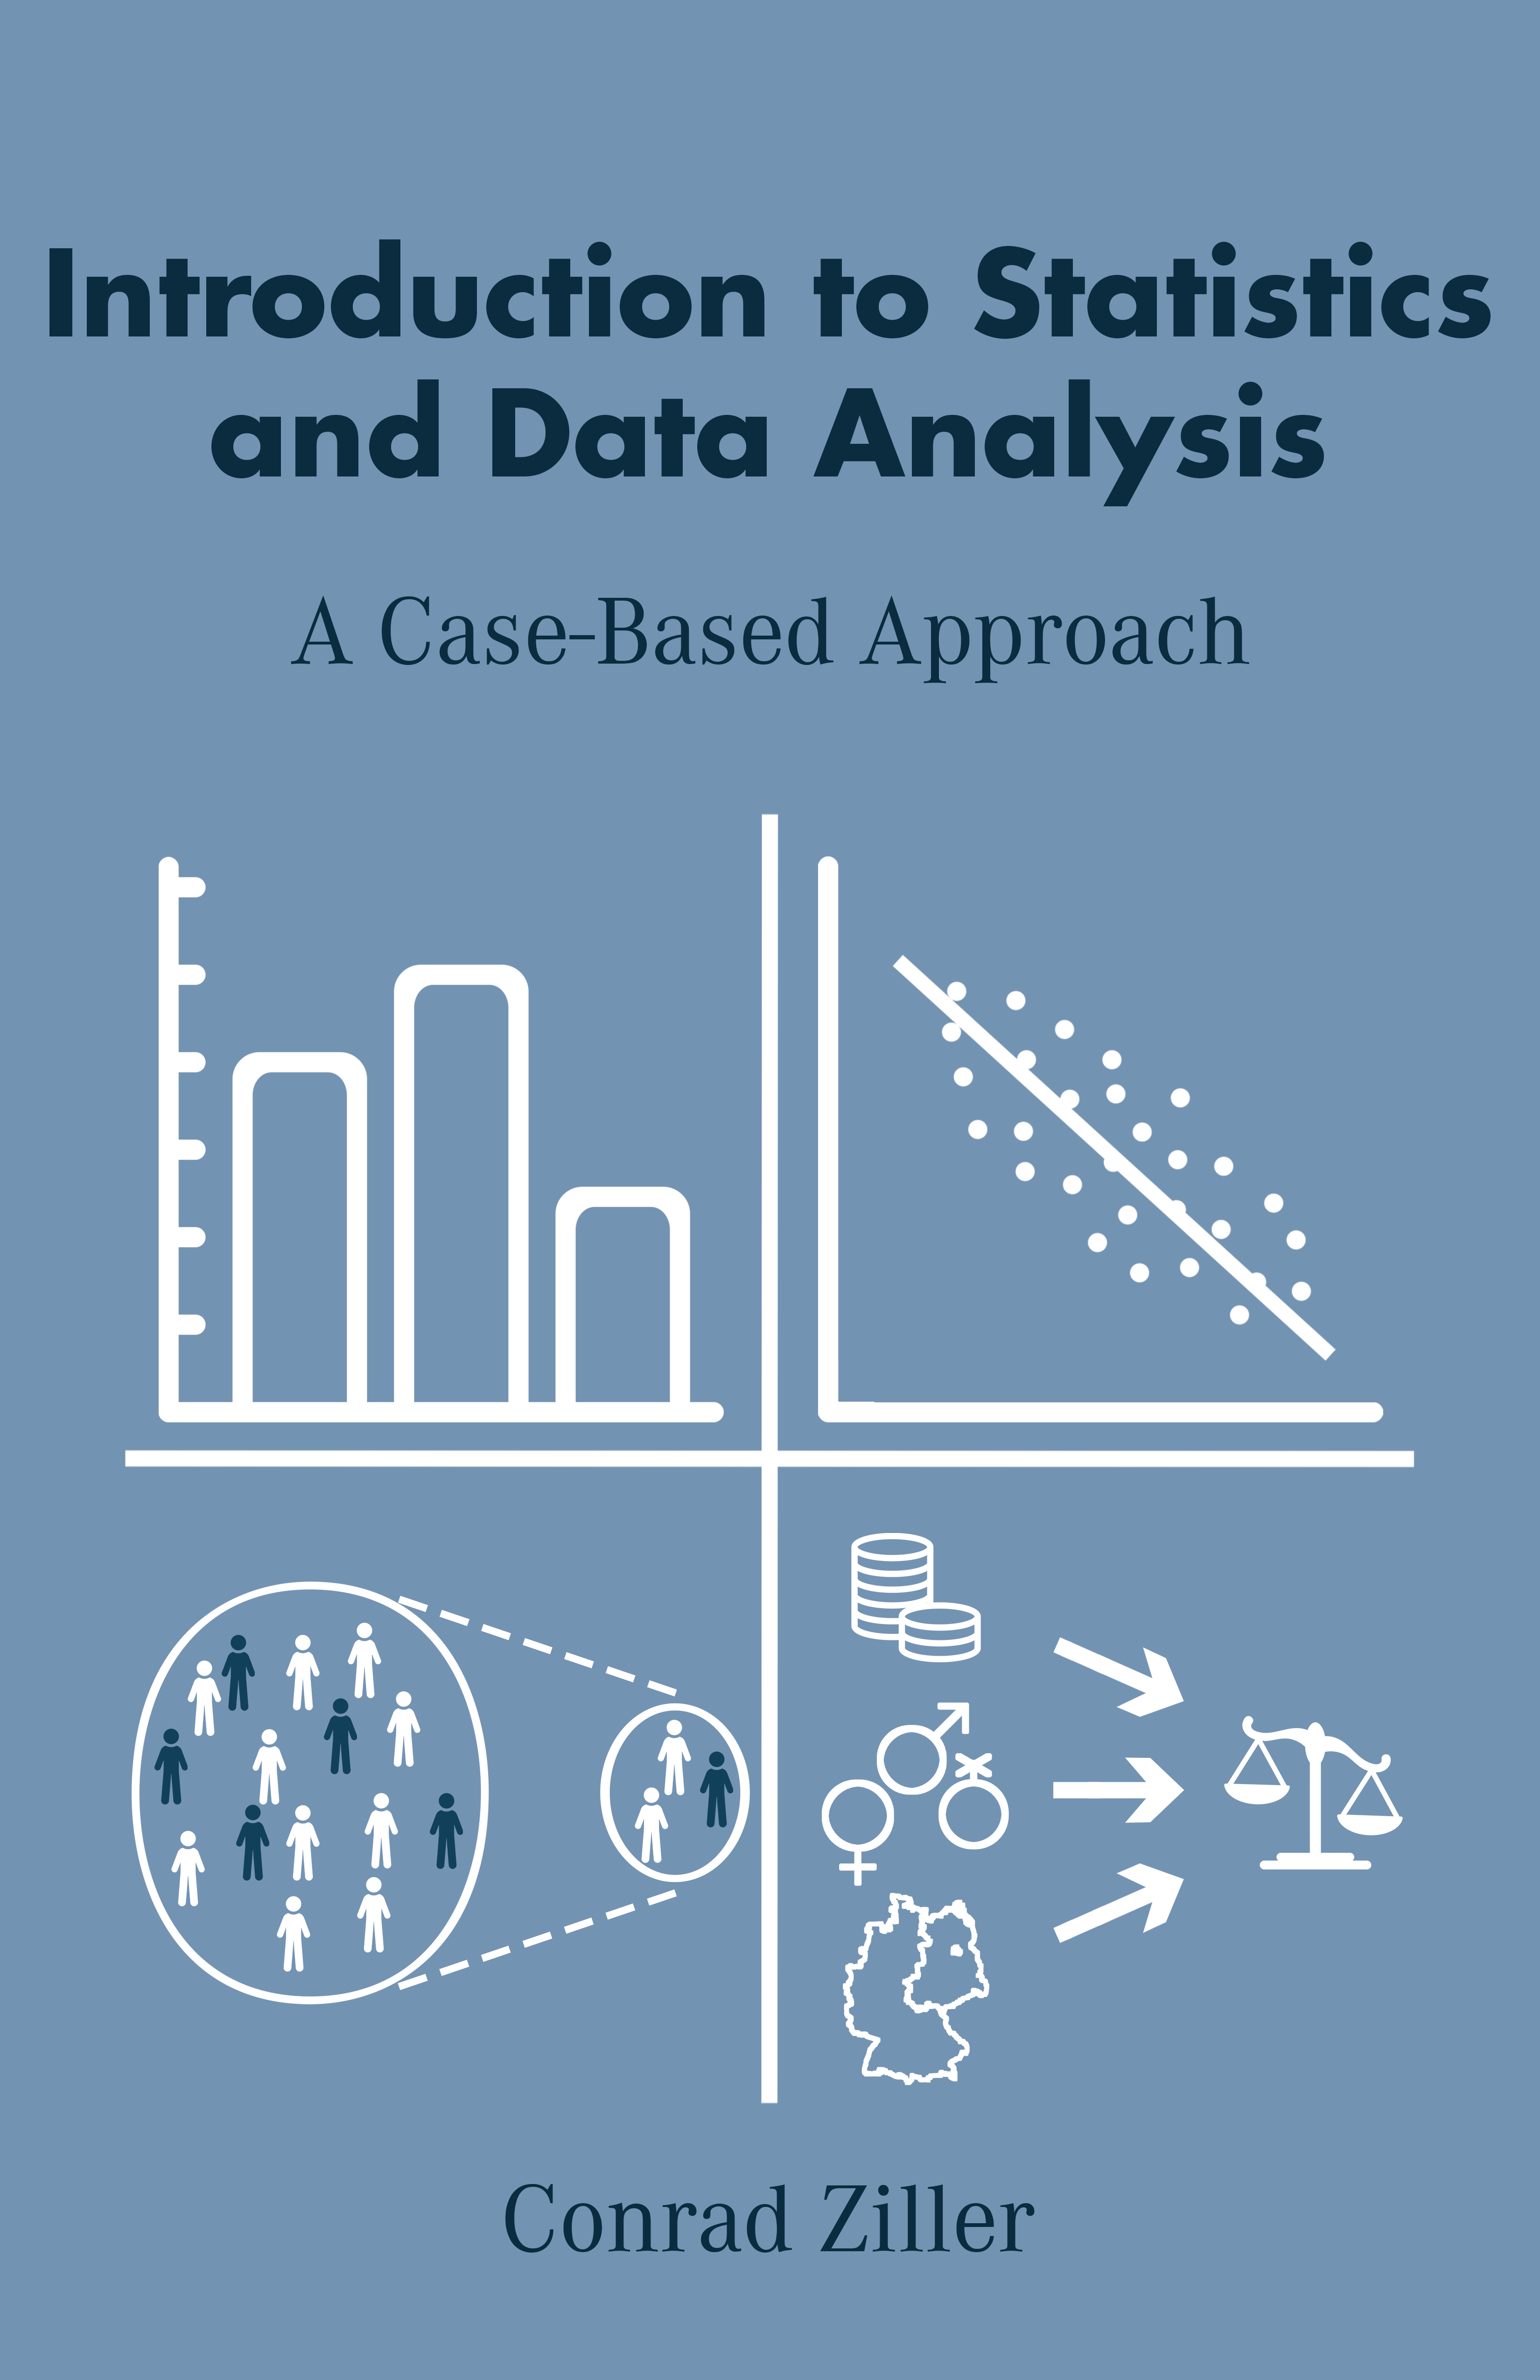
This short book is a complete introduction to statistics and data analysis using R and RStudio. It contains hands-on exercises with real data—mostly from social sciences. In addition, this book presents four key ingredients of statistical data analysis (univariate statistics, bivariate statistics, statistical inference, and regression analysis) as brief case studies. The motivation for this was to provide students with practical cases that help them navigate new concepts and serve as an anchor for recalling the acquired knowledge in exams or while conducting their own data analysis.
The case study logic is expected to increase motivation for engaging with the materials. As we all know, academic teaching is not the same as before the pandemic. Students are (rightfully) increasingly reluctant to chalk-and-talk techniques of teaching, and we have all developed dopamine-related addictions to social media content which have considerably shortened our ability to concentrate. This poses challenges to academic teaching in general and complex content such as statistics and data science in particular.
How to Use the Book
This book consists of four case studies that provide a short, yet comprehensive, introduction to statistics and data analysis. The examples used in the book are based on real data from official statistics and publicly available surveys. While each case study follows its own logic, I advise reading them consecutively. The goal is to provide readers with an opportunity to learn independently and to gather a solid foundation of hands-on knowledge of statistics and data analysis. Each case study contains questions that can be answered in the boxes below. The solutions to the questions can be viewed below the boxes (by clicking on the arrow next to the word “solution”). It is advised to save answers to a separate document because this content is not saved and cannot be accessed after reloading the book page.
A working sheet with questions, answer boxes, and solutions can be downloaded together with the R-Scrips HERE. You can read this book online for free. Copies in printable format may be ordered from the author.
This book can be used for teaching by university instructors, who may use data examples and analyses provided in this book as illustrations in lectures (and by acknowledging the source). This book can be used for self-study by everyone who wants to acquire foundational knowledge in basic statistics and practical skills in data analysis. The materials can also be used as a refresher on statistical foundations.
Beginners in R and RStudio are advised to install the programs via the following link https://posit.co/download/rstudio-desktop/ and to download the materials from HERE. The scripts from this material can then be executed while reading the book. This helps to get familiar with statistical analysis, and it is just an awesome feeling to get your own script running! (On the downside, it is completely normal and part of the process that code for statistical analysis does not work. This is what helpboards across the web and, more recently, ChatGPT are for. Just google your problem and keep on trying, it is, as always, 20% inspiration and 80% consistency.)
Organization of the Book
The book contains four case studies, each showcasing unique statistical and data-analysis-related techniques.
- Section 2: Univariate Statistics – Case Study Socio-Demographic Reporting
Section 2 contains material on the analysis of one variable. It presents measures of typical values (e.g., the mean) and the distribution of data.
- Section 3: Bivariate Statistics - Case Study 2020 United States Presidential Election
Section 3 contains material on the analysis of the relationship between two variables, including cross tabs and correlations.
- Section 4: Statistical Inference - Case Study Satisfaction with Government
Section 4 introduces the concept of statistical inference, which refers to inferring population characteristics from a random sample. It also covers the concepts of hypothesis testing, confidence intervals, and statistical significance.
- Section 5: Regression Analysis - Case Study Attitudes Toward Justice
Section 5 covers how to conduct multiple regression analysis and interpret the corresponding results. Multiple regression investigates the relationship between an outcome variable (e.g., beliefs about justice) and multiple variables that represent different competing explanations for the outcome.
Acknowledgments
Thank you to Paul Gies, Phillip Kemper, Jonas Verlande, Teresa Hummler, Paul Vierus, and Felix Diehl for helpful feedback on previous versions of this book. I want to thank Achim Goerres for his feedback early on and for granting me maximal freedom in revising and updating the materials of his introductory lectures on Methods and Statistics, which led to the writing of this book. Earlier versions of this book have been used in teaching courses on statistics in the Political Science undergraduate program at the University of Duisburg-Essen.
Outlook
The final part of the book is about linear regression analysis, which is the natural endpoint for a course on introductory statistics. However, the “ordinary” regression is where many further useful techniques come into play—most of which can subsumed under the label “Advanced Regression Models”. You will need them when analyzing, for example, panel data where the same respondents were interviewed multiple times or spatially clustered data from cross-national surveys.
I will extend this introduction with case studies on advanced regression techniques soon. If you want to get notified when this material is online, please sign up with your email address here: https://forms.gle/T8Hvhq3EmcywkTdFA.
In the meantime, I have a chapter on “Multiple Regression with Non-Independent Observations: Random-Effects and Fixed-Effects” that can be downloaded via https://ssrn.com/abstract=4747607.
For feedback on the usefulness of the introduction and/or reports on errors and misspellings, I would be utmost thankful if you would send me a short notification at conrad.ziller@uni-due.de.
Thanks much for engaging with this introduction!
The online version of this book is licensed under the Creative Commons Attribution-NonCommercial-ShareAlike 4.0 International License.