4 Methods
4.1 Outline
4.2 Population Background
The population of pigs used in the present study was owned by The Maschhoff’s, LLC (Carlyle, Illinois, USA) and originated in the early 2000s. The majority of animals in this population were from three genetic lines (Duroc, Landrace, or Yorkshire). Within each genetic line, selection indexes were utilized to identify boars and gilts with superior genetic merit to return to the breeding population at the nucleus level. Selection indices for all lines included expected progeny differences for growth and carcass traits such as increased feed efficiency and growth rate, decreased backfat depth, and increased Longissimus muscle area. However, selection indices for the Landrace and Yorkshire lines also emphasized maternal reproductive traits and included expected progeny differences for increased number and weight of piglets born and weaned. After several years of index selection within each purebred line at the nucleus level, a commercial test herd was established in 2016. The objective of the commercial test herd was to evaluate the progeny of Duroc sires bred to Landrace × Yorkshire dams (considered Crossbred in the present study) for growth, feed efficiency, and carcass traits in commercial weaning-to-finishing and slaughter conditions. Weaning-to-finishing growth performance (average daily gain, average daily feed intake, and feed-to-gain ratio) and carcass measurements (Fat-O-Meater backfat and loin muscle depth) from the Crossbred progeny reared in commercial test centers were used to calculate crossbred expected progeny differences for Duroc nucleus animals. These crossbred expected progeny differences were included and utilized in the selection index and selection decisions for the Duroc genetic line.
4.3 Pedigree and Genotype Data
A pedigree consisting of individual, sire, and dam identification, birth date, and genetic line for 1,267,652 pigs was provided by The Maschhoff’s. Within the entire pedigree, there were 690,202, 117,836, 242,699, and 216,915 pigs from the Crossbred, Duroc, Landrace, and Yorkshire genetic lines, respectively. Summary information regarding the number of sires and dams, founder pigs, and generations within each genetic line is presented in Table 4.1. Complete sire and dam pedigree information for individuals dating back to founder pigs was present for Duroc, Landrace, and Yorkshire pigs. Due to the nature of the commercial testing program, sire pedigree information dating back to Duroc founder pigs was known for the Crossbred pigs; however, only the identification numbers of the dams of these pigs were provided.
| Line | Pigs, n | Founders, n | Sires, n | Dams, n | Birth date, min | Birth date, max | Generations, n |
|---|---|---|---|---|---|---|---|
| Crossbred | 690193 | 2025 | 647 | 19627 | 2015-03-01 | 2020-08-01 | 14 |
| Duroc | 114038 | 742 | 939 | 6190 | 1982-03-01 | 2020-09-01 | 14 |
| Landrace | 236385 | 1778 | 706 | 12856 | 1993-01-01 | 2020-09-01 | 11 |
| Yorkshire | 207366 | 730 | 765 | 10749 | 1980-06-01 | 2020-09-01 | 14 |
On a subset of pigs from each genetic line (8532, 16,802, 19,342, and 18,368 pigs from the Crossbred, Duroc, Landrace, and Yorkshire genetic lines, respectively), SNP assays were collected using a GGP Porcine 50K (Neogen, Corp., Lansing, Michigan, USA) genotyping chip. Sample collection and subsequent genotyping was conducted on all viable male selection candidates prior to removal from performance testing trials. In addition, all female animals that were selected to return to the nucleus breeding herd were genotyped. Similar to Table 4.1, summary information regarding the number of sires and dams, founder pigs, birth date ranges, and generations for genotyped pigs within each genetic line is provided in Table 4.2.
| Line | Pigs, n | Founders, n | Sires, n | Dams, n | Birth date, min | Birth date, max | Generations, n |
|---|---|---|---|---|---|---|---|
| Crossbred | 8532 | 35 | 206 | 4428 | 2015-03-01 | 2019-09-01 | 13 |
| Duroc | 16802 | 17 | 500 | 3596 | 2010-08-01 | 2020-04-01 | 14 |
| Landrace | 19342 | 82 | 512 | 5862 | 2010-08-01 | 2020-04-01 | 10 |
| Yorkshire | 18368 | 18 | 446 | 5367 | 2011-01-01 | 2020-04-01 | 14 |
4.4 Preparation of genotype data and overview of analyses
The dependent variable for all analyses in the present study was pedigree age (AGE) and was calculated as the difference (in months) between each pig’s birth month and January 2006. Pigs from the entire sample of genotyped pigs were separated into 12 subgroups based on genetic line. Subsequent analyses were conducted using only SNPs located on the autosomal chromosomes for Sus scrofa (chromosome numbers 1 through 18). Genotype filtering for quality control was performed in PLINK v1.9 (Purcell et al., 2007) for each subgroup on assays containing 47,636 autosomal SNPs for each pig. Any SNP that had a call rate > 0.10 or a minor allele frequency > 0.01 was removed from the SNP assay. In addition, individual pigs with a call rate > 0.10 were filtered from the dataset. Genomic relationship matrices were estimated for each subgroup using the software GCTA v1.93.2 (Yang et al., 2011) and the method described by Yang et al. (2010), and these GRMs were utilized in all subsequent analyses. Depending on subgroup, certain combinations of the following three statistical analyses were performed on AGE: 1) univariate variance component estimation (UVCE), 2) bivariate variance component estimation (BVCE), and 3) univariate genome-wide association using a mixed linear model to estimate SNP effects. A summary of the number of pigs and SNPs after quality control and all subsequent analyses performed for each subgroup are presented in Table 4.3. Descriptive statistics of AGE by genetic line were calculated using the dplyr package (Wickham et al., 2020) of the statistical analysis software R (R Core Team, 2020).
| Subgroup | Genetic lines | Pigs, n | SNPs, n | UVCE | BVCE | GWAA |
|---|---|---|---|---|---|---|
| 1 | Crossbred | 8447 | 46529 | X |
|
X |
| 2 | Duroc | 16633 | 38377 | X |
|
X |
| 3 | Landrace | 18834 | 45316 | X |
|
X |
| 4 | Yorkshire | 17764 | 45196 | X |
|
X |
| 5 | Crossbred, Duroc | 25091 | 46348 |
|
X |
|
| 6 | Crossbred, Landrace | 27281 | 46431 |
|
X |
|
| 7 | Crossbred, Yorkshire | 26221 | 46426 |
|
X |
|
| 8 | Duroc, Landrace | 35480 | 46064 |
|
X |
|
| 9 | Duroc, Yorkshire | 34417 | 46143 |
|
X |
|
| 10 | Landrace, Yorkshire | 36609 | 46236 |
|
X |
|
| 11 | Duroc, Landrace, Yorkshire | 53256 | 46421 | X |
|
X |
| 12 | Crossbred, Duroc, Landrace, Yorkshire | 61702 | 46453 | X |
|
X |
4.5 Univariate variance component estimation
To estimate the proportion of variance in AGE explained by genome-wide SNPs (PVE; otherwise termed SNP heritability) for each purebred subgroup, all purebred pigs, and the entire genotyped sample (Table 4.3), the following model was fit using GCTA:
\[ y = 1\mu + Zg + e \]
\[ u \sim N(0, G\sigma_g^2) \]
\[ e \sim N(0, I\sigma_e^2) \]
where y was a vector of observations for AGE, \(\mu\) was the overall mean, g was a vector of random polygenic effects, Z was an incidence matrix relating AGE in y to random polygenic effects in g, and e was a vector of random residuals, G was the genomic relationship matrix, and I was an identity matrix. Additive genetic (\(\sigma_g^2\)) and residual (\(\sigma_e^2\)) variance components were derived using average information restricted maximum likelihood. The proportion of variance explained by SNPs was then estimated as follows:
\[ PVE = \frac{\sigma_g^2}{\sigma_g^2 + \sigma_e^2} \]
4.6 Bivariate variance component estimation
Genetic correlations (rG) between each genetic line (Table 4.3) for AGE were estimated using bivariate mixed linear models, fitted in GCTA, of the following form:
\[ y_1 = 1\mu + Zg_1 + e_1 \]
\[ y_2 = 1\mu + Zg_2 + e_2 \]
where \(y_1\) and \(y_2\) were vectors of observations for AGE for genetic lines 1 and 2, was the overall mean, \(g_1\) and \(g_2\) were vectors of random polygenic effects for each pig in genetic lines 1 and 2, \(e_1\) and \(e_2\) were residuals for AGE of genetic lines 1 and 2, and \(Z_1\) and \(Z_2\) were incidence matrices for the random polygenic effects in \(g_1\) and \(g_2\), respectively. Additive genetic variance of \(g_1\) and \(g_2\) (\(\sigma_{g_1}^2\) and \(\sigma_{g_2}^2\), respectively), additive genetic covariance between \(g_1\) and \(g_2\) (\(\sigma_{g_1g_2}\)), and residual variance of \(e_1\) and \(e_2\) (\(\sigma_{e_1}^2\) and \(\sigma_{e_2}^2\), respectively) were estimated using average information restricted maximum likelihood with the variance-covariance matrix (V) defined as:
\[ V = \left[\begin{array} {cc} Z_1GZ_1^\prime\sigma_{g_1}^2 + I\sigma_{e_1}^2 & Z_1GZ_2^\prime\sigma_{g_1g_2} \\ Z_2GZ_1^\prime\sigma_{g_1g_2} & Z_2GZ_2^\prime\sigma_{g_2}^2 + I\sigma_{e_2}^2 \end{array}\right] \]
where G and I were the genomic relationship and identity matrix, respectively. Genetic correlations were then estimated by GCTA using the following formula:
\[ rG = \frac{\sigma_{g_1g_2}}{\sqrt{\sigma_{g_1}^2\cdot\sigma_{g_2}^2}} \]
4.7 Generation Proxy Selection Mapping
Generation Proxy Selection Mapping analyses were conducted to detect SNPs with allele frequency changes over time within each genetic line, within a subgroup of purebred pigs, and within the entire sample of genotyped pigs (Table 4.3). To accomplish this, univariate mixed linear models were fit in GCTA as part of genome-wide association analyses of AGE, with the models defined as follows:
\[ y = Xb + Zg + e \]
\[ g \sim N(0, G\sigma_g^2) \]
\[ e \sim N(0, I\sigma_e^2) \]
where y was the pig’s generation proxy (AGE), and X was an incidence matrix that relates SNPs to AGE for each pig and b was the estimated allele substitution effect for each SNP. Confounding due to population structure, relatedness, and inbreeding were controlled by the random polygenic term g, and Z was an incidence matrix for the effect g. In addition, G was the genomic relationship matrix and I was an identity matrix. Additive genetic (\(\sigma_g^2\)) and residual (\(\sigma_e^2\)) variance components were estimated using average information restricted maximum likelihood; however, these variance components were not of interest as a part of the GPSM analyses. P-values of estimated SNP effects were converted to false discovery rate (FDR) corrected Q-values using the qvalue package (Storey et al., 2017) of R, and a significance threshold of Q < 0.10 was used for all analyses.
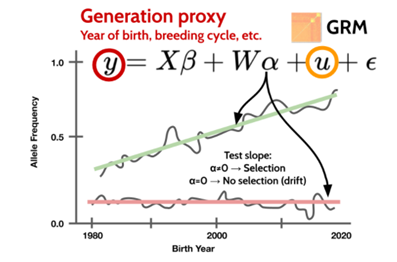
Figure 4.1: GPSM tests for changes in allele frequency greater than would be expected due to random genetic drift. A linear mixed model fitting a genomic relationship matrix (GRM) controls for uneven sampling of generations and family structure (Source: Dr. Troy Rowan, Accessed: https://troyrowan.github.io/project/gpsm/).
4.8 Validation of variance component and GPSM analyses
Variance component and GPSM analyses of purebred pigs (subgroups 2 through 4 and 8 through 11; Table 4.3) were validated using AlphaSimR (Gaynor et al., 2020). The objective of these validation analyses was to ensure results from the analyses performed above were due to artificial selection as opposed to random genetic drift, in the context of the actual pedigrees utilized in The Maschhoff’s breeding program. Founder pig haplotypes (corresponding to the number of founder pigs in each purebred genetic line) were simulated using the AlphaSimR wrapper around MaCS (Chen et al., 2008) for the Duroc, Landrace, and Yorkshire genetic lines, and the random number generator in R was changed between simulations of a different genetic line. Each simulated haplotype contained 18 chromosomes, each with 5,000 segregating sites, for a total of 90,000 SNPs. After the founder pigs and their genotypes were simulated, these haplotypes were randomly dropped through the entire pedigree (genotyped and non-genotyped pigs; Table 4.1) for each purebred genetic line, in a Mendelian fashion, in order to simulate changes in allele frequency due to random genetic drift. Pigs that had been genotyped in each genetic line in The Maschhoff’s breeding program were filtered from the entire pedigree of pigs with simulated genotypes. For each subgroup of purebred pigs listed in Table 4.3, the same number of SNPs that met all quality control standards listed above were selected at random from the 90,000 simulated SNPs in order to provide a one-to-one comparison of real to validation results. All variance component and GPSM analyses that were performed on a subgroup using real data were performed on the same subgroups of pigs with simulated data utilizing the same statistical models, and the results of the real and validation analyses for each subgroup were compared.