Chapter 8 Chapter 8: Pimping Your Plots
install.packages("ggplot2",  repos = "https://cran.us.r-project.org")
install.packages("dplyr",  repos = "https://cran.us.r-project.org")
install.packages("gridExtra", repos = "https://cran.us.r-project.org")library(ggplot2)
library(dplyr)
library(gridExtra)compensation <- read.csv("/Users/peteapicella/Documents/R_tutorials/GSwR/compensation.csv")Create base scatterplot:
eg_scatter <- ggplot(compensation, aes(x = Root, y = Fruit)) +
                     geom_point()
eg_scatter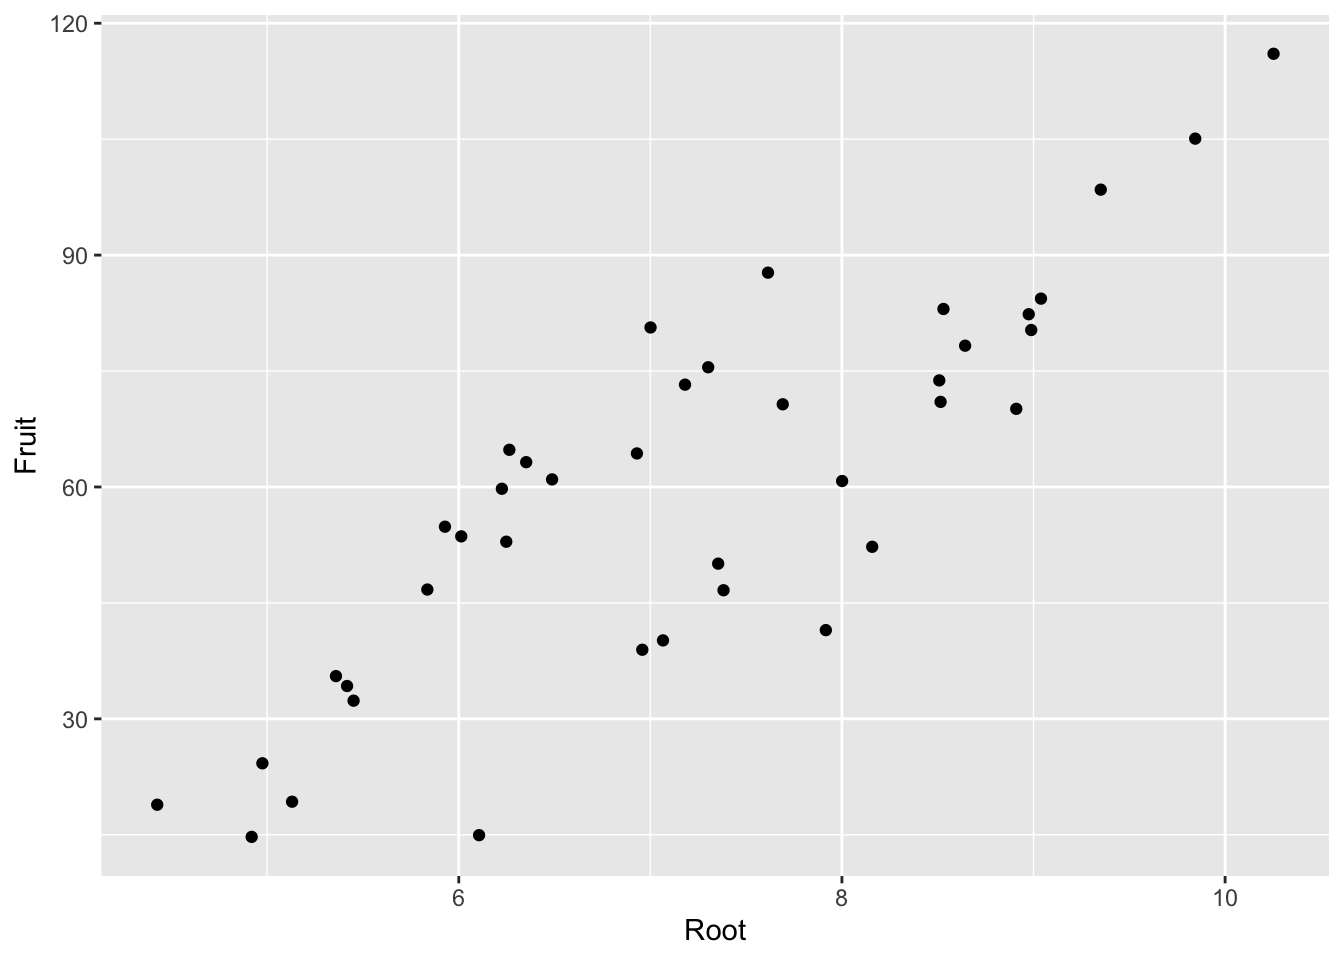
Create base boxplot:
eg_box <- ggplot(compensation, aes(x = Grazing, y = Fruit)) +
  geom_boxplot()
eg_box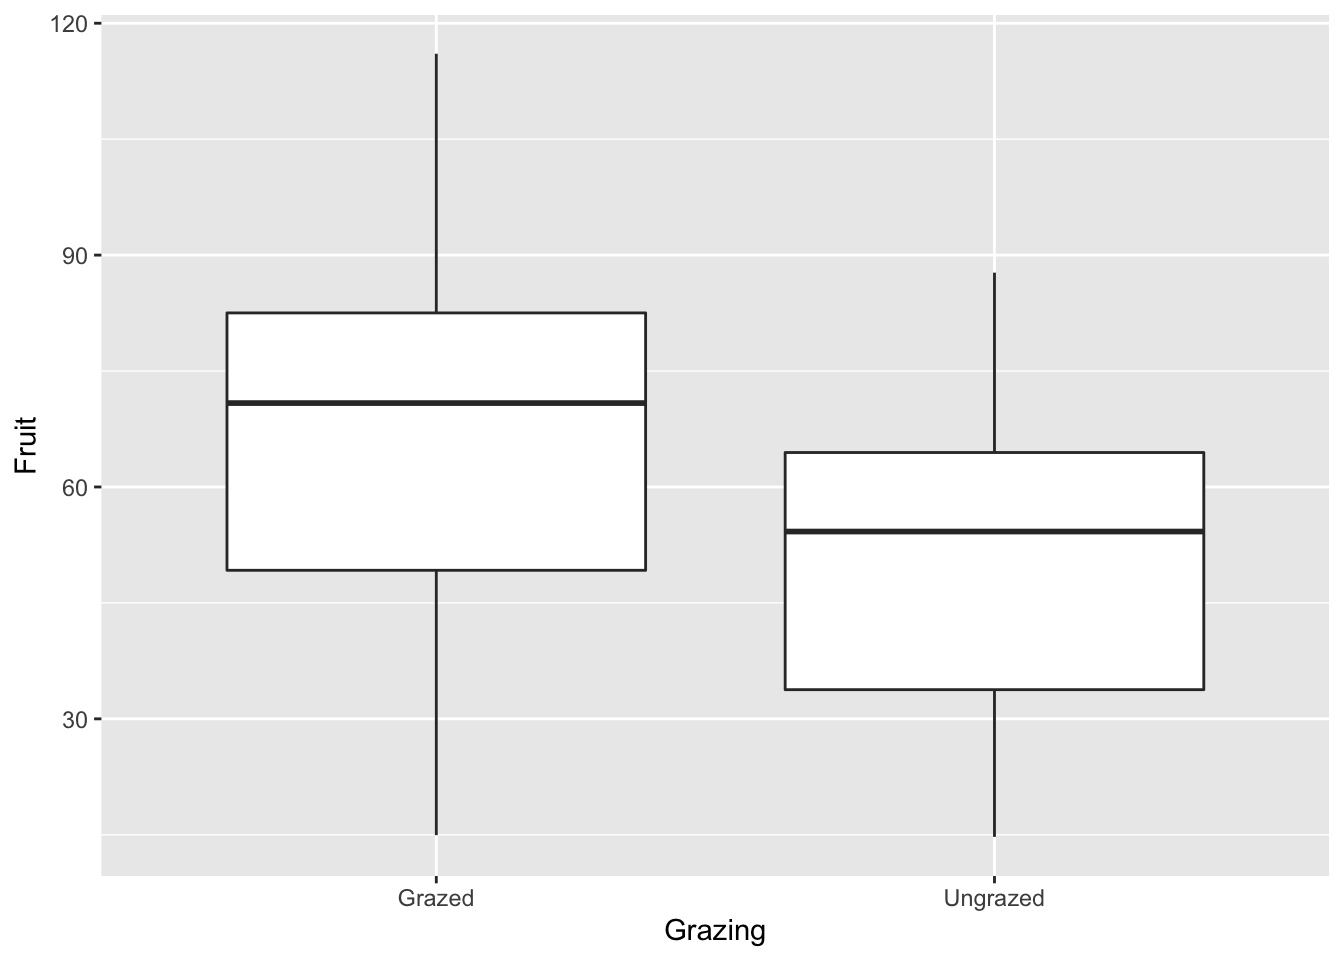
Render blank background:
eg_scatter + theme_bw()![]()
Arrange plots with gridExtra:
grid.arrange(
  eg_scatter, eg_box,
nrow =1) #specifies the arrangement 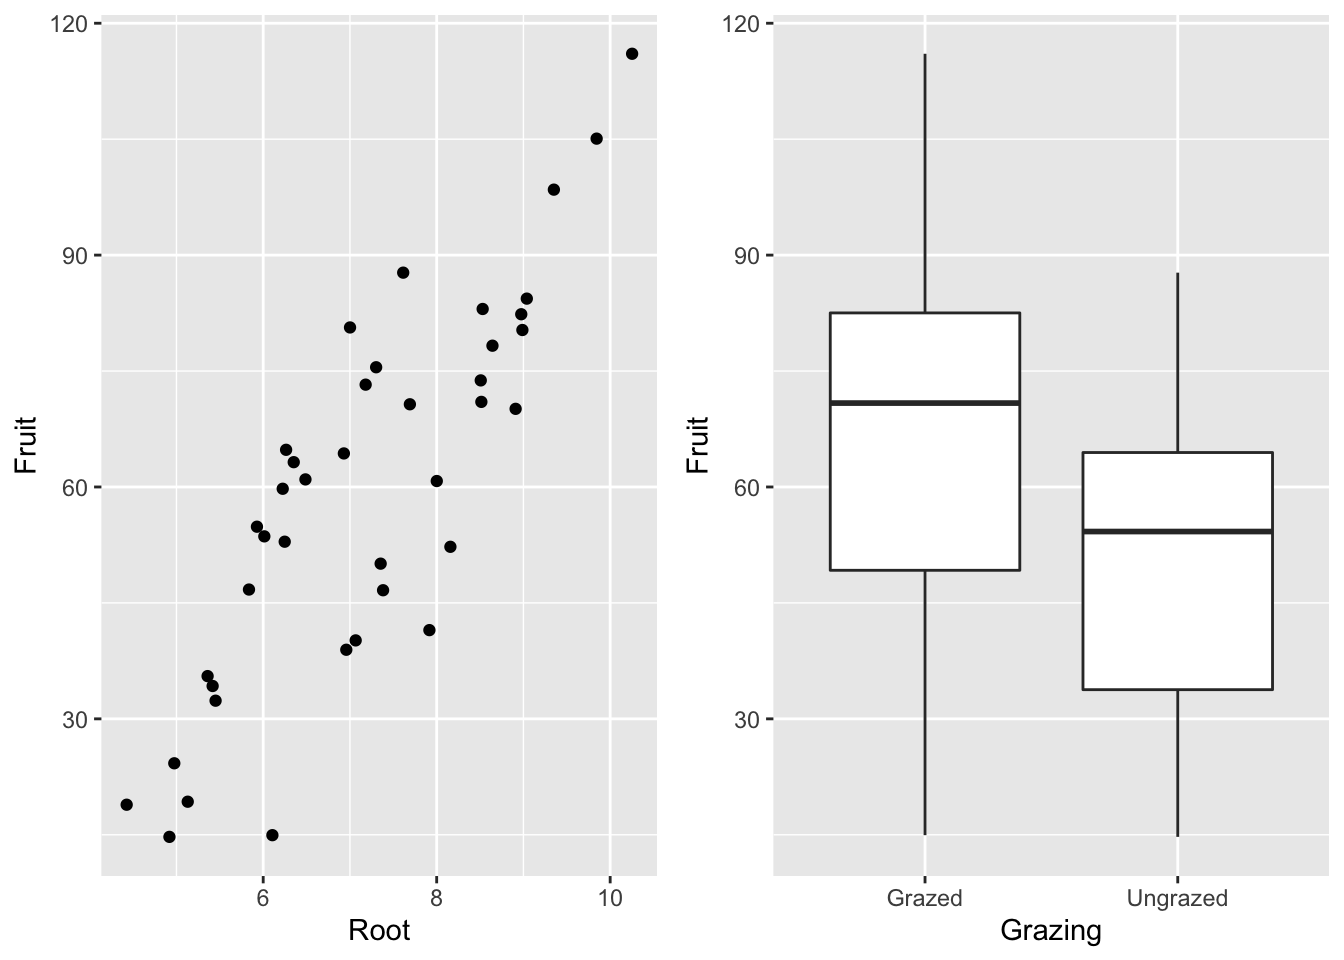
Change axes’ bounds:
eg_scatter + xlim(0,20) +ylim(0,140) 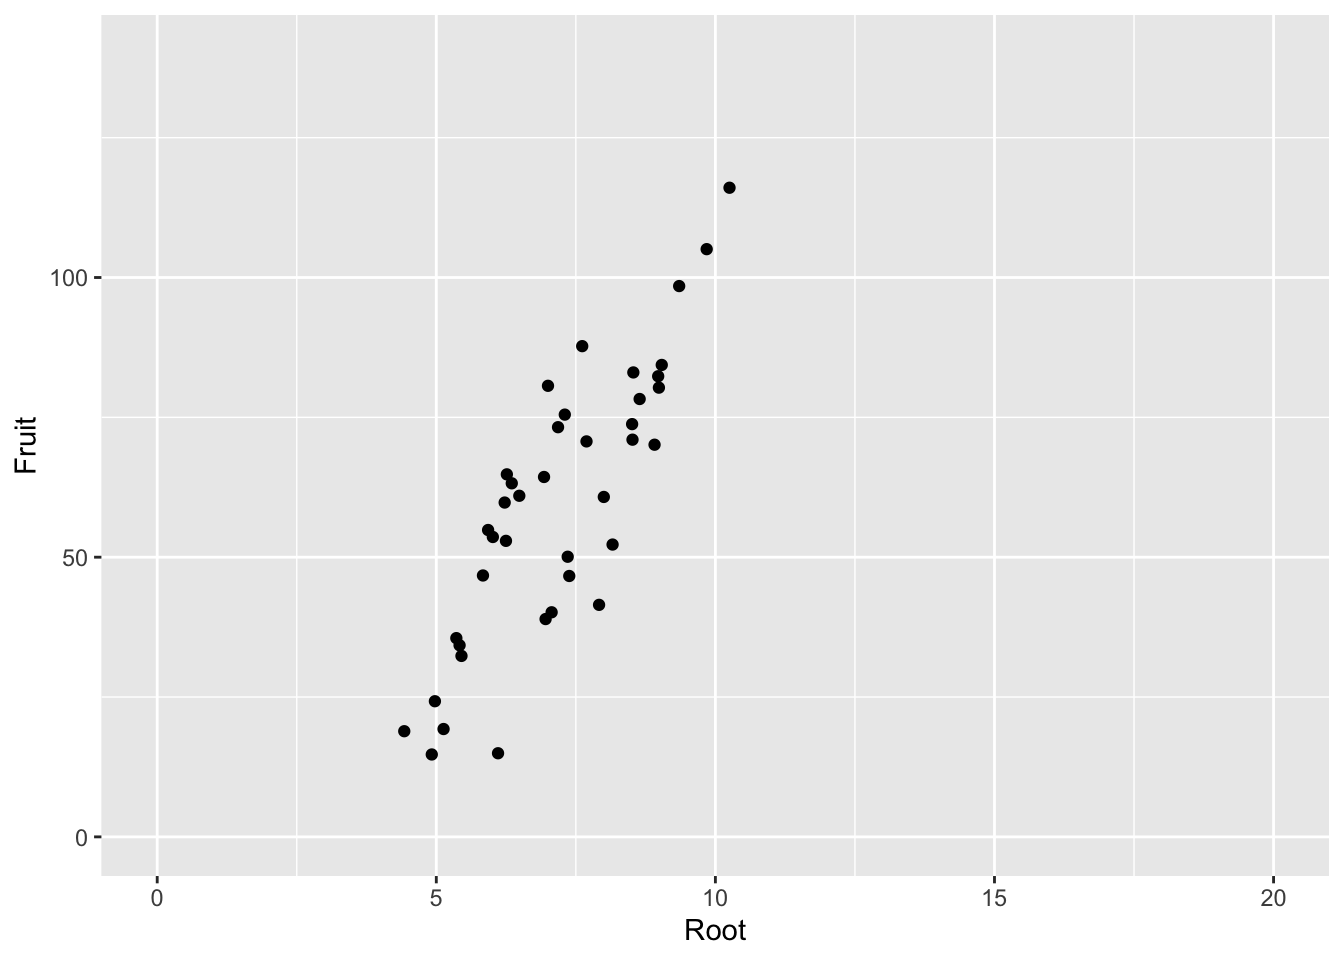
Add text to plot:
eg_scatter + annotate("text",
                      x=c(6,8), #6 and 105 are the x,y coordinates for placing the label
                      y=c(105,25),
                      label = c("here","there"))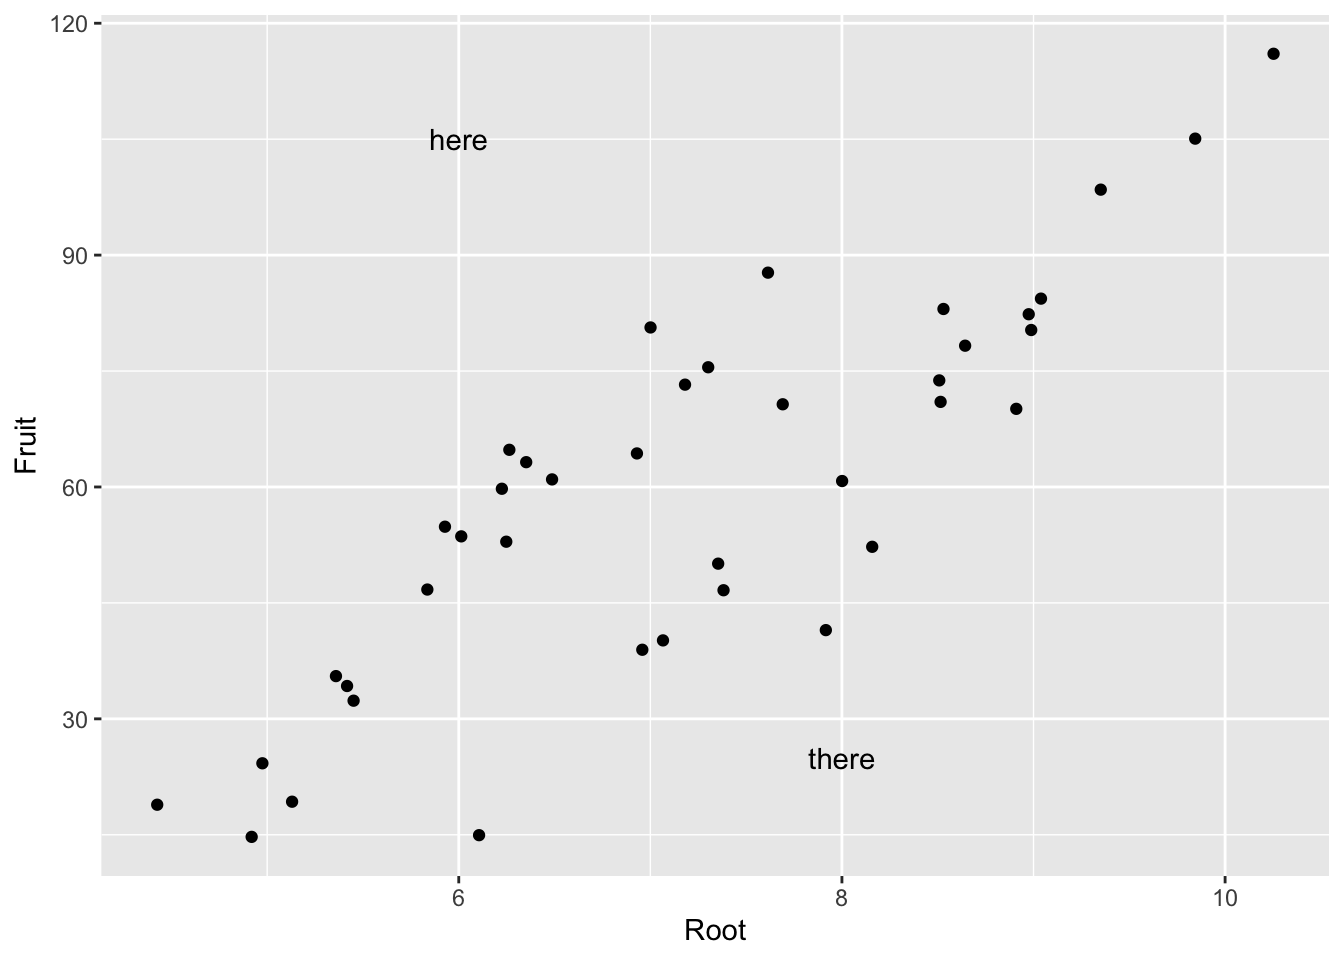
Modify axis scales:
eg_scatter +
  scale_x_continuous(limits = c(4,11), #bounds
breaks = 4:11) #tick marks at 1 step between the bounds 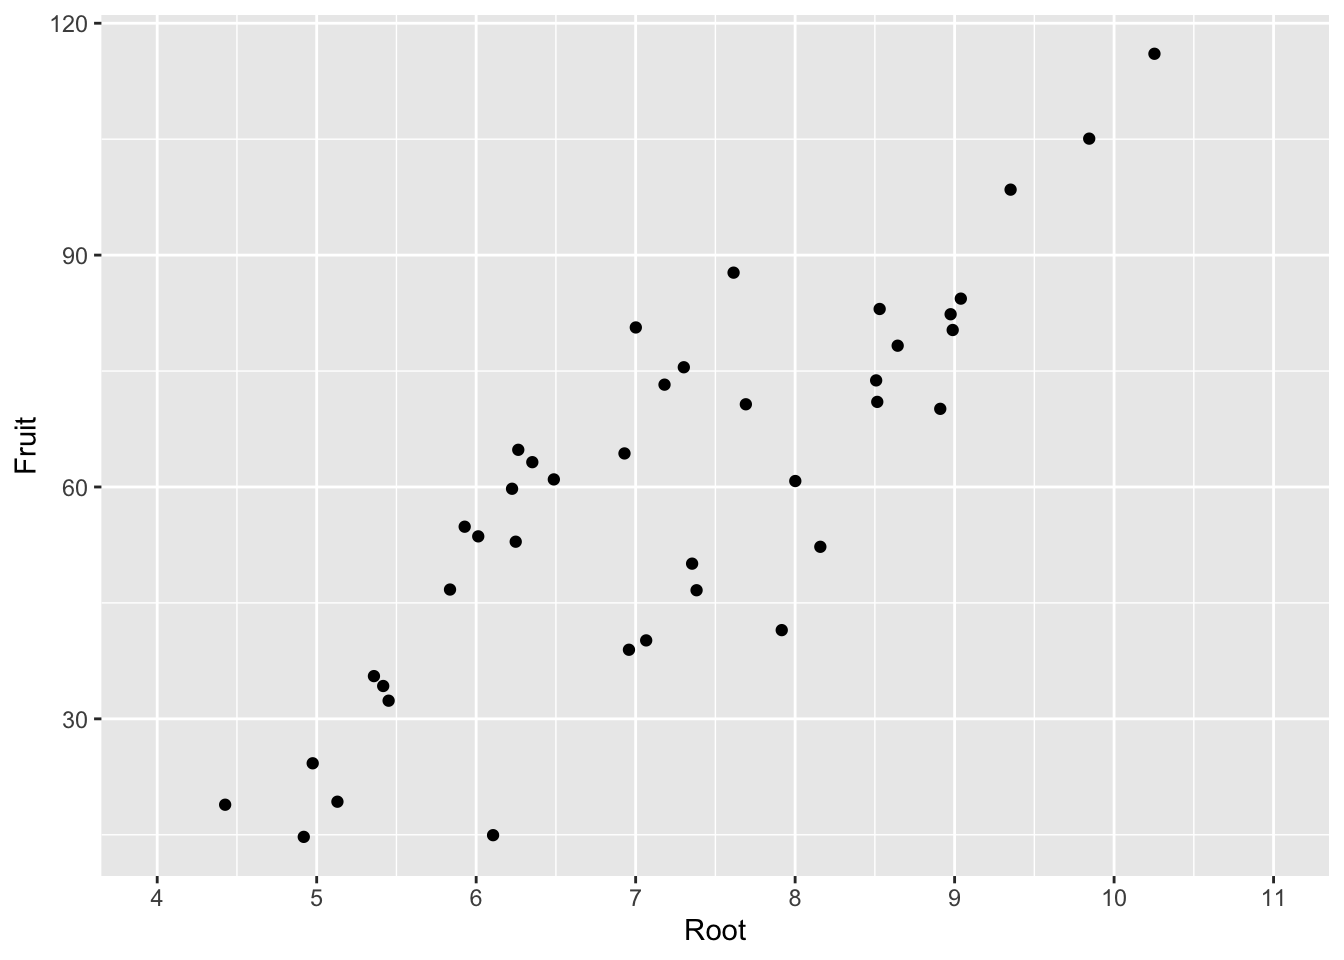
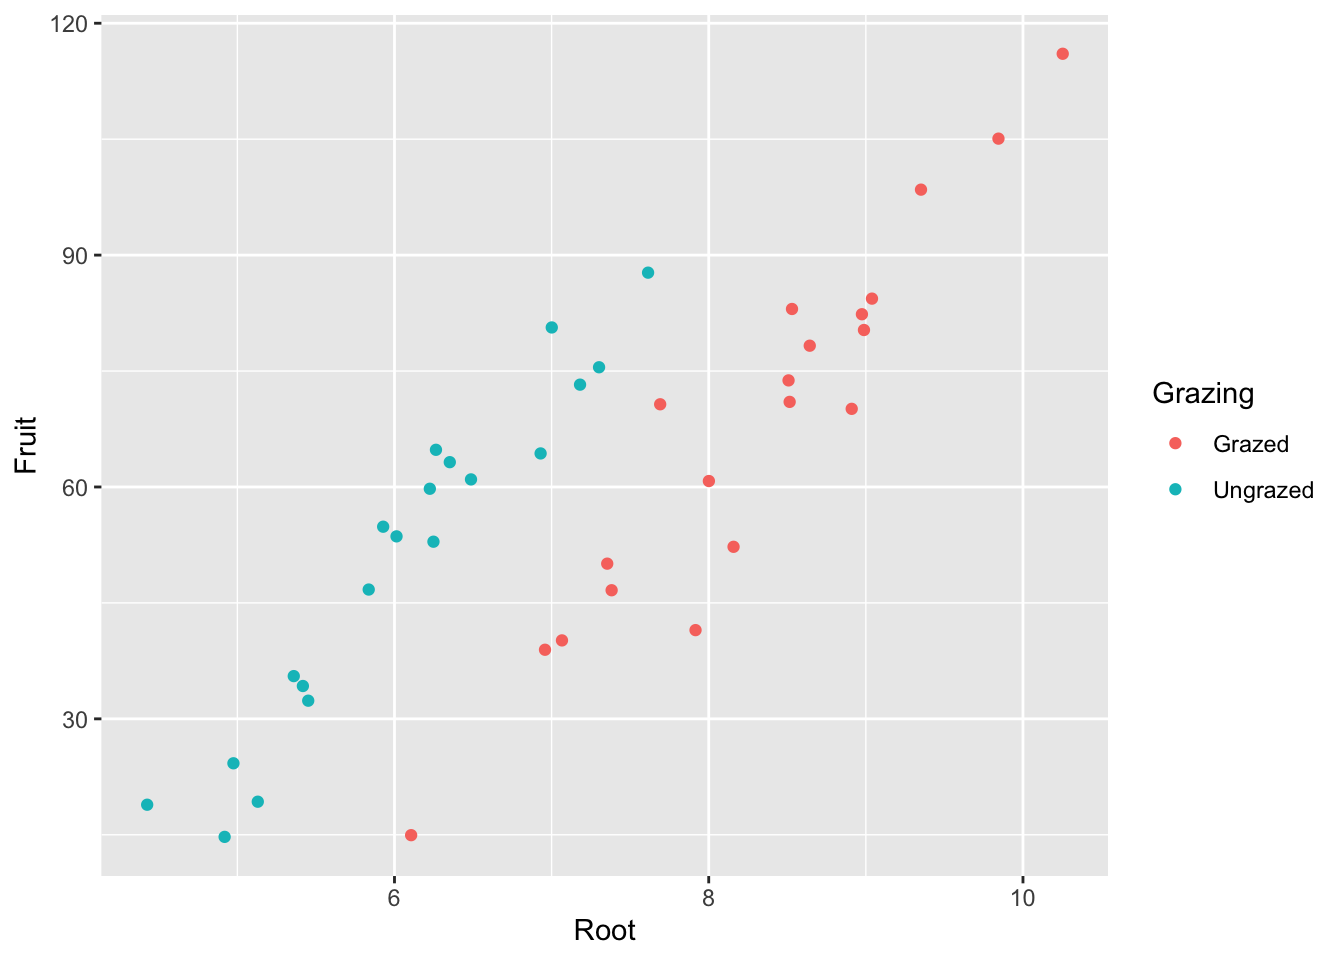
ggplot(compensation, aes(x = Root, y = Fruit,
                         color = Grazing)) + #need to add the color to aes for scale_color_manual() to function
  geom_point() +
  scale_color_manual(values = c(Grazed = "brown", Ungrazed = "green"))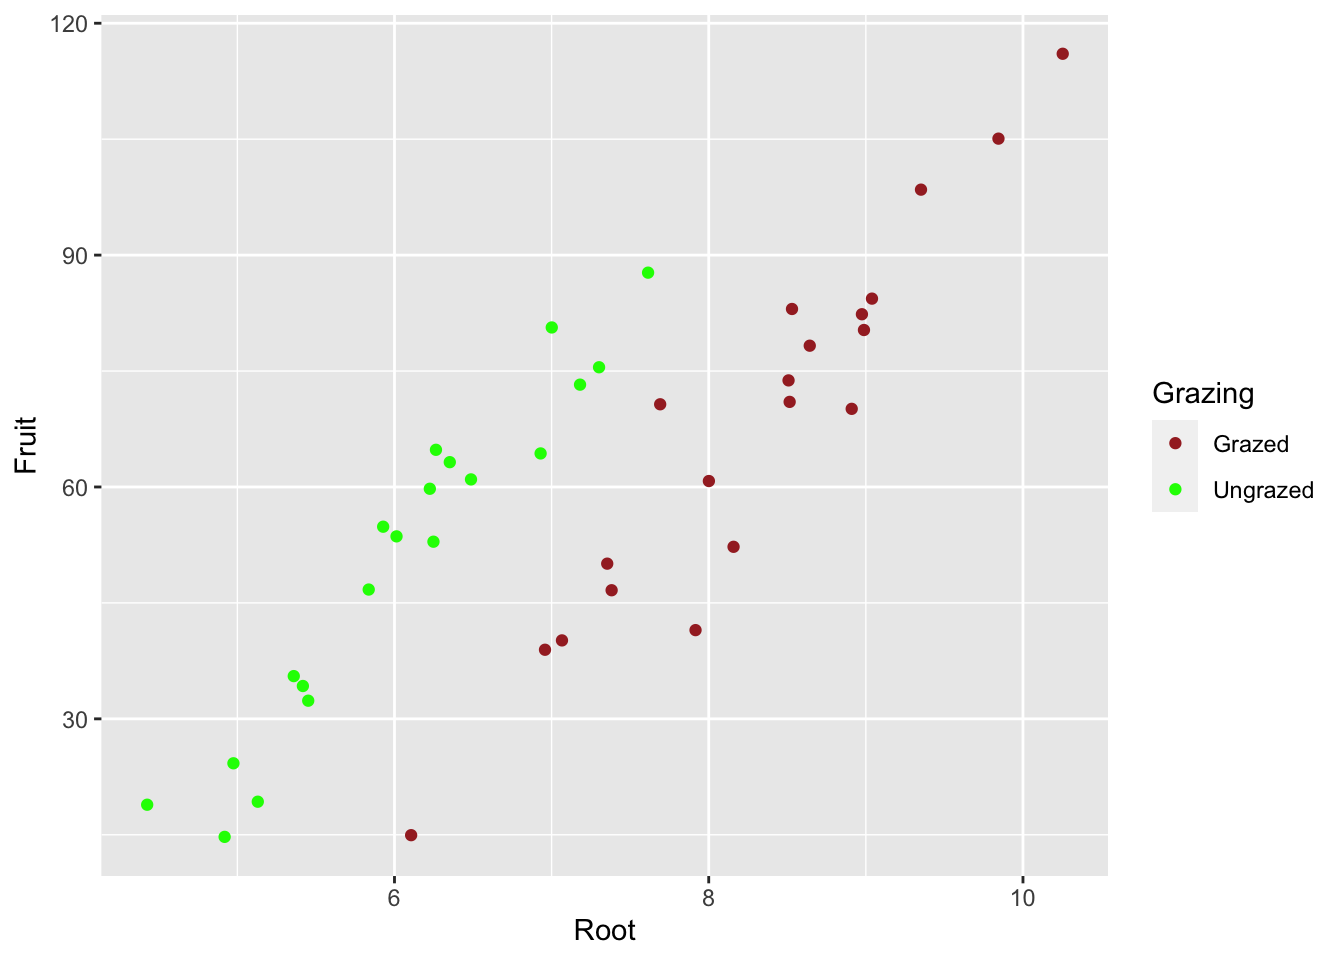
Transform the scale:
eg_box + scale_y_continuous(breaks = seq(from = 10, to = 150,
                                         by = 20), #vector breakpoints that call for ticks
trans = "log10") #log transformation of y axis![]()
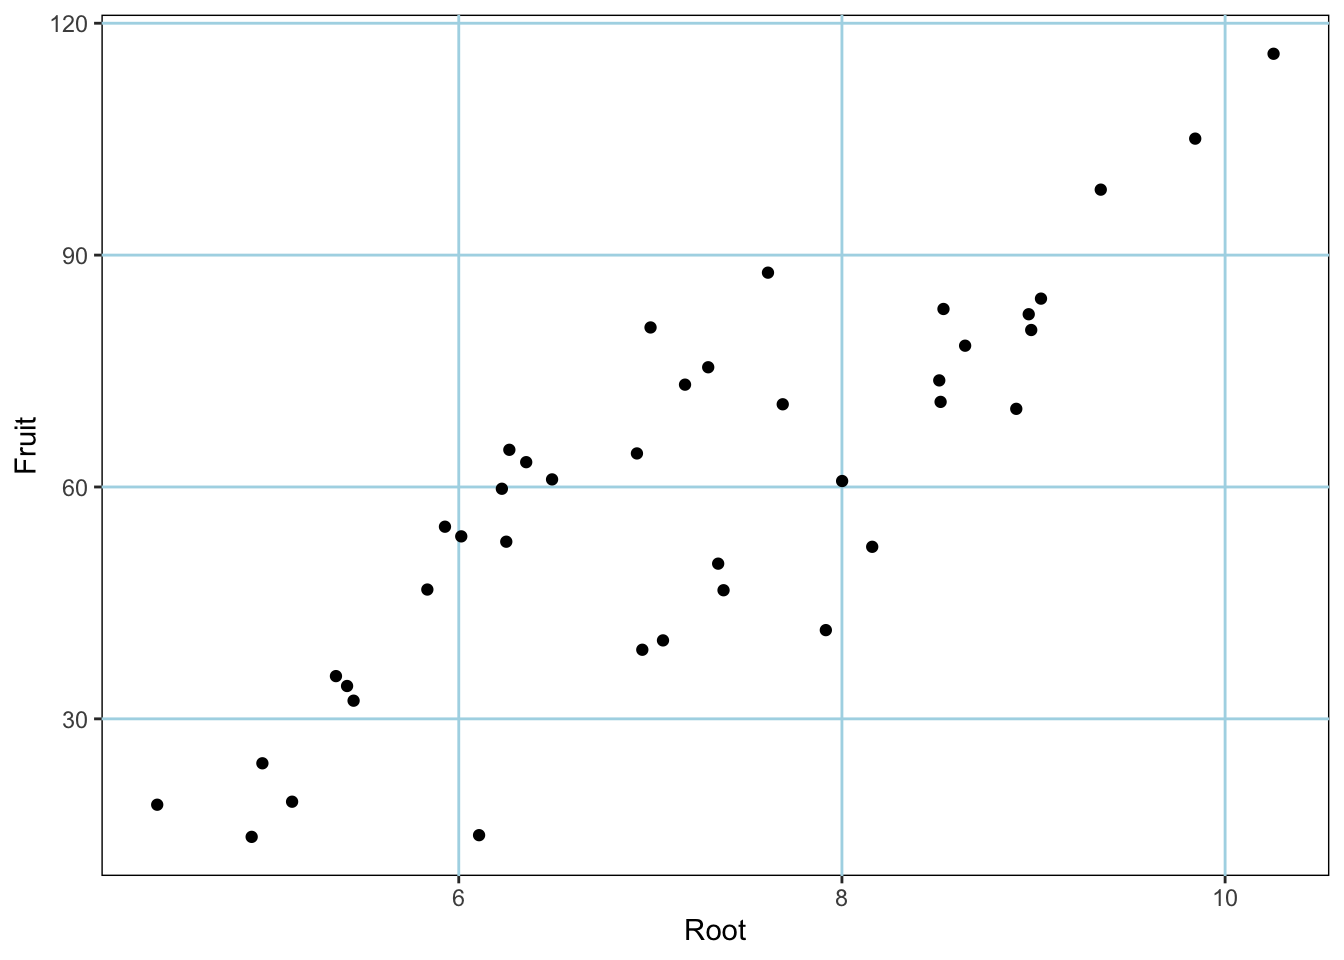
Modifying the theme:
eg_scatter +
  theme(
    panel.background = element_rect(fill = NA, colour = "black"), #backgrounds is white
    panel.grid.minor = element_blank(), #no minor gridlines
    panel.grid.major = element_line(colour = "lightblue") #gridlines are blue
  )
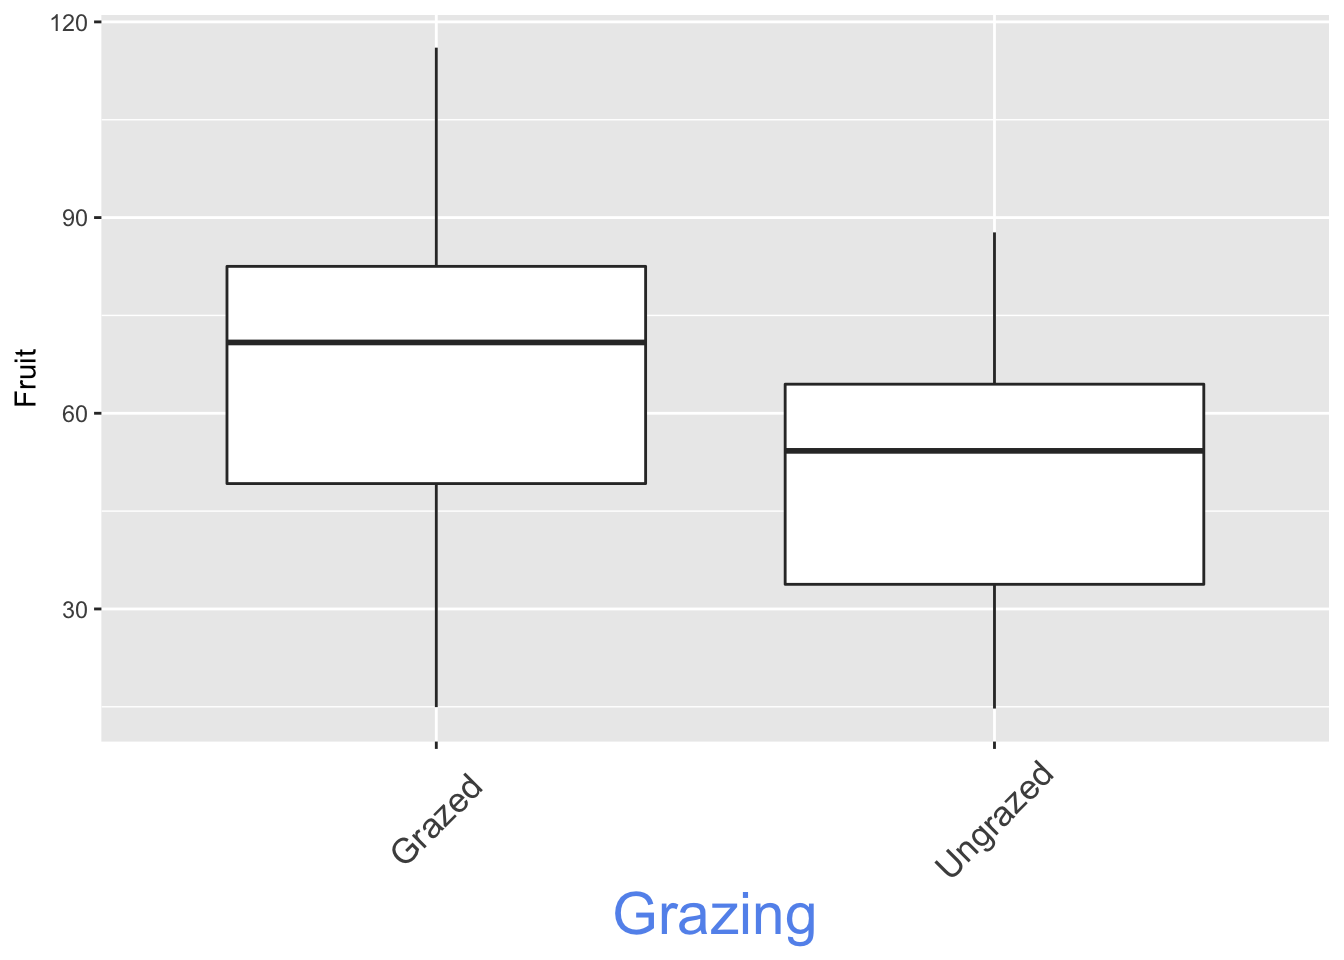
Modify elements of the x axis:
eg_box +
  theme(
    axis.title.x = element_text(color = "cornflowerblue",
    size = rel(2)), #relative increase above the default setting
    axis.text.x = element_text(angle = 45, #angle of x axis labels
                               size = 13,
                               vjust =0.5 ) #scoots labels down a bit; can accept values from 0-1
  )
Modify axis labels (categorical variables):
eg_box +
    scale_x_discrete(limits = c("Ungrazed", "Grazed"), #limits refer to variables in the dataframe
                     labels = c("Control", "Grazed")) #labels() corresponds to the limits and lets you change them without altering the df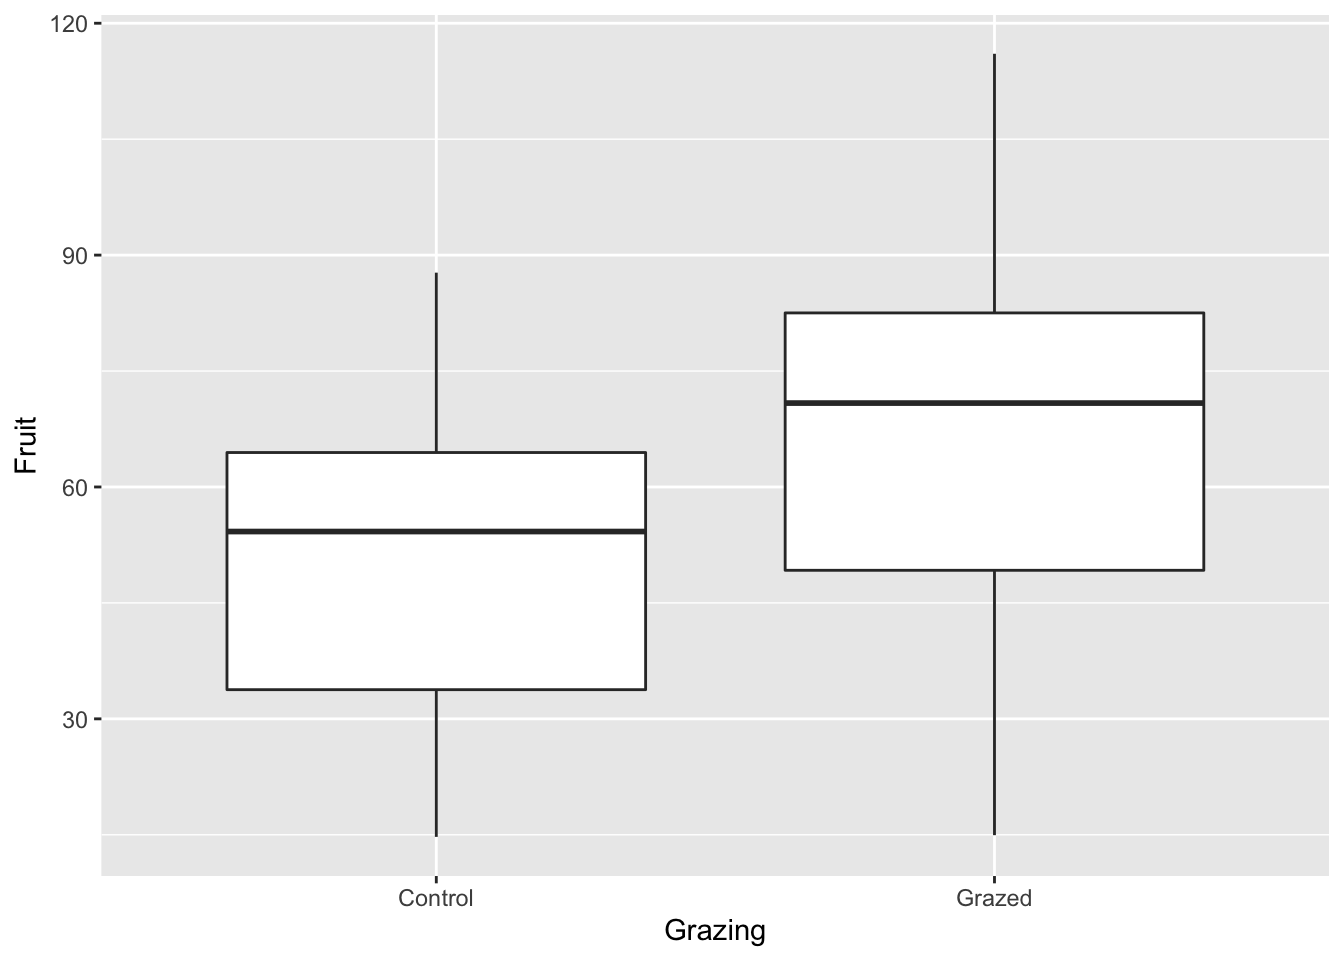
Modify legend:
ggplot(compensation, aes(x = Root, y = Fruit, color = Grazing)) +
  geom_point() +
  theme(legend.key = element_rect(fill = NA)) #removes box around the legend