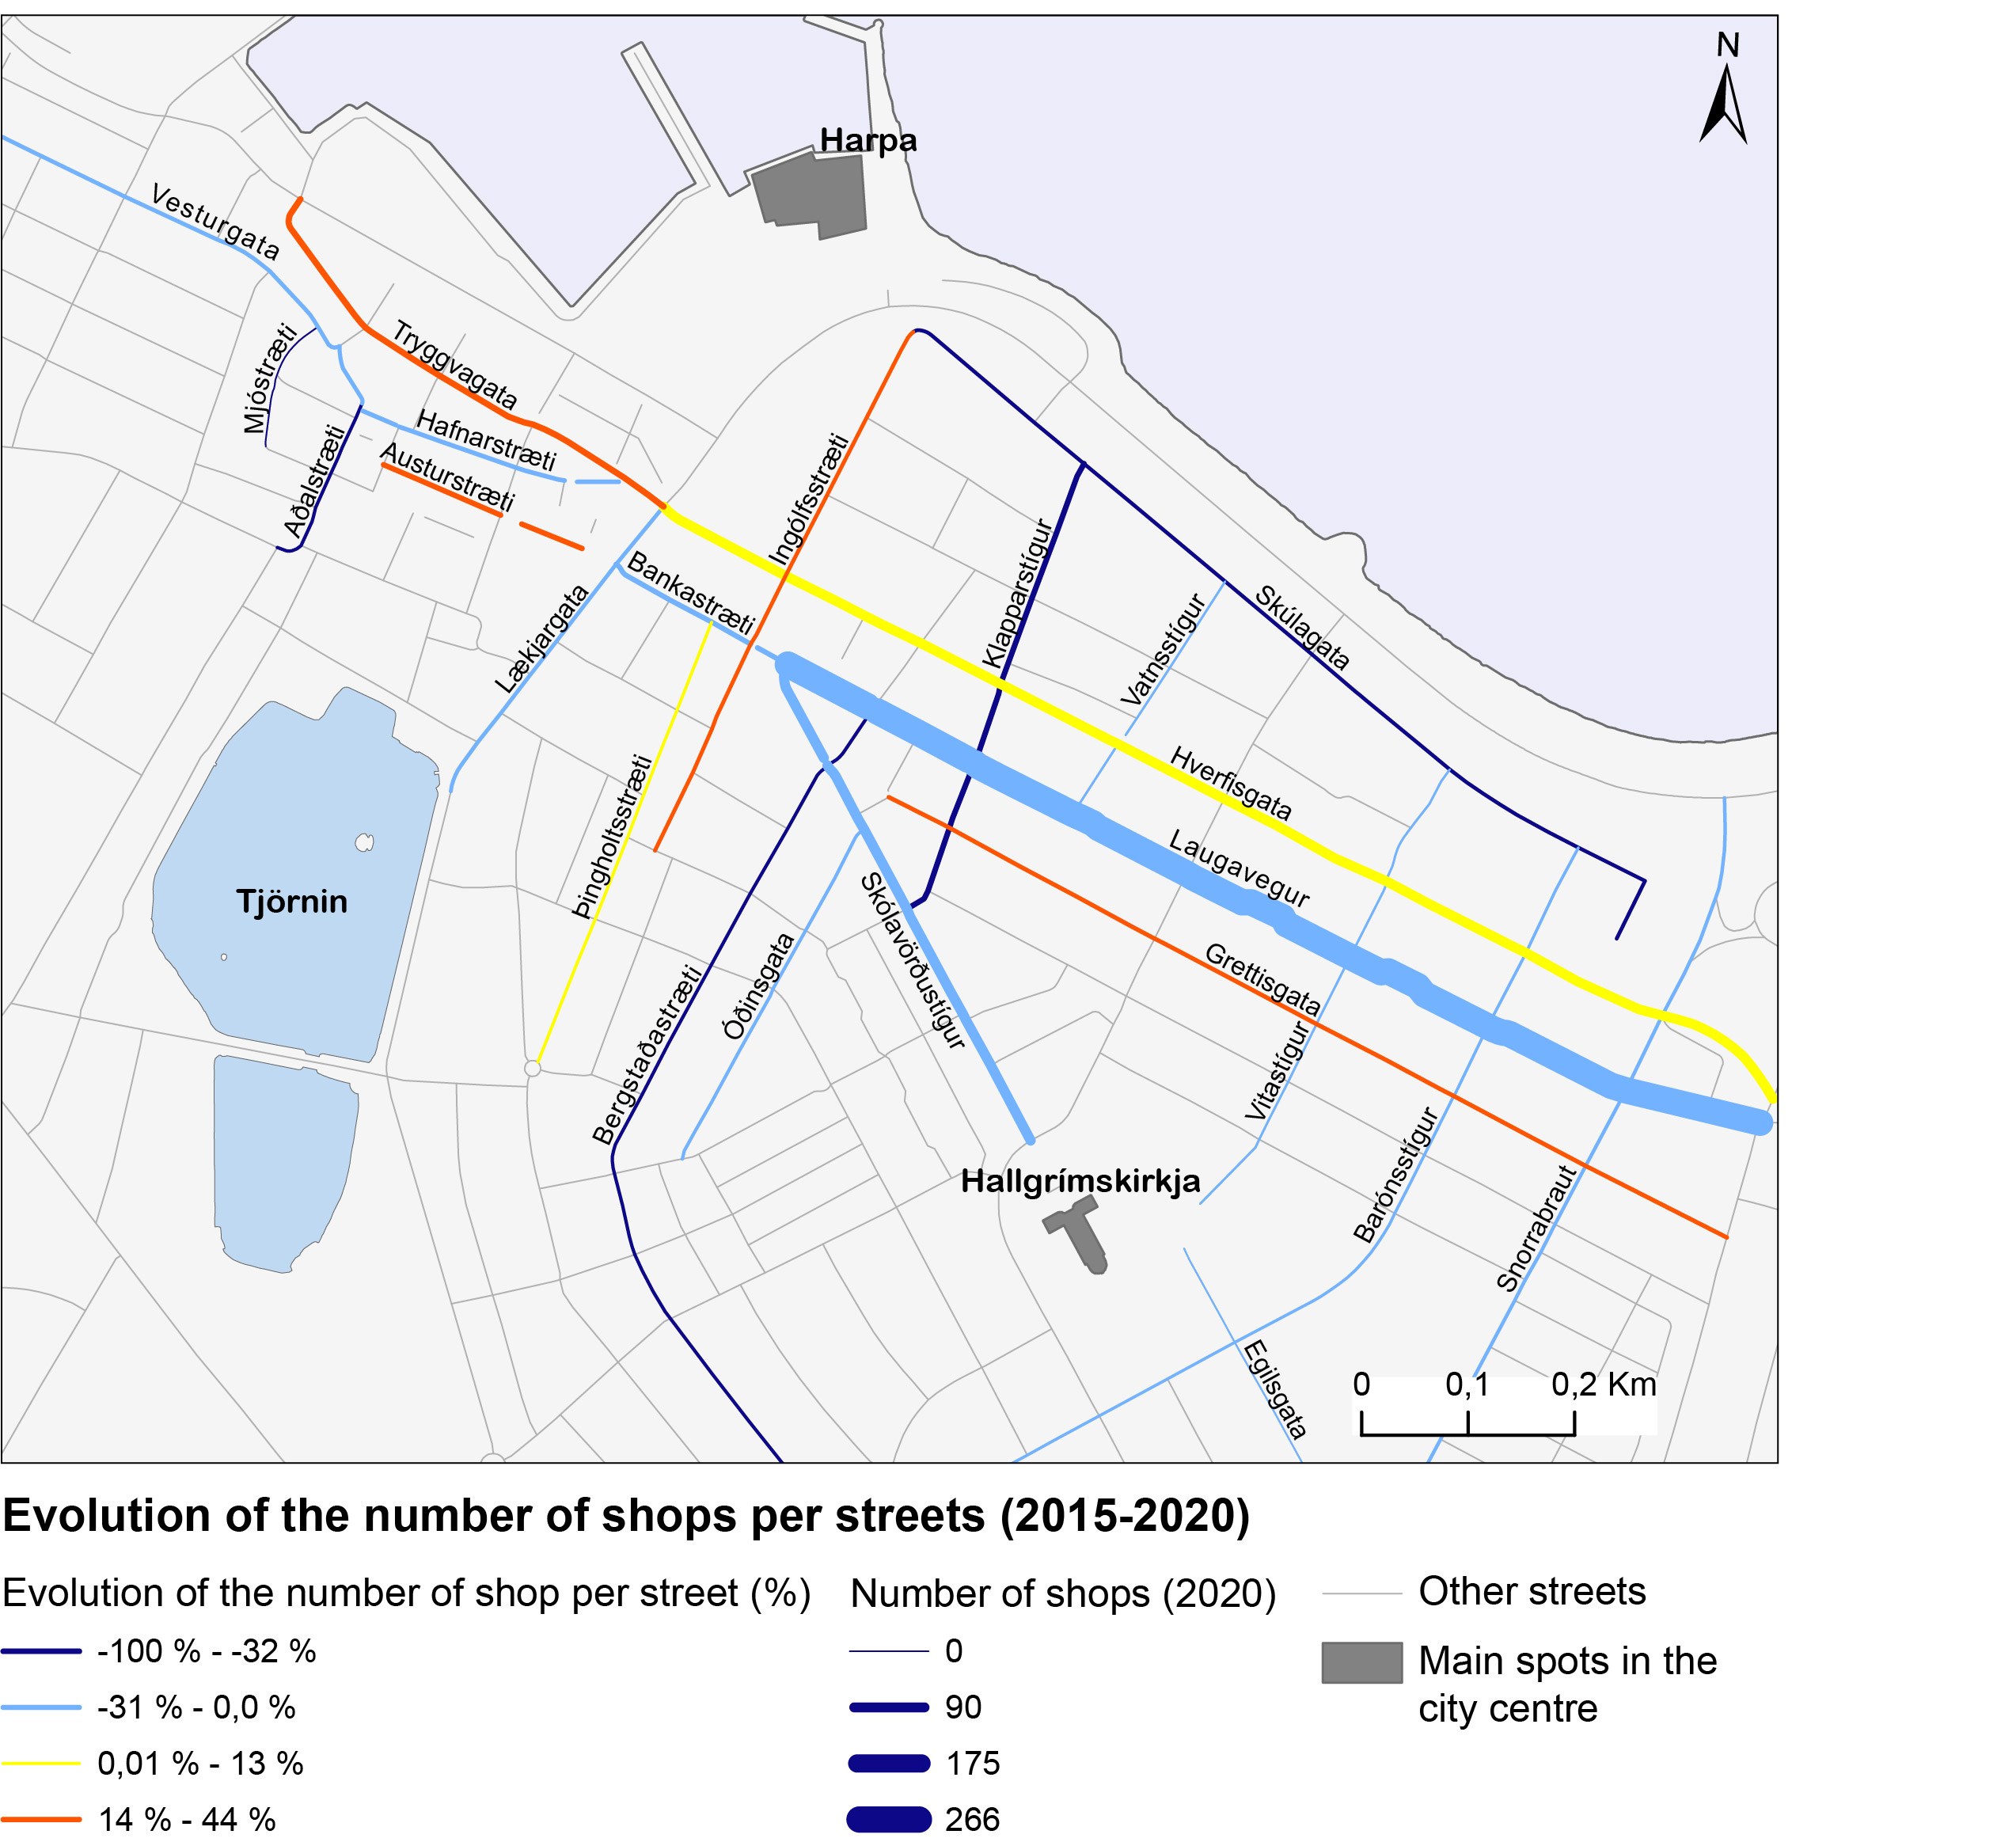
5 Shop changes by streets
The streets that have lost shops from 2015 to June 2020 are the main shopping streets: Laugavegur has lost 31 shops, mainly between 2019 and June 2010 (this might be due to the impact of Covid). The same goes for Skólavörðustígur. Streets that have gained new shops are mainly located around Laugavegur such as Hverfisgata, or Grettisgata. They have mainly gained shops before 2020 and have tended to lose shops between 2019 and 2020. Overall, the Covid has significantly impacted the commerciality of the main shopping streets (most of them have lost several shops over between 2019 and 2020).
5.1 Statistics
| Street | 2015 | 2019 | 2020 | Difference 2015-19 | Difference 2019-20 | Difference 2015-20 | Growth rate 2015-20 (%) |
|---|---|---|---|---|---|---|---|
| Hafnartorg | 0 | 4 | 28 | 4 | 24 | 28 | Inf |
| Garðastræti | 0 | 16 | 14 | 16 | -2 | 14 | Inf |
| Njálsgata | 0 | 12 | 12 | 12 | 0 | 12 | Inf |
| Lindargata | 0 | 6 | 6 | 6 | 0 | 6 | Inf |
| Tryggvagata | 43 | 49 | 49 | 6 | 0 | 6 | 14 |
| Austurstræti | 35 | 43 | 40 | 8 | -3 | 5 | 14.3 |
| Hverfisgata | 83 | 94 | 88 | 11 | -6 | 5 | 6 |
| Sölvhólsgata | 0 | 4 | 5 | 4 | 1 | 5 | Inf |
| Frakkastígur | 9 | 13 | 13 | 4 | 0 | 4 | 44.4 |
| Grettisgata | 25 | 36 | 29 | 11 | -7 | 4 | 16 |
| Hallveigarstígur | 0 | 4 | 3 | 4 | -1 | 3 | Inf |
| Ingólfsstræti | 21 | 25 | 24 | 4 | -1 | 3 | 14.3 |
| Kárastígur | 0 | 3 | 2 | 3 | -1 | 2 | Inf |
| Þingholtsstræti | 15 | 15 | 16 | 0 | 1 | 1 | 6.7 |
| Veghúsastígur | 0 | 1 | 1 | 1 | 0 | 1 | Inf |
| Egilsgata | 1 | 1 | 1 | 0 | 0 | 0 | 0 |
| Vatnsstígur | 9 | 8 | 8 | -1 | 0 | -1 | -11.1 |
| Vitastígur | 8 | 7 | 7 | -1 | 0 | -1 | -12.5 |
| Bankastræti | 39 | 32 | 37 | -7 | 5 | -2 | -5.1 |
| Barónsstígur | 17 | 15 | 15 | -2 | 0 | -2 | -11.8 |
| Mjóstræti | 2 | 0 | 0 | -2 | 0 | -2 | -100 |
| Hafnarstræti | 34 | 33 | 31 | -1 | -2 | -3 | -8.8 |
| Óðinsgata | 21 | 21 | 18 | 0 | -3 | -3 | -14.3 |
| Skólavörðustígur | 93 | 96 | 89 | 3 | -7 | -4 | -4.3 |
| Snorrabraut | 25 | 22 | 21 | -3 | -1 | -4 | -16 |
| Lækjargata | 30 | 27 | 25 | -3 | -2 | -5 | -16.7 |
| Vesturgata | 32 | 23 | 27 | -9 | 4 | -5 | -15.6 |
| Bergstaðastræti | 28 | 19 | 18 | -9 | -1 | -10 | -35.7 |
| Aðalstræti | 31 | 21 | 18 | -10 | -3 | -13 | -41.9 |
| Klapparstígur | 62 | 52 | 42 | -10 | -10 | -20 | -32.3 |
| Skúlagata | 44 | 25 | 23 | -19 | -2 | -21 | -47.7 |
| Laugavegur (upp að Hlemmi) | 297 | 298 | 266 | 1 | -32 | -31 | -10.4 |