3 Methodological note
The project involved three major steps:
- Refining the shop classification used in the RSV database and cleaning the database accordingly
- Geocoding the RSV database in order to produce a georeferenced database
- Mapping the georeferenced database onto an online mapping application
3.1 Data cleaning and altered shop classification
3.1.1 Presentation of the data from RSV
3.1.1.1 The perimeter covered by the RSV database
Data have been provided by Rannsóknasetur verslunarinnar in an Excel Spreadsheet. Data includes the shop inventory from 2015, 2019 and June 2020 with the following variables:
- Ár
- Fyrirtæki
- Heimilisfang
- Numer
- Gata
- Meginflokkur
- Undirflokkur
It is worth noticing that the shop inventories do not cover the same perimeter over the three years (see the mapping of each year on Figure 3.1). Especially, the streets of Grandi are not included in the 2015 survey. No shop was identified on Njálsgata in 2015. The total number of shops in the database for the entire area is therefore not comparable. For sake of comparison, the statistics presented in this report do not include Grandi.
| 2015 | 2019 | 2020 | |
|---|---|---|---|
| Grandagarður | 0 | 73 | 108 |
| Fiskislóð | 0 | 72 | 68 |
| Hafnartorg | 0 | 4 | 28 |
| Hólmaslóð | 0 | 21 | 20 |
| Garðastræti | 0 | 16 | 14 |
| Njálsgata | 0 | 12 | 12 |
| Eyjarslóð | 0 | 11 | 11 |
| Lindargata | 0 | 6 | 6 |
| Sölvhólsgata | 0 | 4 | 5 |
| Hallveigarstígur | 0 | 4 | 3 |
| Kárastígur | 0 | 3 | 2 |
| Veghúsastígur | 0 | 1 | 1 |
| Aðalstræti | 0 | 1 | 0 |
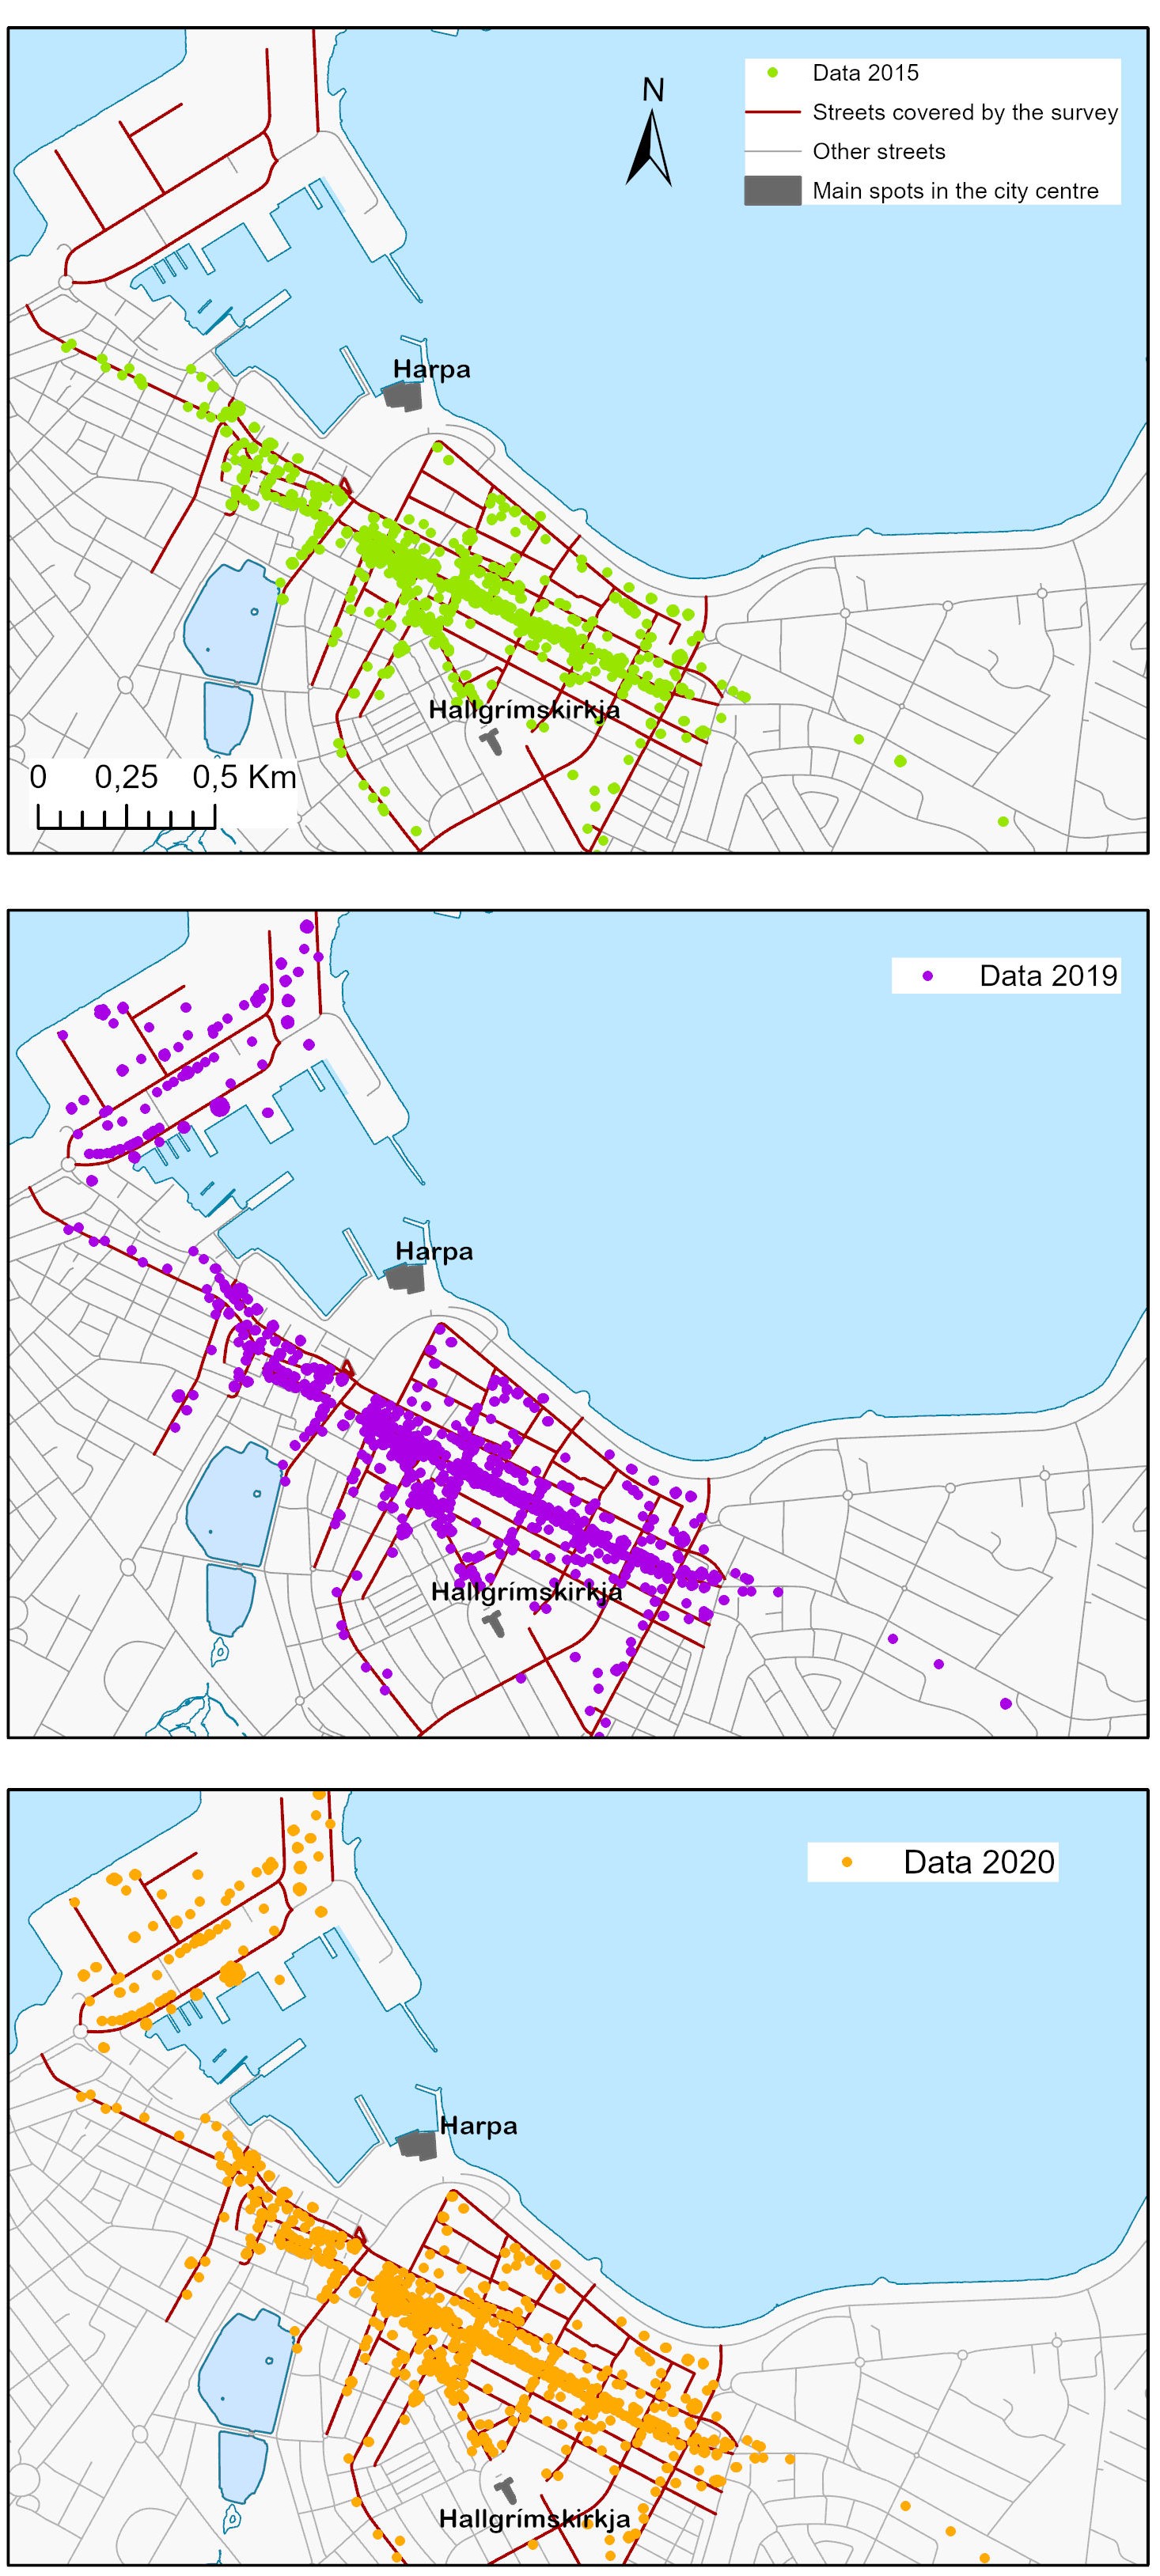
Figure 3.1: Perimeter covered by the survey
3.1.1.2 The classification used by the RSV datase
The RSV database is based on a two-level classification:
- Category 1: Meginflokkur (3 categories in 2015; 4 categories in 2019 and 2020 - vacancy were not reported in 2015).
- Category 2: Undirflokkur (50 categories).
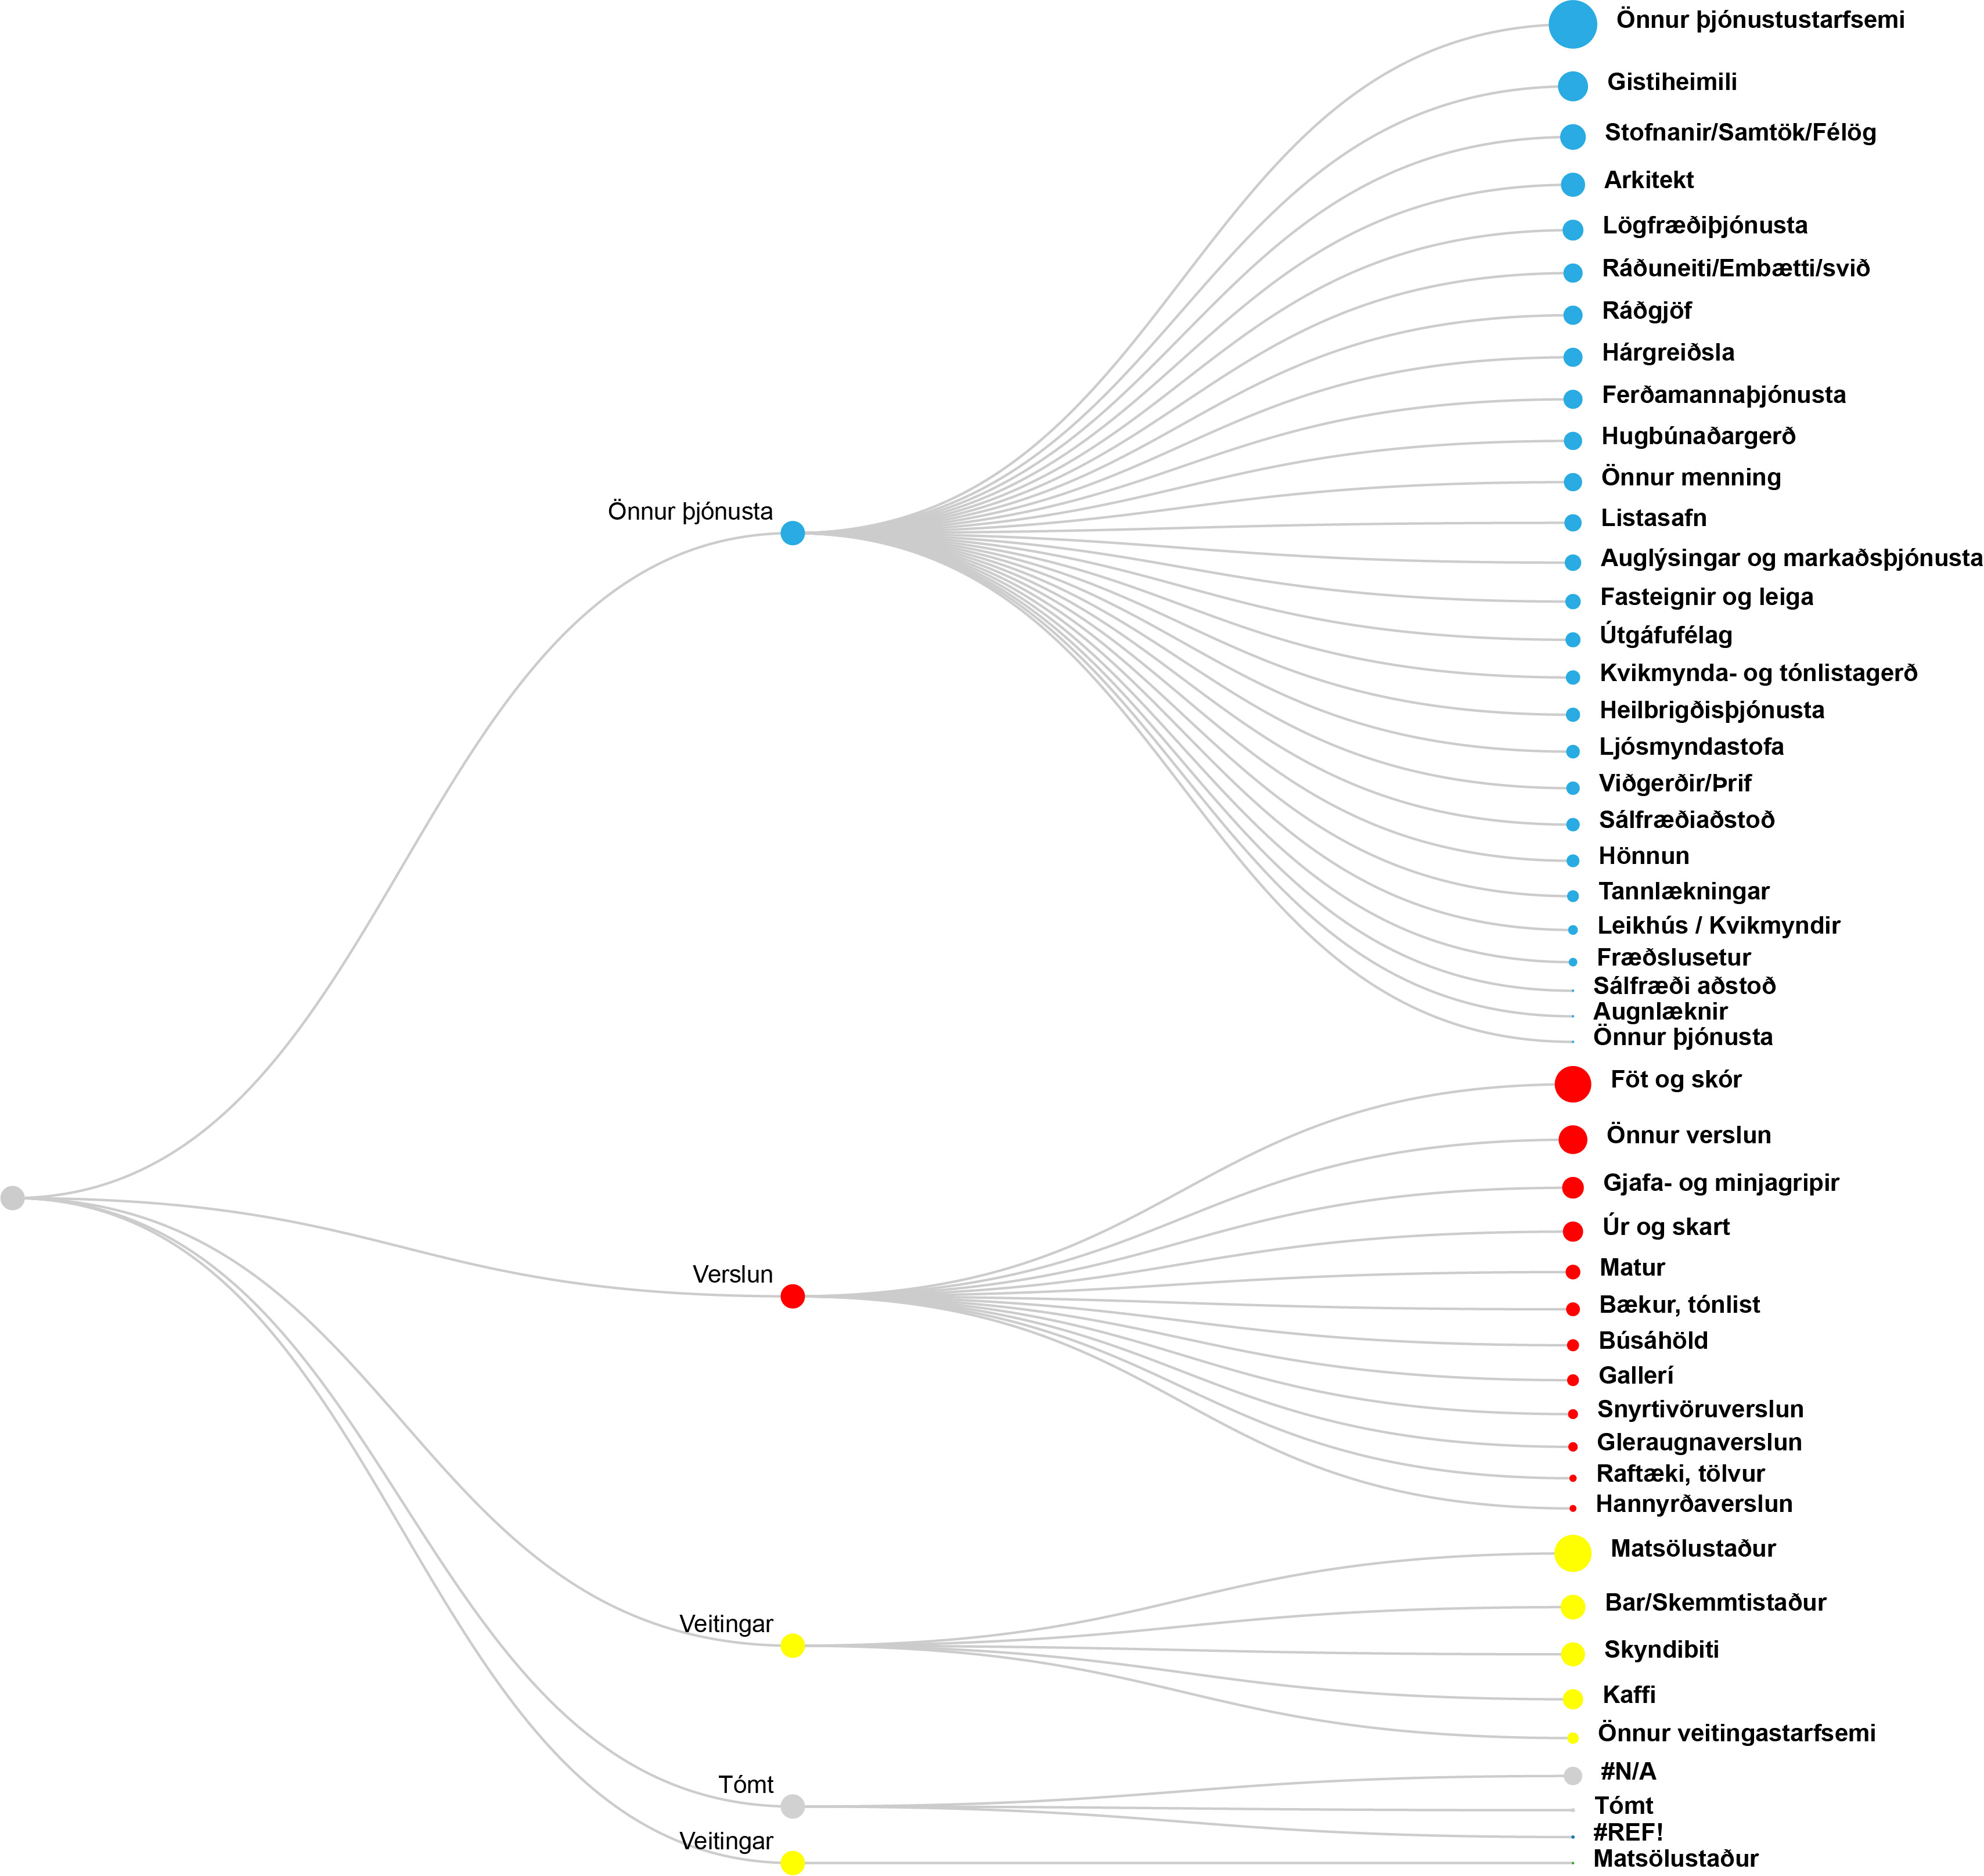
Figure 3.2: Shop classification used by RSV
As shown in the following table, in the original version of the database, ‘Önnur þjónustustarfsemi’ was the most represented category of shop (all year included) which can bias the interpretation of statistics. To avoid this pitfall, all the shops that were falling into this category have been reclassified in a better-suited category. Besides, several shops were not assigned any categories (#N/A or #REF).
| Undirflokkur | Count | Percentage |
|---|---|---|
| Önnur þjónustustarfsemi | 465 | 13.7 |
| Matsölustaður | 273 | 8.0 |
| Föt og skór | 263 | 7.8 |
| Gistiheimili | 176 | 5.2 |
| Önnur verslun | 162 | 4.8 |
| Stofnanir/Samtök/Félög | 129 | 3.8 |
| Bar/Skemmtistaður | 120 | 3.5 |
| Arkitekt | 114 | 3.4 |
| Skyndibiti | 112 | 3.3 |
| Gjafa- og minjagripir | 92 | 2.7 |
| Lögfræðiþjónusta | 85 | 2.5 |
| Kaffi | 80 | 2.4 |
| Úr og skart | 80 | 2.4 |
| Ráðgjöf | 72 | 2.1 |
| Ráðuneiti/Embætti/svið | 72 | 2.1 |
| Ferðamannaþjónusta | 71 | 2.1 |
| Hárgreiðsla | 71 | 2.1 |
| #N/A | 66 | 1.9 |
| Hugbúnaðargerð | 65 | 1.9 |
| Önnur menning | 65 | 1.9 |
| 60 | 1.8 | |
| Listasafn | 58 | 1.7 |
| Auglýsingar og markaðsþjónusta | 53 | 1.6 |
| Fasteignir og leiga | 46 | 1.4 |
| Útgáfufélag | 44 | 1.3 |
| Matur | 42 | 1.2 |
| Kvikmynda- og tónlistagerð | 40 | 1.2 |
| Heilbrigðisþjónusta | 39 | 1.1 |
| Bækur, tónlist | 37 | 1.1 |
| Ljósmyndastofa | 36 | 1.1 |
| Sálfræðiaðstoð | 35 | 1.0 |
| Viðgerðir/Þrif | 35 | 1.0 |
| Hönnun | 32 | 0.9 |
| Búsáhöld | 28 | 0.8 |
| Gallerí | 27 | 0.8 |
| Tannlækningar | 27 | 0.8 |
| Önnur veitingastarfsemi | 25 | 0.7 |
| Snyrtivöruverslun | 19 | 0.6 |
| Leikhús / Kvikmyndir | 18 | 0.5 |
| Gleraugnaverslun | 17 | 0.5 |
| Fræðslusetur | 14 | 0.4 |
| Raftæki, tölvur | 10 | 0.3 |
| Hannyrðaverslun | 9 | 0.3 |
| Tómt | 3 | 0.1 |
| #REF! | 2 | 0.1 |
| Augnlæknir | 1 | 0.0 |
| Önnur þjónusta | 1 | 0.0 |
| Sálfræði aðstoð | 1 | 0.0 |
3.1.2 Data cleaning : a new shop classification
The first step of this project has therefore consisted in a significant cleaning of the database to (1) complete missing data, (2) refine the shop classification and (3) reassign the proper category to most of the shops that were previously falling into the “Önnur þjónustustarfsemi” category. The websites https://ja.is and https://www.skatturinn.is/ have been used to allocate the appropriate category to these shops. Figure 3.3 and the following table show the new classification and the statistics after data cleaning.
The new shop classification is largely inspired by the one implemented by the Parisian planning agency (APUR). This institution has created an observatory of businesses and shops in early 2000s.1 This observatory mainly relies on a periodical survey of all the shop in Paris, which fuels a georeferenced and open-access database of the retail structures in Paris. For each address, the survey mentions the name of the shop and its type, following a detailed three-level classification (see appendix).
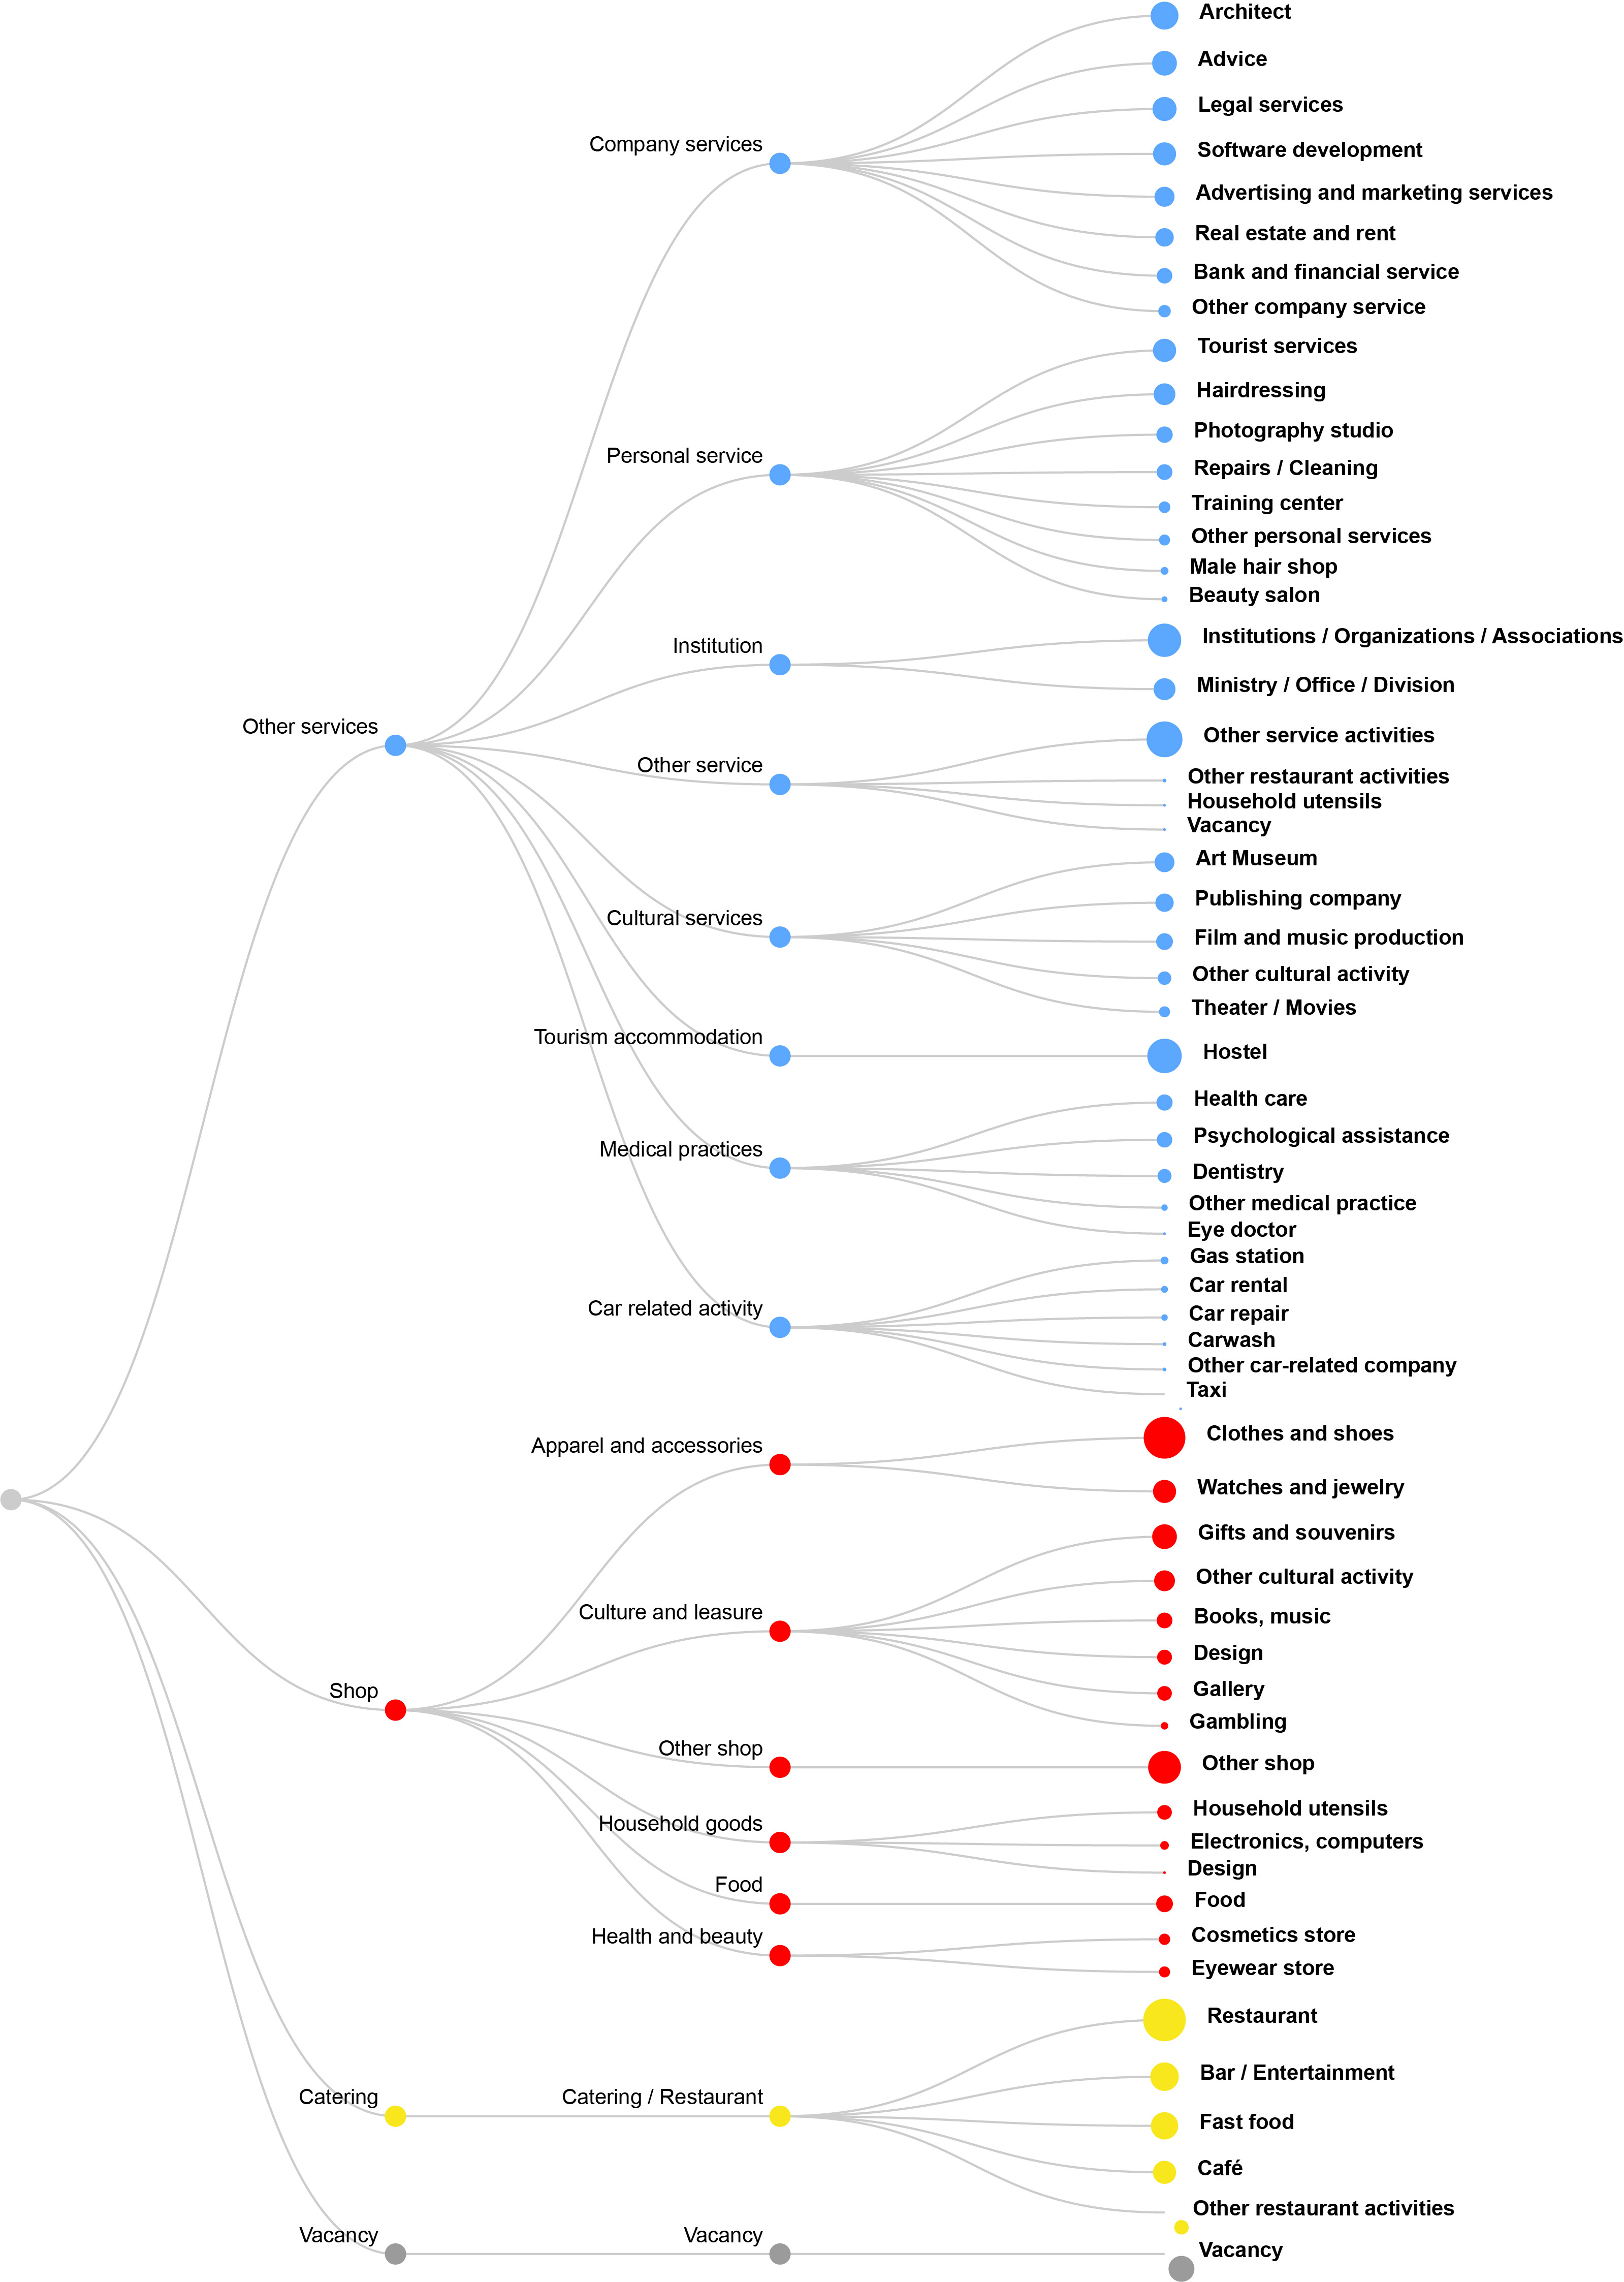
Figure 3.3: New shop classification
Here are the new statistics after data cleaning:
| Category 3 | Count | Percentage |
|---|---|---|
| Restaurant | 273 | 8.0 |
| Clothes and shoes | 263 | 7.8 |
| Other service activities | 194 | 5.7 |
| Tourism accommodation | 179 | 5.3 |
| Institutions / Organizations / Associations | 168 | 5.0 |
| Other shop | 162 | 4.8 |
| Bar / Entertainment | 122 | 3.6 |
| Architect | 117 | 3.4 |
| Fast food | 112 | 3.3 |
| Vacancy | 102 | 3.0 |
| Advice | 92 | 2.7 |
| Gifts and souvenirs | 92 | 2.7 |
| Other cultural activity | 92 | 2.7 |
| Legal services | 87 | 2.6 |
| Tourist services | 81 | 2.4 |
| Café | 80 | 2.4 |
| Software development | 80 | 2.4 |
| Watches and jewelry | 80 | 2.4 |
| Ministry / Office / Division | 72 | 2.1 |
| Hairdressing | 71 | 2.1 |
| Advertising and marketing services | 60 | 1.8 |
| Art Museum | 59 | 1.7 |
| Real estate and rent | 51 | 1.5 |
| Publishing company | 50 | 1.5 |
| Film and music production | 42 | 1.2 |
| Food | 42 | 1.2 |
| Photography studio | 40 | 1.2 |
| Health care | 39 | 1.1 |
| Books, music | 37 | 1.1 |
| Repairs / Cleaning | 37 | 1.1 |
| Bank and financial service | 36 | 1.1 |
| Psychological assistance | 36 | 1.1 |
| Design | 34 | 1.0 |
| Household utensils | 33 | 1.0 |
| Other restaurant activities | 33 | 1.0 |
| Gallery | 32 | 0.9 |
| Dentistry | 29 | 0.9 |
| Other company service | 23 | 0.7 |
| Training center | 20 | 0.6 |
| Cosmetics store | 19 | 0.6 |
| Eyewear store | 18 | 0.5 |
| Other personal services | 18 | 0.5 |
| Theater / Movies | 18 | 0.5 |
| Electronics, computers | 11 | 0.3 |
| Gas station | 9 | 0.3 |
| Male hair shop | 9 | 0.3 |
| Gambling | 8 | 0.2 |
| Car rental | 7 | 0.2 |
| Car repair | 6 | 0.2 |
| Other medical practice | 6 | 0.2 |
| Beauty salon | 5 | 0.1 |
| Carwash | 2 | 0.1 |
| Other car-related company | 2 | 0.1 |
| Eye doctor | 1 | 0.0 |
| Taxi | 1 | 0.0 |
3.2 Geocoding the database
Since the main purpose of the project is to provide a spatial analysis of shop changes in Miðborg, a key step was to geocode (i.e., to assign geographical coordinates) to each shop listed in the database in order to be able to map shops in a GIS. The geocoding process has been implemented with ArcGIS Pro (License: Sorbonne University, Faculté des Lettres). The database was split into three sub databases (one for 2015, one for 2019 and one for 2020), each of them was geocoded. A specific shapefile has been created for each sub-category of shop.
3.3 Mapping the georeferenced database onto an online mapping application
The geographical information produced through the geocoding process has been displayed on an online application available at that link: https://fl-su.maps.arcgis.com/apps/webappviewer/index.html?id=9dd7e923a6ca472fadabcf3f20d3617d
The application provides different tools:
- Display: Choose what layers you want to see on the map by clicking on the layer button .
-
Explore:
- To get more information about a peculiar shop or street, just click on the shop or street and a pop-up window will open.
- You can use the select button to get some statistics about some subcategories of shop for a specific sub-area. Just draw on the map the area that you are interested in and a pop-up window will appear and the counting for the categories of shop you are interested in.
- You can also display diagrams showing the number of shops for each category by clicking on the diagram button.
- Export: You can export the map as a *.pdf or other format by clicking on the print button.