6 More or less diversity?
Data also allow to provide insight into the issue of evolution of shop diversity in the neighbourhood.
To measure the diversity of a street in terms of shops, we can use a statistical indicator called the coefficient of variation. For each street it measures how diverse the retail structure is. The calculation of shop diversity has been made for 2015, 2019 and June 2020 (maps are available on the online app). A high value indicates that a street displays an significant diversity of shops. A low value indicates a low level of diversity of shops in the street.This indicator also presents the advantage to allow comparison.
Based on this indicator, it is possible to measure if a street has gained or lost business diversity just by comparing the coefficient of variation in 2015 and June 2020. Here, a negative value means that the street has less diverse shops in 2020 than in 2015. A positive value means that the street has gained diversity between 2015 and 2020
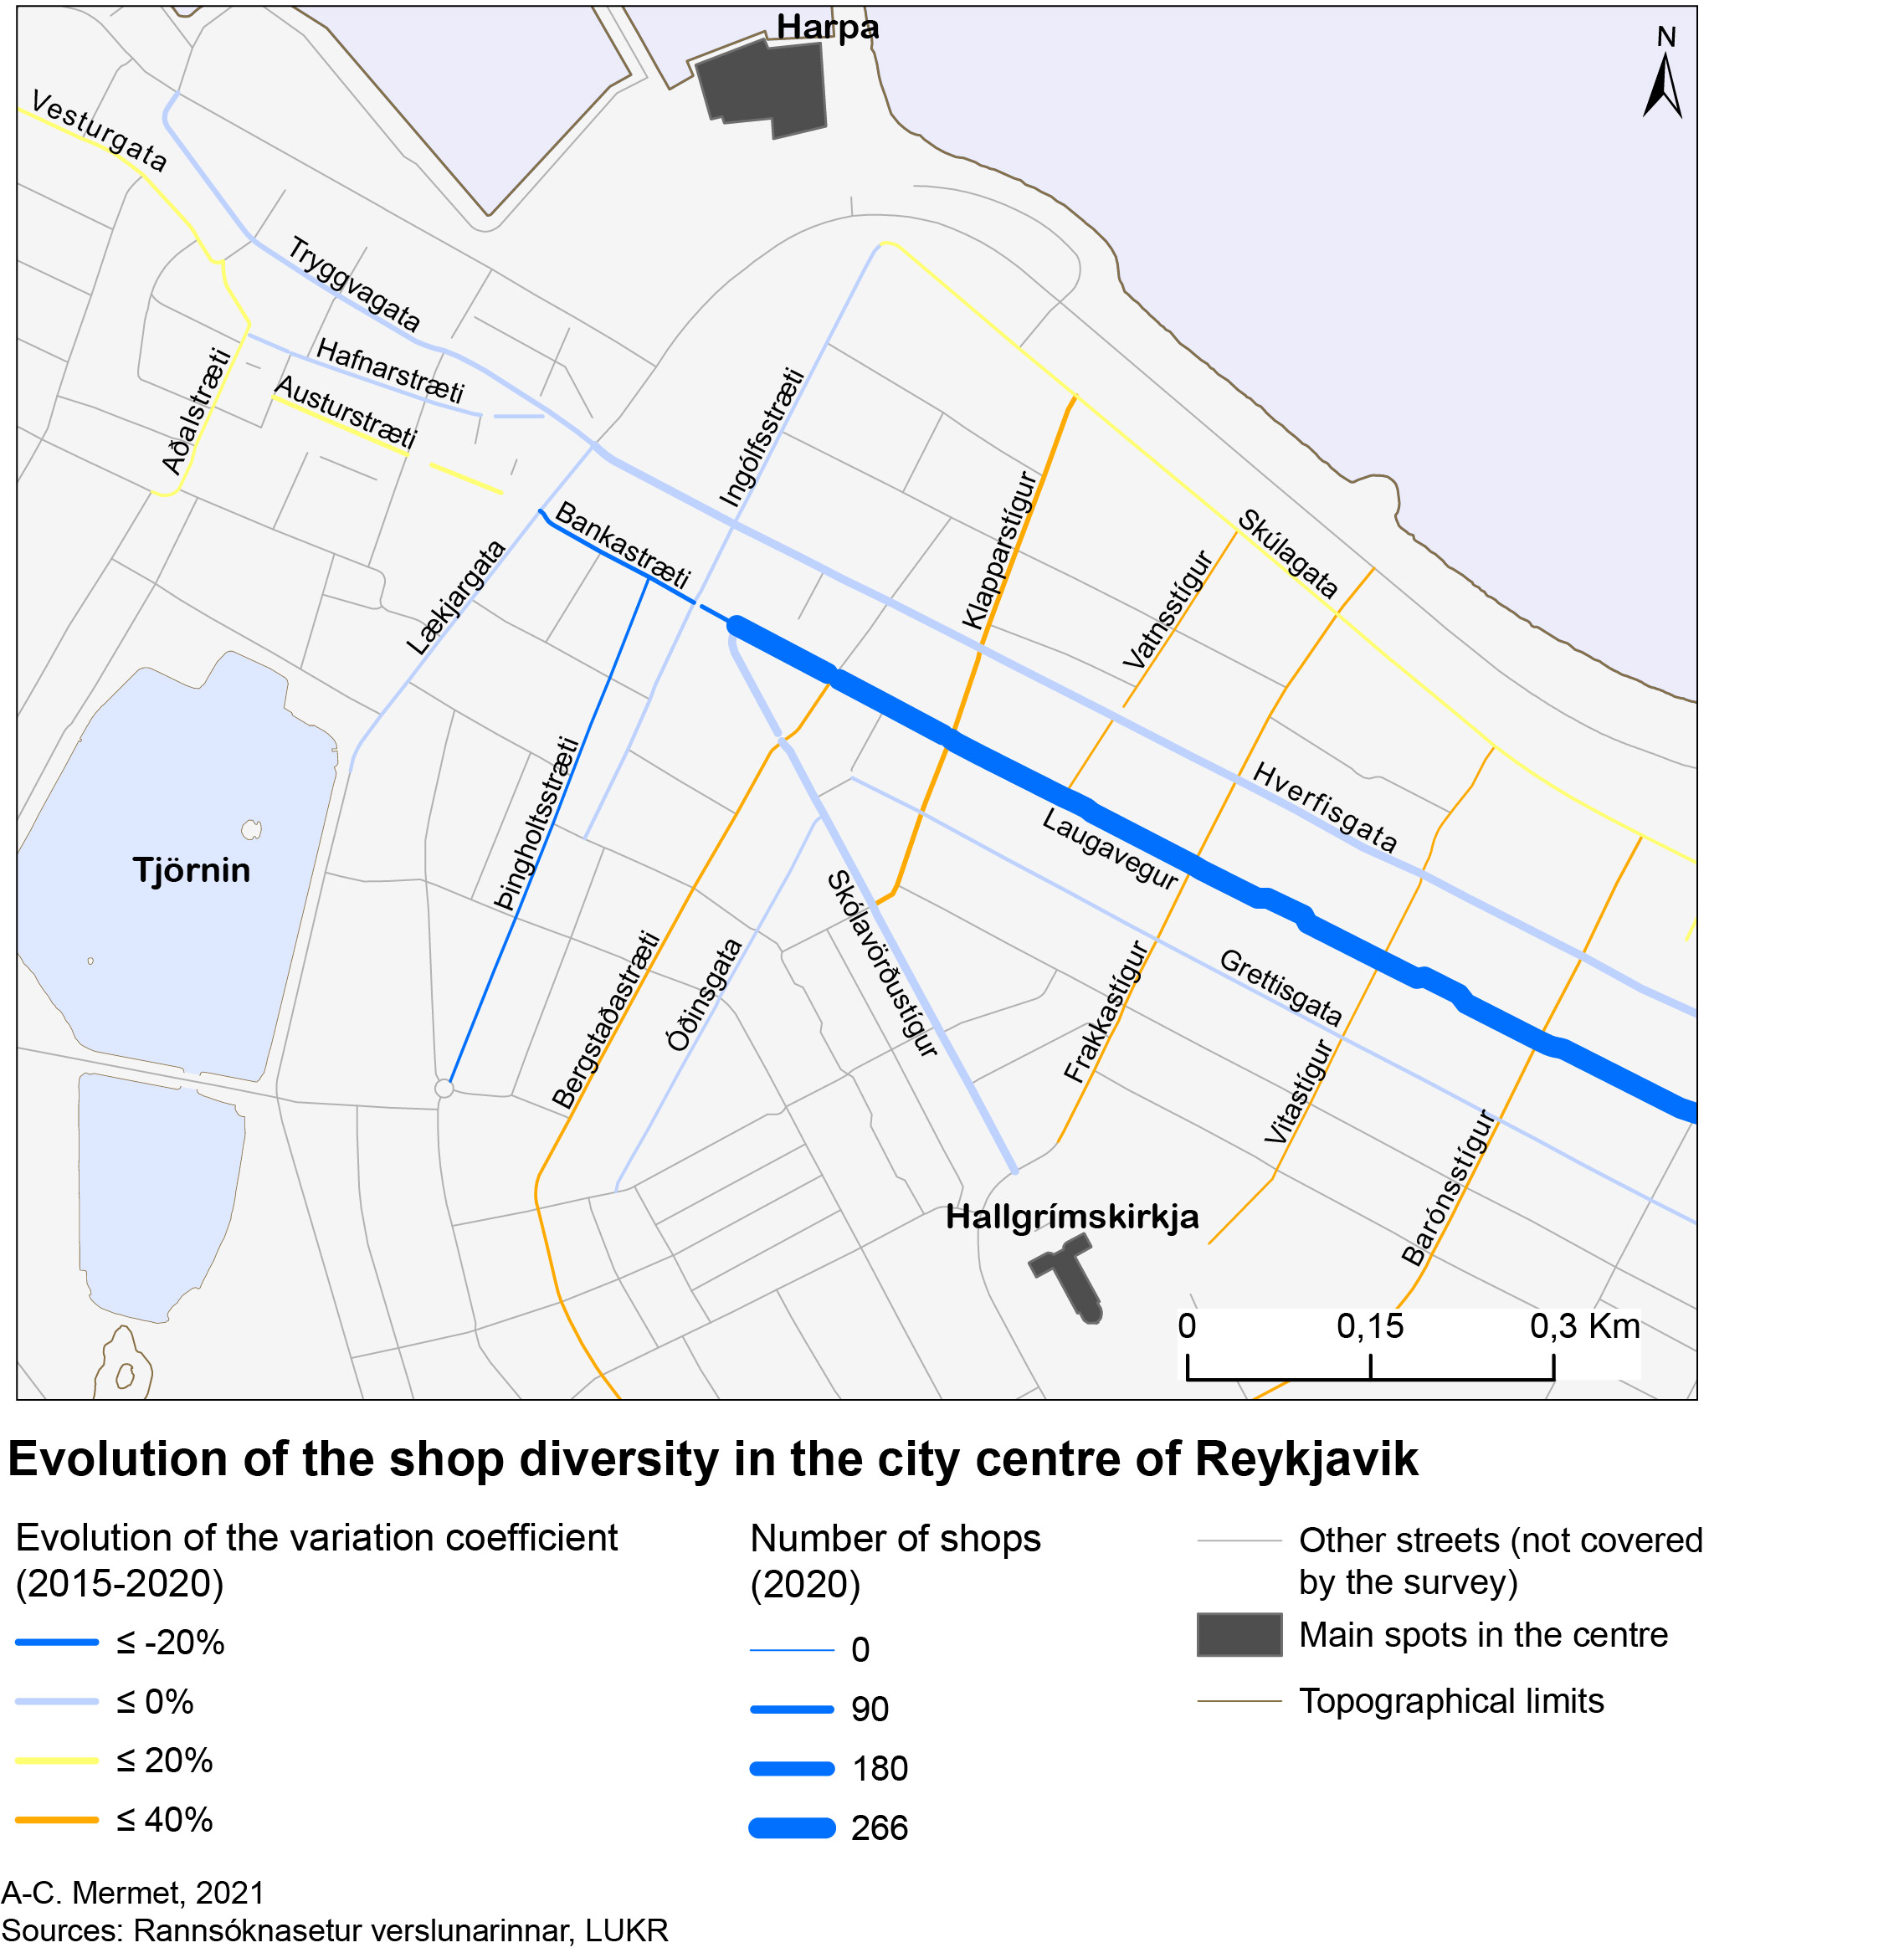
Figure 6.1: Evolution of the diversity of shops (2015-20)
Interestingly, Figure 6.1 shows that the main shopping streets (Laugavegur, Skólavörðustígur, Hverfisgata) have lost shop diversity (due to the encroachment of tourism and entertainement activities at the expense of personal services, apparel and accessories shops mostly). Conversely, the streets that are perpendicular to Laugavegur have all gained diversity.It looks as if shops that added diversity to the main shopping streets (i.e. shops that weren’t linked to tourism and general entertainement) tended to be transfered on secondary streets.
| 2015 | 2020 | Evolution 2015-20 (Count) | CV 2015 | CV 2019 | CV 2020 | Evolution CV 2015-20 | |
|---|---|---|---|---|---|---|---|
| Snorrabraut | 25 | 21 | -4 | 67.3 | 87.6 | 124.0 | 56.7 |
| Frakkastígur | 9 | 13 | 4 | 60.3 | 100.0 | 100.0 | 39.7 |
| Vatnsstígur | 9 | 8 | -1 | 63.1 | 98.6 | 98.6 | 35.5 |
| Barónsstígur | 17 | 15 | -2 | 66.0 | 85.6 | 100.0 | 34.0 |
| Vitastígur | 8 | 8 | 0 | 52.7 | 79.1 | 79.1 | 26.4 |
| Klapparstígur | 62 | 42 | -20 | 94.2 | 85.1 | 120.0 | 25.9 |
| Bergstaðastræti | 28 | 18 | -10 | 71.1 | 105.1 | 94.7 | 23.6 |
| Skúlagata | 44 | 23 | -21 | 90.0 | 91.3 | 108.4 | 18.4 |
| Vesturgata | 32 | 27 | -5 | 84.5 | 101.4 | 100.0 | 15.5 |
| Aðalstræti | 31 | 18 | -13 | 88.4 | 104.0 | 101.6 | 13.2 |
| Austurstræti | 35 | 40 | 5 | 78.9 | 91.7 | 87.1 | 8.1 |
| Mjóstræti | 2 | 0 | -2 | 0.0 | 0.0 | 0.0 | 0.0 |
| Garðastræti | 0 | 14 | 14 | 0.0 | 60.4 | 49.9 | 0.0 |
| Kárastígur | 0 | 2 | 2 | 0.0 | 0.0 | 86.6 | 0.0 |
| Njálsgata | 0 | 12 | 12 | 0.0 | 30.0 | 30.0 | 0.0 |
| Fiskislóð | 0 | 68 | 68 | 0.0 | 124.1 | 123.5 | 0.0 |
| Lindargata | 0 | 6 | 6 | 0.0 | 38.5 | 38.5 | 0.0 |
| Grandagarður | 0 | 108 | 108 | 0.0 | 125.6 | 184.8 | 0.0 |
| Hólmaslóð | 0 | 20 | 20 | 0.0 | 85.8 | 73.2 | 0.0 |
| Egilsgata | 1 | 1 | 0 | 0.0 | 0.0 | 0.0 | 0.0 |
| Veghúsastígur | 0 | 1 | 1 | 0.0 | 0.0 | 0.0 | 0.0 |
| Eyjarslóð | 0 | 11 | 11 | 0.0 | 51.6 | 51.6 | 0.0 |
| Sölvhólsgata | 0 | 5 | 5 | 0.0 | 0.0 | 0.0 | 0.0 |
| Hallveigarstígur | 0 | 3 | 3 | 0.0 | 0.0 | 66.7 | 0.0 |
| Hafnartorg | 0 | 28 | 28 | 0.0 | 387.3 | 66.7 | 0.0 |
| Ingólfsstræti | 21 | 24 | 3 | 89.4 | 94.4 | 88.7 | -0.7 |
| Lækjargata | 30 | 25 | -5 | 116.2 | 110.4 | 114.6 | -1.6 |
| Tryggvagata | 43 | 49 | 6 | 91.7 | 81.7 | 88.7 | -2.9 |
| Grettisgata | 25 | 29 | 4 | 144.2 | 114.8 | 140.6 | -3.6 |
| Skólavörðustígur | 93 | 90 | -3 | 109.8 | 96.8 | 101.7 | -8.1 |
| Hverfisgata | 83 | 88 | 5 | 116.0 | 98.9 | 106.8 | -9.3 |
| Óðinsgata | 21 | 18 | -3 | 90.0 | 84.5 | 79.8 | -10.2 |
| Hafnarstræti | 34 | 31 | -3 | 115.1 | 124.5 | 102.4 | -12.7 |
| Bankastræti | 39 | 37 | -2 | 119.4 | 97.4 | 94.5 | -24.9 |
| Þingholtsstræti | 15 | 16 | 1 | 85.5 | 69.4 | 58.9 | -26.6 |
| Laugavegur (upp að Hlemmi) | 297 | 266 | -31 | 150.9 | 124.9 | 123.3 | -27.6 |