4 Shop changes by categories
Important : To allow comparability of figures, these statistics are based on the same perimeter throughout the time. Therefore, data for Grandi are not included since they are not available for 2019 and 2020.
The aim of this section is to uncover what category of shop has increased/decreased between 2015 and 2020.
4.1 Introduction: the retailscape in June 2020
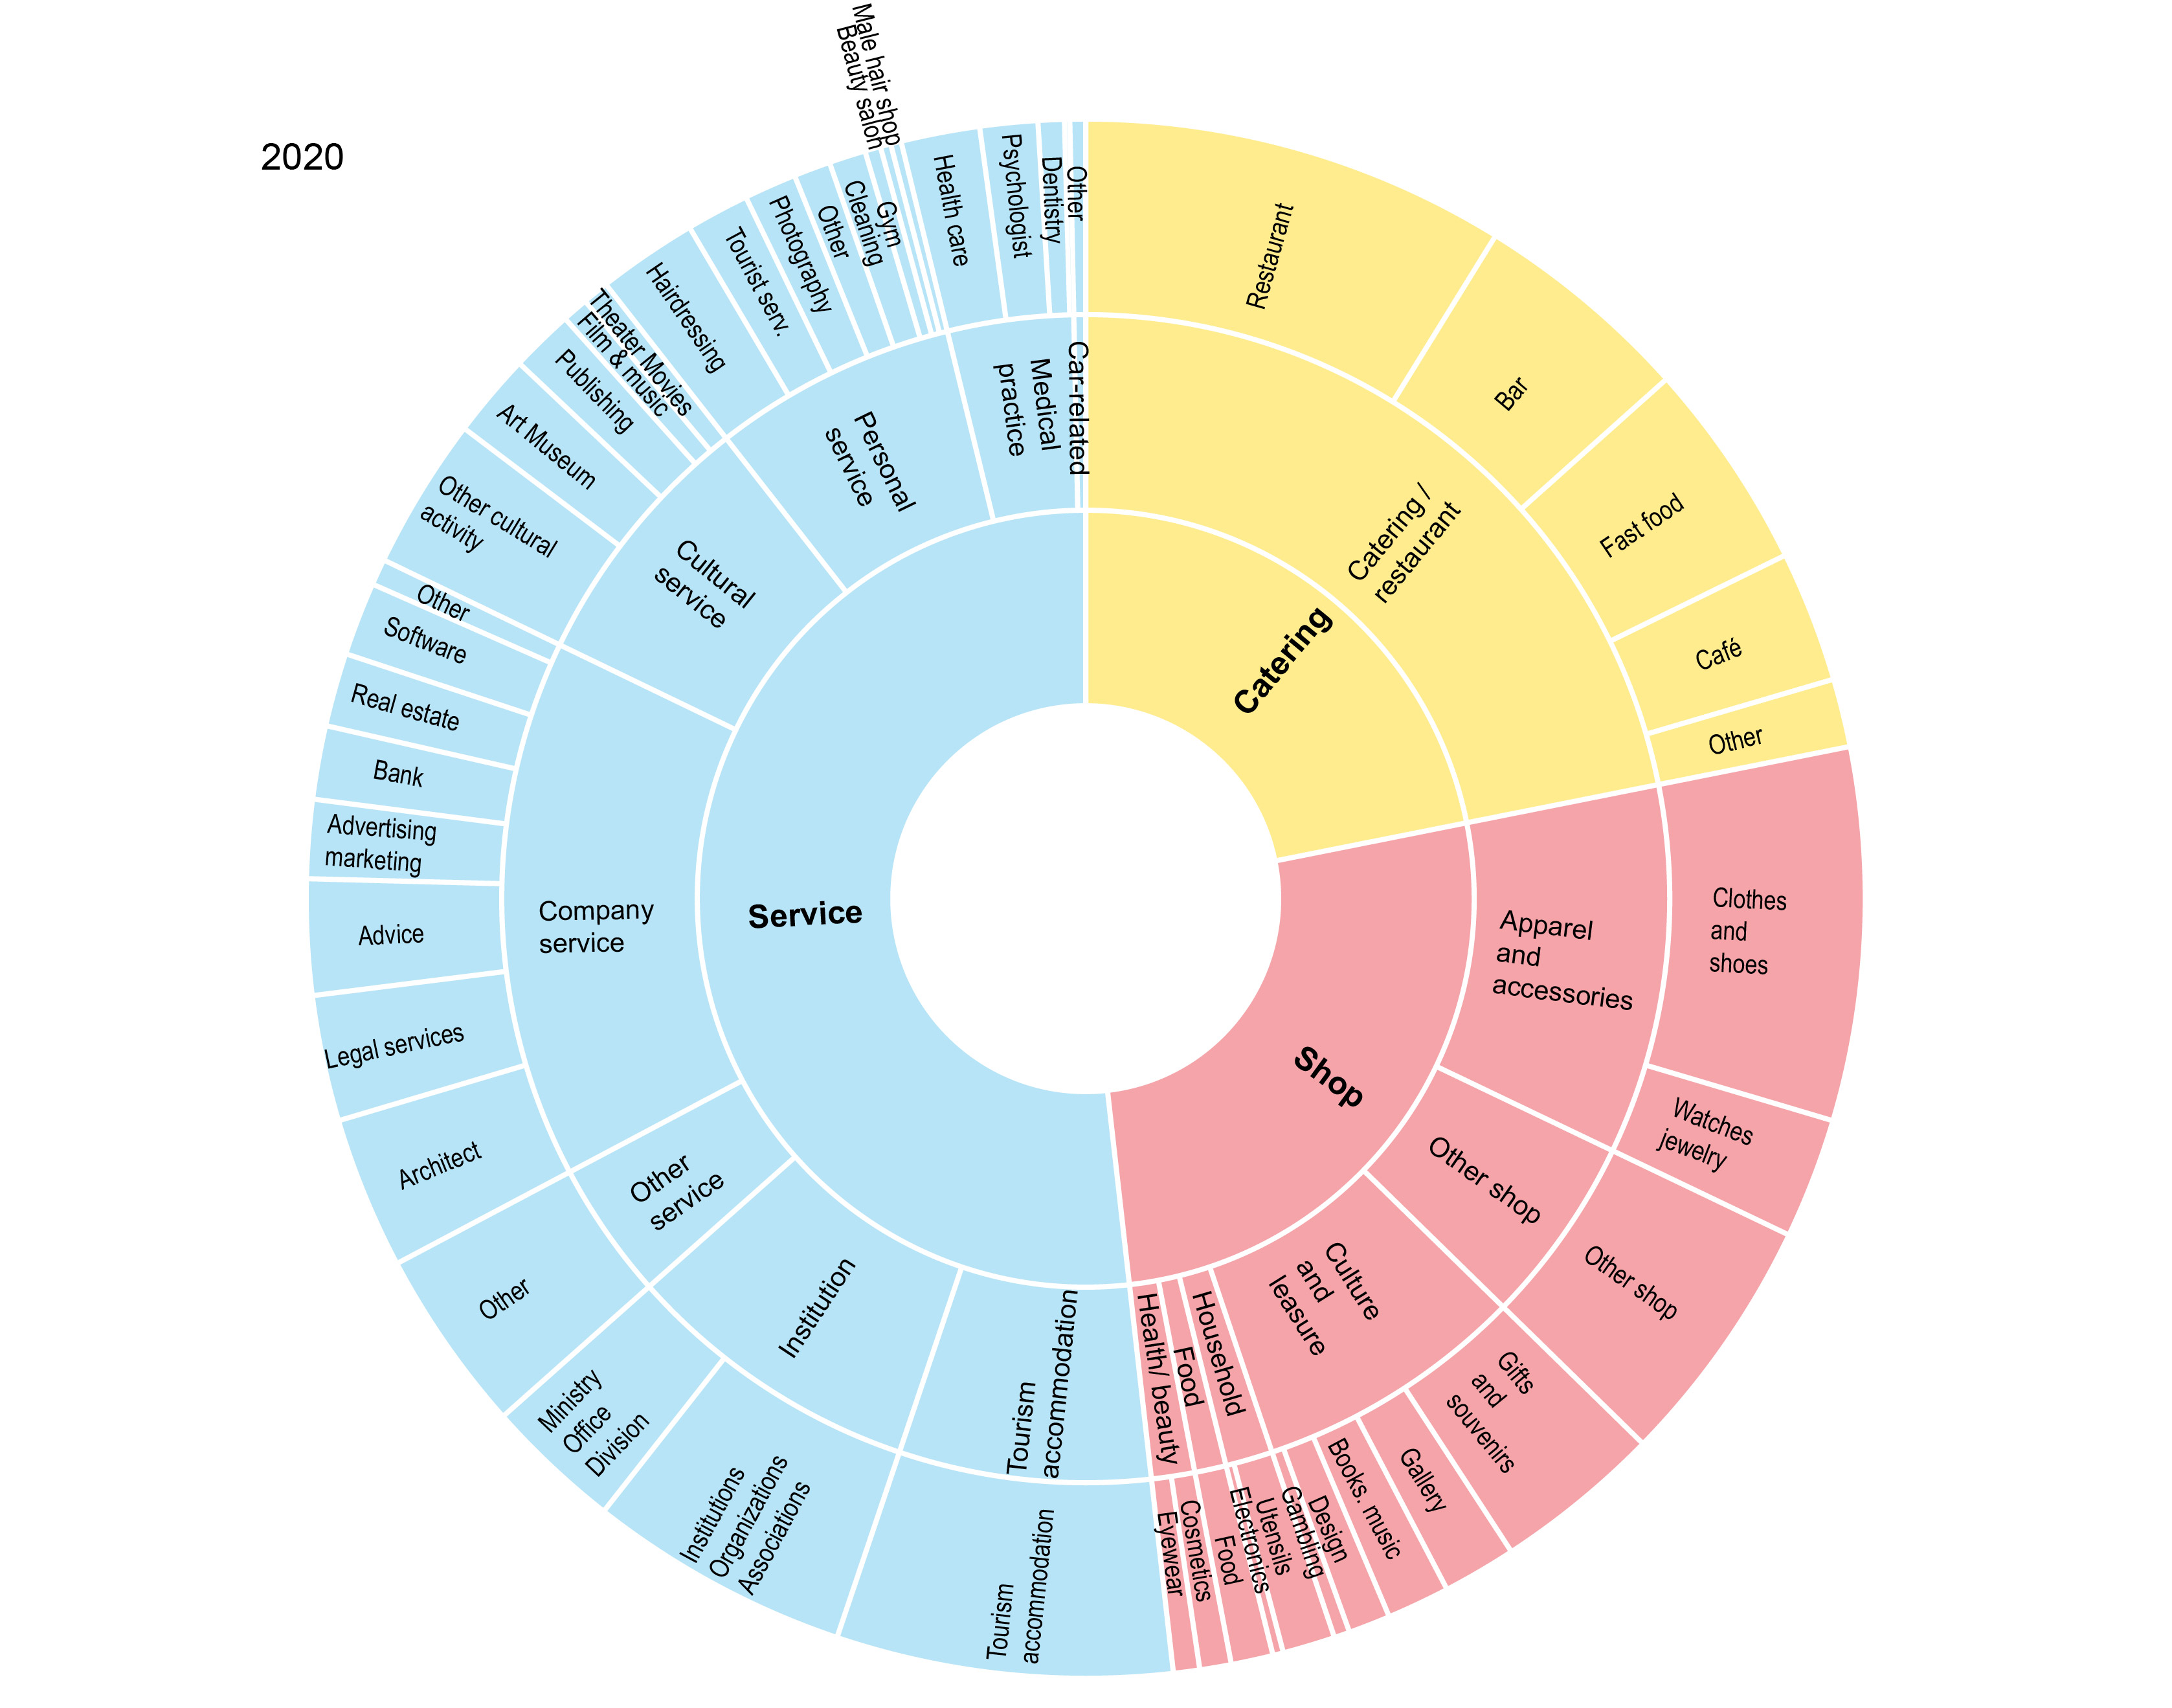
Figure 4.1: Sunburst of the shop categories in June 2020
4.2 Category 1
Miðborg has lost shops and services between 2015 and 2020. The vacancy category should be considered cautiously since no vacancy is reported in the 2015 survey and might not have been taken into account in the database. The increase of the Restaurant and catering category is noteworthy (+27 units).
| 2015 | 2019 | 2020 | Proportion 2015 | Proportion 2019 | Proportion 2020 | Evolution 2015-20 (Count) | Evolution 2015-19 (Count) | Evolution 2019-20 (Count) | Evolution 2015-20 (%) | |
|---|---|---|---|---|---|---|---|---|---|---|
| Vacancy | 0 | 42 | 55 | 0.0 | 4.1 | 5.6 | 55 | 42 | 13 | Inf |
| Catering | 170 | 194 | 197 | 16.9 | 18.9 | 20.2 | 27 | 24 | 3 | 15.9 |
| Shop | 252 | 248 | 232 | 25.1 | 24.2 | 23.8 | -20 | -4 | -16 | -7.9 |
| Other services | 582 | 541 | 492 | 58.0 | 52.8 | 50.4 | -90 | -41 | -49 | -15.5 |
4.3 Category 2
Category 2 provides a refined perspective on the reconfigurations of the local retailscape.
Categories that have increased are mostly linked to tourism and general entertainment (+ +29 Catering/restaurant, +17 Culture and leasure shops, +14 tourism accommodation). The increase regarding vacancy should be interpreted very cautiously since vacancies were not included in the version 2015 of the database). On the contrary, categories that have decreased are mostly link to shop and services catering to local population (-40 Personal services, -33 apparel and accessories shops, -9 medical practices, -6 health and beauty shops).
| 2015 | 2019 | 2020 | Proportion 2015 | Proportion 2019 | Proportion 2020 | Evolution 2015-20 (Count) | Evolution 2015-20 (%) | |
|---|---|---|---|---|---|---|---|---|
| Vacancy | 0 | 42 | 56 | 0.0 | 4.1 | 5.7 | 56 | Inf |
| Catering / Restaurant | 172 | 196 | 201 | 17.1 | 19.1 | 20.6 | 29 | 16.9 |
| Culture and leasure | 73 | 90 | 90 | 7.3 | 8.8 | 9.2 | 17 | 23.3 |
| Tourism accommodation | 50 | 65 | 64 | 5.0 | 6.3 | 6.6 | 14 | 28.0 |
| Other shop | 39 | 50 | 48 | 3.9 | 4.9 | 4.9 | 9 | 23.1 |
| Institution | 72 | 81 | 76 | 7.2 | 7.9 | 7.8 | 4 | 5.6 |
| Other service | 33 | 28 | 36 | 3.3 | 2.7 | 3.7 | 3 | 9.1 |
| Car related activity | 6 | 4 | 3 | 0.6 | 0.4 | 0.3 | -3 | -50.0 |
| Food | 11 | 9 | 8 | 1.1 | 0.9 | 0.8 | -3 | -27.3 |
| Household goods | 14 | 14 | 11 | 1.4 | 1.4 | 1.1 | -3 | -21.4 |
| Health and beauty | 19 | 13 | 13 | 1.9 | 1.3 | 1.3 | -6 | -31.6 |
| Medical practices | 42 | 32 | 33 | 4.2 | 3.1 | 3.4 | -9 | -21.4 |
| Cultural services | 67 | 56 | 46 | 6.7 | 5.5 | 4.7 | -21 | -31.3 |
| Apparel and accessories | 127 | 110 | 94 | 12.6 | 10.7 | 9.6 | -33 | -26.0 |
| Personal service | 100 | 73 | 60 | 10.0 | 7.1 | 6.1 | -40 | -40.0 |
| Company services | 179 | 162 | 137 | 17.8 | 15.8 | 14.0 | -42 | -23.5 |
4.4 Category 3
Category 3 is the most detailed.
Categories that have increased the most (at least +8 units between 2015 and 2020) are fast-food, tourism accommodation, other restaurant activities, other shops, bank and financial services, galleries, gift and souvenir shops, which are mostly categories related to tourism and entertainment.
Categories that have decreased the most (at least -8 units between 2015 and 2020) are clothes and shoes, tourist services, film and music production, advice, hairdressing, software development, repair/cleaning, dentistry, legal services, advertising and marketing services, publishing company and architects, which corresponds mostly to shop and services catering local’s need (with the noteworthy exception of the “tourist services” category).
| 2015 | 2019 | 2020 | Proportion 2015 | Proportion 2019 | Proportion 2020 | Evolution 2015-20 (Count) | Evolution 2015-20 (%) | |
|---|---|---|---|---|---|---|---|---|
| Vacancy | 0 | 42 | 56 | 0.0 | 4.1 | 5.7 | 56 | Inf |
| Fast food | 18 | 34 | 40 | 1.8 | 3.3 | 4.1 | 22 | 122.2 |
| Tourism accommodation | 50 | 65 | 64 | 5.0 | 6.3 | 6.6 | 14 | 28.0 |
| Other restaurant activities | 1 | 9 | 13 | 0.1 | 0.9 | 1.3 | 12 | 1200.0 |
| Other shop | 39 | 50 | 48 | 3.9 | 4.9 | 4.9 | 9 | 23.1 |
| Bank and financial service | 6 | 12 | 14 | 0.6 | 1.2 | 1.4 | 8 | 133.3 |
| Gallery | 6 | 10 | 14 | 0.6 | 1.0 | 1.4 | 8 | 133.3 |
| Gifts and souvenirs | 24 | 34 | 32 | 2.4 | 3.3 | 3.3 | 8 | 33.3 |
| Art Museum | 10 | 19 | 16 | 1.0 | 1.9 | 1.6 | 6 | 60.0 |
| Health care | 10 | 12 | 15 | 1.0 | 1.2 | 1.5 | 5 | 50.0 |
| Ministry / Office / Division | 21 | 25 | 26 | 2.1 | 2.4 | 2.7 | 5 | 23.8 |
| Bar / Entertainment | 38 | 40 | 42 | 3.8 | 3.9 | 4.3 | 4 | 10.5 |
| Other cultural activity | 25 | 35 | 29 | 2.5 | 3.4 | 3.0 | 4 | 16.0 |
| Other personal services | 4 | 7 | 7 | 0.4 | 0.7 | 0.7 | 3 | 75.0 |
| Other service activities | 33 | 28 | 35 | 3.3 | 2.7 | 3.6 | 2 | 6.1 |
| Beauty salon | 1 | 2 | 2 | 0.1 | 0.2 | 0.2 | 1 | 100.0 |
| Gambling | 2 | 3 | 3 | 0.2 | 0.3 | 0.3 | 1 | 50.0 |
| Training center | 2 | 6 | 3 | 0.2 | 0.6 | 0.3 | 1 | 50.0 |
| Eye doctor | 0 | 0 | 1 | 0.0 | 0.0 | 0.1 | 1 | Inf |
| Books, music | 12 | 11 | 12 | 1.2 | 1.1 | 1.2 | 0 | 0.0 |
| Gas station | 3 | 3 | 3 | 0.3 | 0.3 | 0.3 | 0 | 0.0 |
| Household utensils | 10 | 11 | 10 | 1.0 | 1.1 | 1.0 | 0 | 0.0 |
| Real estate and rent | 14 | 21 | 14 | 1.4 | 2.0 | 1.4 | 0 | 0.0 |
| Cosmetics store | 7 | 6 | 6 | 0.7 | 0.6 | 0.6 | -1 | -14.3 |
| Institutions / Organizations / Associations | 51 | 56 | 50 | 5.1 | 5.5 | 5.1 | -1 | -2.0 |
| Other medical practice | 2 | 1 | 1 | 0.2 | 0.1 | 0.1 | -1 | -50.0 |
| Taxi | 1 | 0 | 0 | 0.1 | 0.0 | 0.0 | -1 | -100.0 |
| Car rental | 2 | 1 | 0 | 0.2 | 0.1 | 0.0 | -2 | -100.0 |
| Electronics, computers | 4 | 2 | 2 | 0.4 | 0.2 | 0.2 | -2 | -50.0 |
| Eyewear store | 7 | 5 | 5 | 0.7 | 0.5 | 0.5 | -2 | -28.6 |
| Other company service | 7 | 4 | 5 | 0.7 | 0.4 | 0.5 | -2 | -28.6 |
| Photography studio | 12 | 10 | 10 | 1.2 | 1.0 | 1.0 | -2 | -16.7 |
| Theater / Movies | 7 | 6 | 5 | 0.7 | 0.6 | 0.5 | -2 | -28.6 |
| Café | 28 | 27 | 25 | 2.8 | 2.6 | 2.6 | -3 | -10.7 |
| Food | 11 | 9 | 8 | 1.1 | 0.9 | 0.8 | -3 | -27.3 |
| Male hair shop | 5 | 2 | 2 | 0.5 | 0.2 | 0.2 | -3 | -60.0 |
| Design | 12 | 8 | 8 | 1.2 | 0.8 | 0.8 | -4 | -33.3 |
| Psychological assistance | 15 | 10 | 11 | 1.5 | 1.0 | 1.1 | -4 | -26.7 |
| Restaurant | 87 | 86 | 81 | 8.7 | 8.4 | 8.3 | -6 | -6.9 |
| Watches and jewelry | 30 | 24 | 23 | 3.0 | 2.3 | 2.4 | -7 | -23.3 |
| Architect | 37 | 33 | 29 | 3.7 | 3.2 | 3.0 | -8 | -21.6 |
| Publishing company | 20 | 12 | 12 | 2.0 | 1.2 | 1.2 | -8 | -40.0 |
| Advertising and marketing services | 24 | 16 | 15 | 2.4 | 1.6 | 1.5 | -9 | -37.5 |
| Legal services | 33 | 30 | 24 | 3.3 | 2.9 | 2.5 | -9 | -27.3 |
| Dentistry | 15 | 9 | 5 | 1.5 | 0.9 | 0.5 | -10 | -66.7 |
| Repairs / Cleaning | 17 | 11 | 7 | 1.7 | 1.1 | 0.7 | -10 | -58.8 |
| Software development | 24 | 26 | 14 | 2.4 | 2.5 | 1.4 | -10 | -41.7 |
| Hairdressing | 30 | 22 | 19 | 3.0 | 2.1 | 1.9 | -11 | -36.7 |
| Advice | 34 | 20 | 22 | 3.4 | 2.0 | 2.3 | -12 | -35.3 |
| Film and music production | 22 | 9 | 5 | 2.2 | 0.9 | 0.5 | -17 | -77.3 |
| Tourist services | 34 | 15 | 12 | 3.4 | 1.5 | 1.2 | -22 | -64.7 |
| Clothes and shoes | 97 | 86 | 71 | 9.7 | 8.4 | 7.3 | -26 | -26.8 |