2.5 Wordclouds
The ggwordcloud package adds wordcloud extension into the ggplot2 ecosystem. The geometry geom_text_wordcloud() has a similar sytax comparing to geom_text_repel: label for the word and size for the count.
library(ggwordcloud)


wordcloud_df <-tidy_books %>%
  anti_join(custom_stop_words) %>%
  inner_join(get_sentiments("bing")) %>%
  count(sentiment, word, sort = T) %>%
  top_n(200)

wordcloud_df %>%
  ggplot() +
  geom_text_wordcloud_area(aes(label = word, size = n)) +
  scale_size_area(max_size = 15)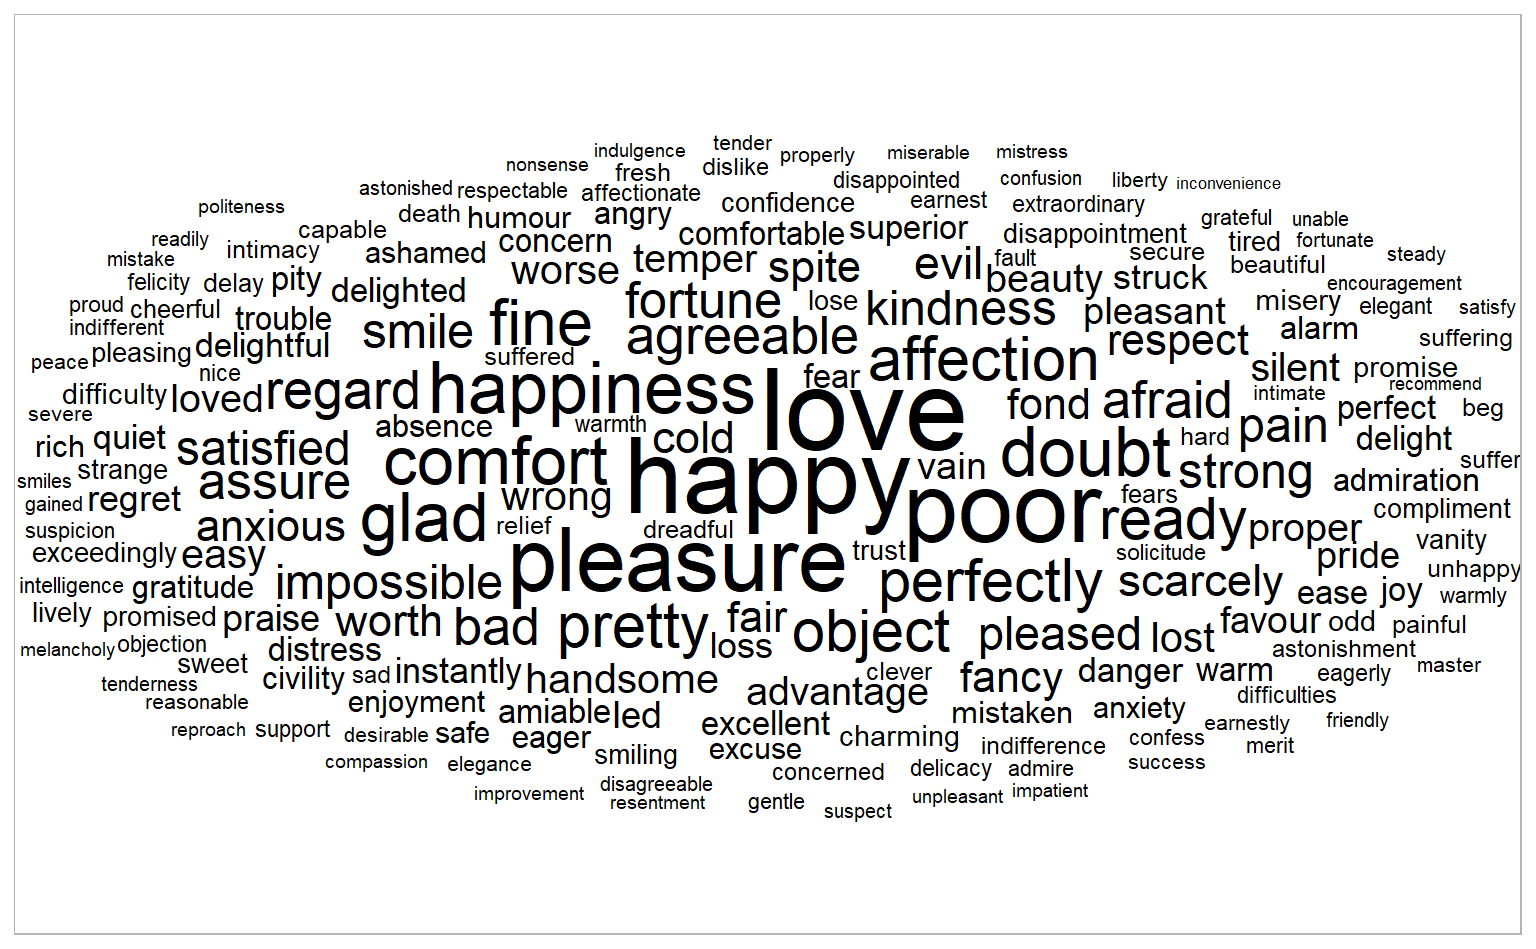
One particular issue with wordcloud plot is that they use font size porportional to the corresponding frequency, so that long words with smaller frequency can sometimes misleadingly encompass much ink area than short words with larger frequency. One solution is to use geom_texg_wordcloud, which aims to set the ink area, rather than font size, proportional to the frequency, so that our perception are not biased by number of letters.
wordcloud_df %>%
  ggplot() +
  geom_text_wordcloud_area(aes(label = word, size = n), shape = "star") +
  scale_size_area(max_size = 15)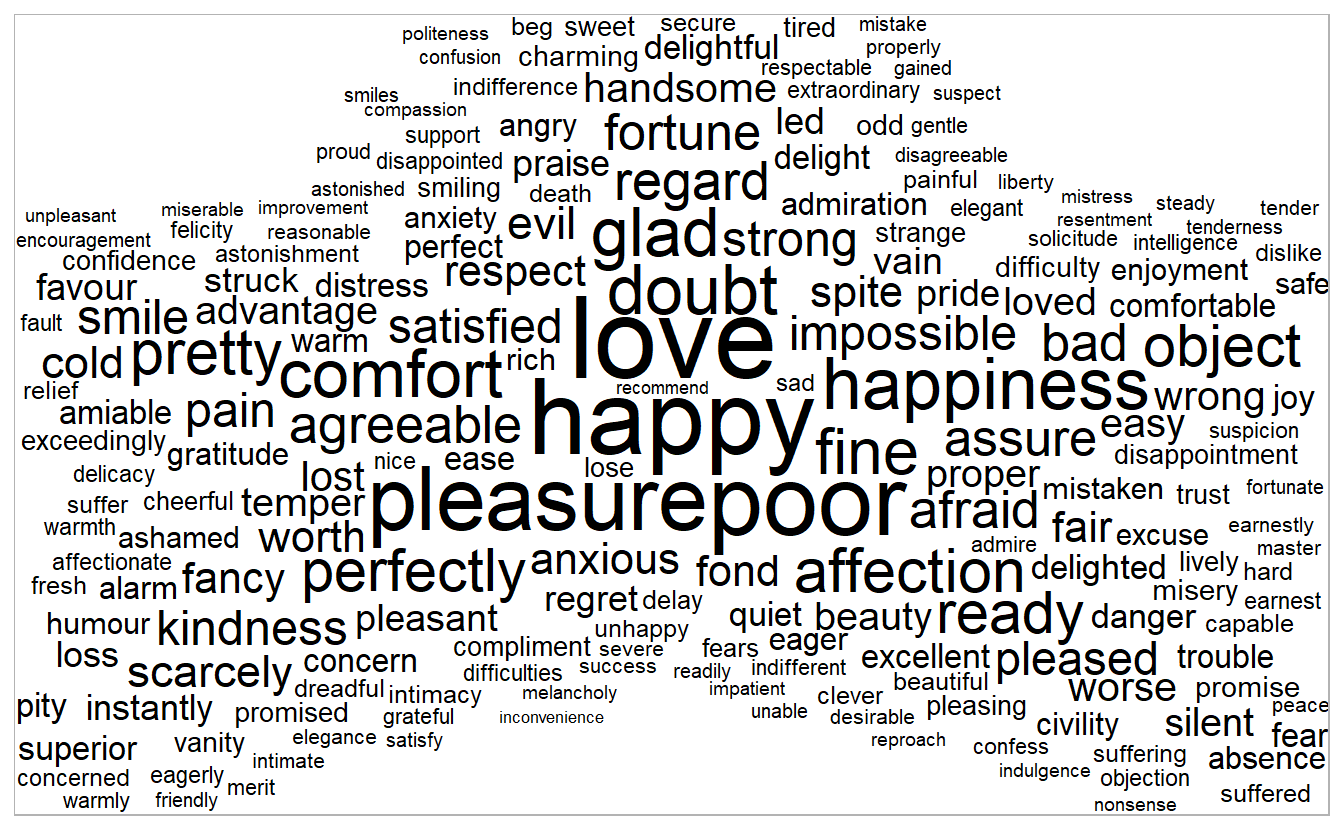
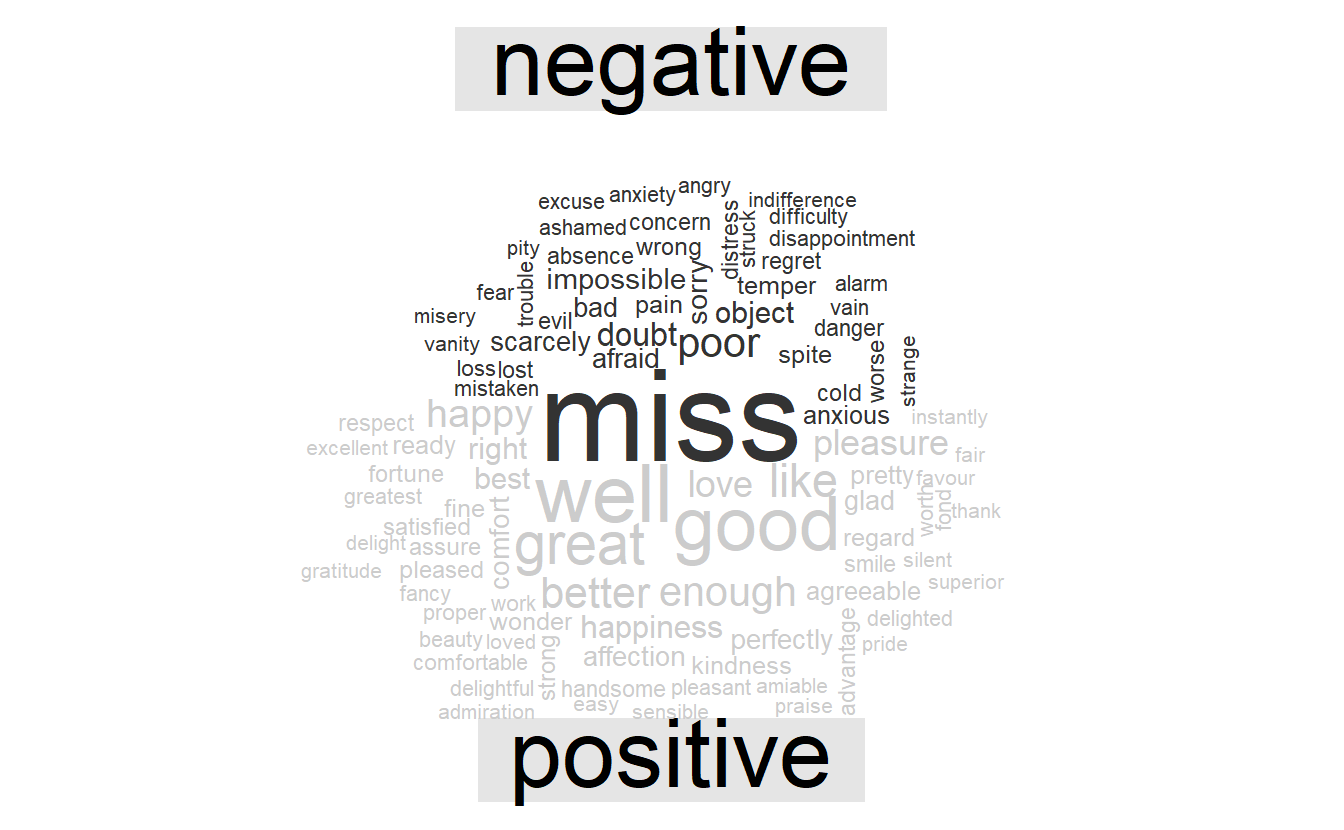
In other functions, such as wordcloud::comparison.cloud(), you may need to turn the data frame into a matrix with reshape2’s acast(). Let’s do the sentiment analysis to tag positive and negative words using an inner join, then find the most common positive and negative words. Until the step where we need to send the data to comparison.cloud()
library(wordcloud)

tidy_books %>%
  inner_join(get_sentiments("bing")) %>%
  count(word, sentiment, sort = TRUE) %>%
  reshape2::acast(word ~ sentiment, value.var = "n", fill = 0) %>%
  comparison.cloud(colors = c("gray20", "gray80"),
                   max.words = 100)