Chapter 4 Bottleneck Analysis
In Chick-fil-A, as the flow chart suggests, the potential bottleneck resources are workers at the ordering station and the pickup station, as well as car spaces in the pickup lane. The strategy we employ to find the bottleneck is to increase the amount of one focal resource while holding others constant, known as sensitivity analysis. For each parameter setting, we compute the performance metric, such as the average flow time, using the DES simulator functions. Finally, we claim a resource is a bottleneck if the increment in its amount greatly improves the performance metric.
4.1 Simulator functions
We first organize the simulators before and after the renovation in two functions that take model parameters as input and return the performance metrics as output.
Specifically, the simulator of Chick-fil-A before renovation is as follows.
################################################################################
########### Simulator before renovation ########################################
################################################################################
DES_before=function(num_cashier,num_cook,space_pickup){
  customer = trajectory("Customer's path") %>%
    set_attribute("lane", function() {
      (get_server_count(env, "lane1")>=get_server_count(env, "lane2"))*1+1}
    ) %>%
    select(function() {
      paste0("lane",get_attribute(env, "lane"))
    }) %>%
    seize_selected(1) %>% # Choose the shortest ordering lane

    seize("cashier",amount=1) %>% # Try to seize a cashier for placing the order
    timeout(function() {rexp(1, mu_cashier)}) %>%
    release("cashier",amount=1) %>%

    seize("lane_pickup",amount=1) %>% # Try to seize a car space in pickup lane
    release_selected(1) %>% # Once going to the pickup lane, the customer releases the ordering lane

    seize("cook",amount=1) %>% # Try to seize a cook for preparing the order
    timeout(function() {rexp(1, mu_cook)}) %>%
    release("cook",amount=1) %>%
    release("lane_pickup") # After the order is ready, the car immediately leaves the system

  dummy = trajectory() %>% # A dummy trajectory for recording the system carline
    set_attribute("carline_ordering",function() {
      carline1 = max(get_server_count(env,"lane1"),get_server_count(env,"lane2"))}) %>%
    set_attribute("carline_pickup",function() {
      carline2 = get_server_count(env,"lane_pickup")})

  env = simmer()

  num_rep = 500
  Data_before=data.frame(repetition=1:num_rep,system_carline=1:num_rep,flow_time=1:num_rep)

  for(ii in 1:num_rep){
    print(paste0("Repetition ",ii))
    env = simmer()
    env %>%
      add_resource("cashier", num_cashier) %>% # 2 Cashiers for taking orders
      add_resource("lane1", capacity=space_ordering) %>% # Ample car spaces in ordering lane1
      add_resource("lane2", capacity=space_ordering) %>% # Ample car spaces in ordering lane2
      add_resource("lane_pickup", capacity=space_pickup) %>% # 6 car spaces in pick up lane
      add_resource("cook", num_cook) %>% # 3 Cooks for preparing the orders
      add_generator("Customer", customer, function() rexp(1, arrival_rate), mon=2) %>% # Customer's arrival process
      add_generator("Dummy recorder", dummy, function() 1, mon=2) %>% # Dummy trajectory records every 1 minute
      run(simTime)

    ## average system carline length
    df_att = get_mon_attributes(env)
    df_att = df_att[substr(df_att$name,1,1)=='D',] # only look at dummy recorder
    ordering = df_att[df_att$key=="carline_ordering",'value']

    pickup = df_att[df_att$key=="carline_pickup",'value']

    system_carline = ordering + pickup

    Data_before[ii,'system_carline']=mean(system_carline[500:length(system_carline)])

    ## average flow time
    df_arr = get_mon_arrivals(env)
    df_arr = df_arr[substr(df_arr$name,1,1)=='C',] # picking customer's data only

    df_arr$flow_time = df_arr$end_time - df_arr$start_time

    Data_before[ii,'flow_time']=mean(df_arr$flow_time[200:nrow(df_arr)])
  }
  return(list(flow_time=mean(Data_before$flow_time),system_carline=mean(Data_before$system_carline)))
}
And, the simulator of Chick-fil-A after renovation is given by:
################################################################################
########### Simulator after renovation ########################################
################################################################################
DES_after=function(num_cashier,num_cook,space_pickup){
  customer = trajectory("Customer's path") %>%
    set_attribute("lane", function() {
      (get_server_count(env, "lane1")>=get_server_count(env, "lane2"))*1+1}
    ) %>%
    select(function() {
      paste0("lane",get_attribute(env, "lane"))
    }) %>%
    seize_selected(1) %>% # Choose the shortest ordering lane

    seize("cashier",amount=1) %>% # Try to seize a cashier for placing the order
    timeout(function() {rexp(1, mu_cashier)}) %>%
    release("cashier",amount=1) %>%

    select(function() {ifelse(get_attribute(env, "lane")==1,"lane1pickup","lane2pickup")}, id=2) %>%
    seize_selected(amount=1, id=2) %>% # Try to go on to the corresponding pickup lane
    release_selected(1) %>% # Once going to the pickup lane, release the ordering lane

    seize("cook",amount=1) %>% # Try to seize a cook for preparing the order
    timeout(function() {rexp(1, mu_cook)}) %>%
    release("cook",amount=1) %>%
    release_selected(amount=1, id=2) # After the order is ready, the car immediately leaves the system

  dummy = trajectory() %>% # A dummy trajectory for recording the system carline of lane1 and lane2
    set_attribute("carline_lane1",function() {
      carline1 = get_server_count(env,"lane1")+get_server_count(env,"lane1pickup")}) %>%
    set_attribute("carline_lane2",function() {
      carline2 = get_server_count(env,"lane2")+get_server_count(env,"lane2pickup")})

  env = simmer()

  num_rep = 500
  Data_after=data.frame(repetition=1:num_rep,system_carline=1:num_rep,flow_time=1:num_rep)

  for(ii in 1:num_rep){
    print(paste0("Repetition ",ii))
    env = simmer()
    env %>%
      add_resource("cashier", num_cashier) %>% # Cashiers for taking orders
      add_resource("lane1", capacity=space_ordering) %>% # Ample car spaces in ordering lane1
      add_resource("lane2", capacity=space_ordering) %>% # Ample car spaces in ordering lane2
      add_resource("lane1pickup", capacity=space_pickup) %>% # Car spaces in pick up lane1
      add_resource("lane2pickup", capacity=space_pickup) %>% # Car spaces in pick up lane2
      add_resource("cook", num_cook) %>% # 3 Cooks for preparing the orders
      add_generator("Customer", customer, function() rexp(1, arrival_rate), mon=2) %>% # Customer's arrival process
      add_generator("Dummy recorder", dummy, function() 1, mon=2) %>% # Dummy trajectory records every 1 minute
      run(simTime)

    ## average system carline length
    df_att = get_mon_attributes(env)
    df_att = df_att[substr(df_att$name,1,1)=='D',] # Extract values for the dummy recorder
    carline1 = df_att[df_att$key=='carline_lane1',]
    carline2 = df_att[df_att$key=='carline_lane2',]
    system_carline = pmax(carline1$value,carline2$value)

    Data_after[ii,'system_carline']=mean(system_carline[500:length(system_carline)])

    ## average flow time
    df_arr = get_mon_arrivals(env)
    df_arr = df_arr[substr(df_arr$name,1,1)=='C',] # picking customer's data only

    df_arr$flow_time = df_arr$end_time - df_arr$start_time

    Data_after[ii,'flow_time']=mean(df_arr$flow_time[200:nrow(df_arr)])
  }
  return(list(flow_time=mean(Data_after$flow_time),system_carline=mean(Data_after$system_carline)))
}
4.2 Identifying bottleneck
We consider the bottleneck of the Chick-fil-A drive-through before renovation.
4.2.1 Vary the number of cashiers
First, we only vary the number of cashiers from 1 to 4.
################################################################################
############ Vary the number of cashier ########################################
################################################################################
Bottleneck_cashier = data.frame(num_cashier=as.numeric(),num_cook=as.numeric(),space_pickup=as.numeric(),flow_time=as.numeric(),system_carline=as.numeric())

# num_cashier=2
num_cook=3
space_pickup=6

for(num_cashier in 1:4){
  out = DES_before(num_cashier,num_cook, space_pickup)
  Bottleneck_cashier = rbind(Bottleneck_cashier, data.frame(num_cashier=num_cashier,num_cook=num_cook,space_pickup=space_pickup,flow_time=out$flow_time,system_carline=out$system_carline))
}
Plotting the results.
Bottleneck_cashier$ordering_line=Bottleneck_cashier$system_carline-Bottleneck_cashier$space_pickup

data_plot = melt(Bottleneck_cashier,measure.vars=c("flow_time","system_carline","ordering_line"))

ggplot(data_plot, aes(x=num_cashier,y=value,shape=variable,linetype=variable)) + theme_bw()+
  geom_line() +
  geom_point(size=5)+
  labs(title="Varying the number of cashiers",x="Number of cashiers", y = "Performance metric")+
  scale_shape_manual(name = "Metric",
                     labels = c("Flow time", "System carline", "Ordering carline"),
                     values = c(16,2,3))+
  scale_linetype_discrete(guide = "none") +
  theme(text=element_text(size=20),legend.text=element_text(size=20))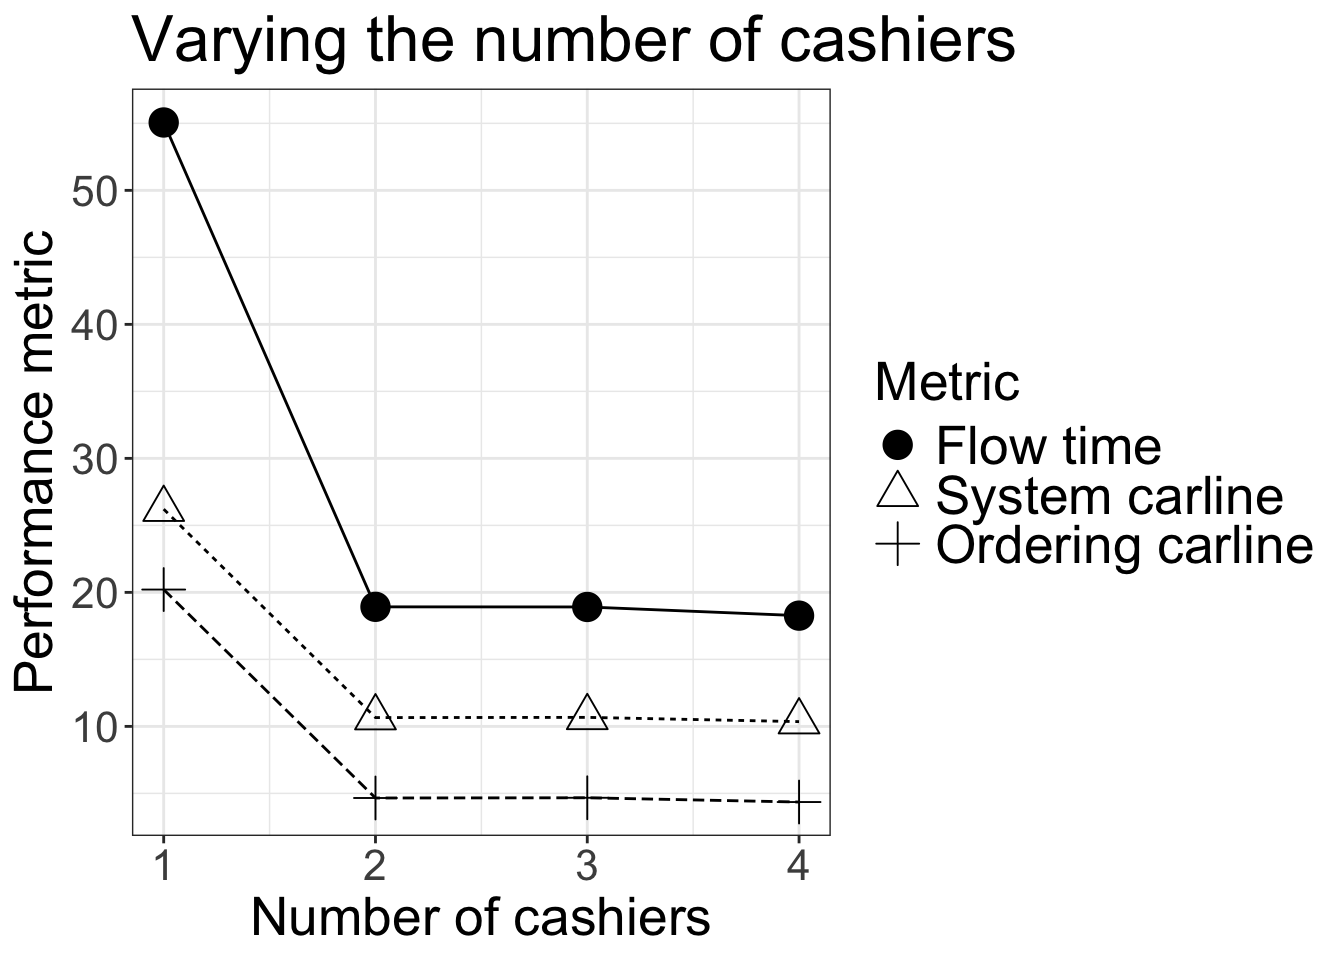
4.2.2 Vary the number of cooks
Second, we vary the number of cooks, while keeping the numbers of cashiers and car spaces constant.
################################################################################
############ Vary the number of cook ###########################################
################################################################################
Bottleneck_cook = data.frame(num_cashier=as.numeric(),num_cook=as.numeric(),space_pickup=as.numeric(),flow_time=as.numeric(),system_carline=as.numeric())

num_cashier=2
#num_cook=3
space_pickup=6

for(num_cook in 3:5){
  out = DES_before(num_cashier,num_cook, space_pickup)
  Bottleneck_cook = rbind(Bottleneck_cook, data.frame(num_cashier=num_cashier,num_cook=num_cook,space_pickup=space_pickup,flow_time=out$flow_time,system_carline=out$system_carline))
}
Plotting the results.
Bottleneck_cook$ordering_line=Bottleneck_cook$system_carline-Bottleneck_cook$space_pickup

data_plot = melt(Bottleneck_cook,measure.vars=c("flow_time","system_carline","ordering_line"))

ggplot(data_plot, aes(x=num_cook,y=value,shape=variable,linetype=variable)) + theme_bw()+
  geom_line() +
  geom_point(size=5)+
  labs(title="Varying the number of cooks",x="Number of cooks", y = "Performance metric")+
  scale_shape_manual(name = "Metric",
                     labels = c("Flow time", "System carline", "Ordering carline"),
                     values = c(16,2,3))+
  scale_linetype_discrete(guide = "none") +
  theme(text=element_text(size=20),legend.text=element_text(size=20))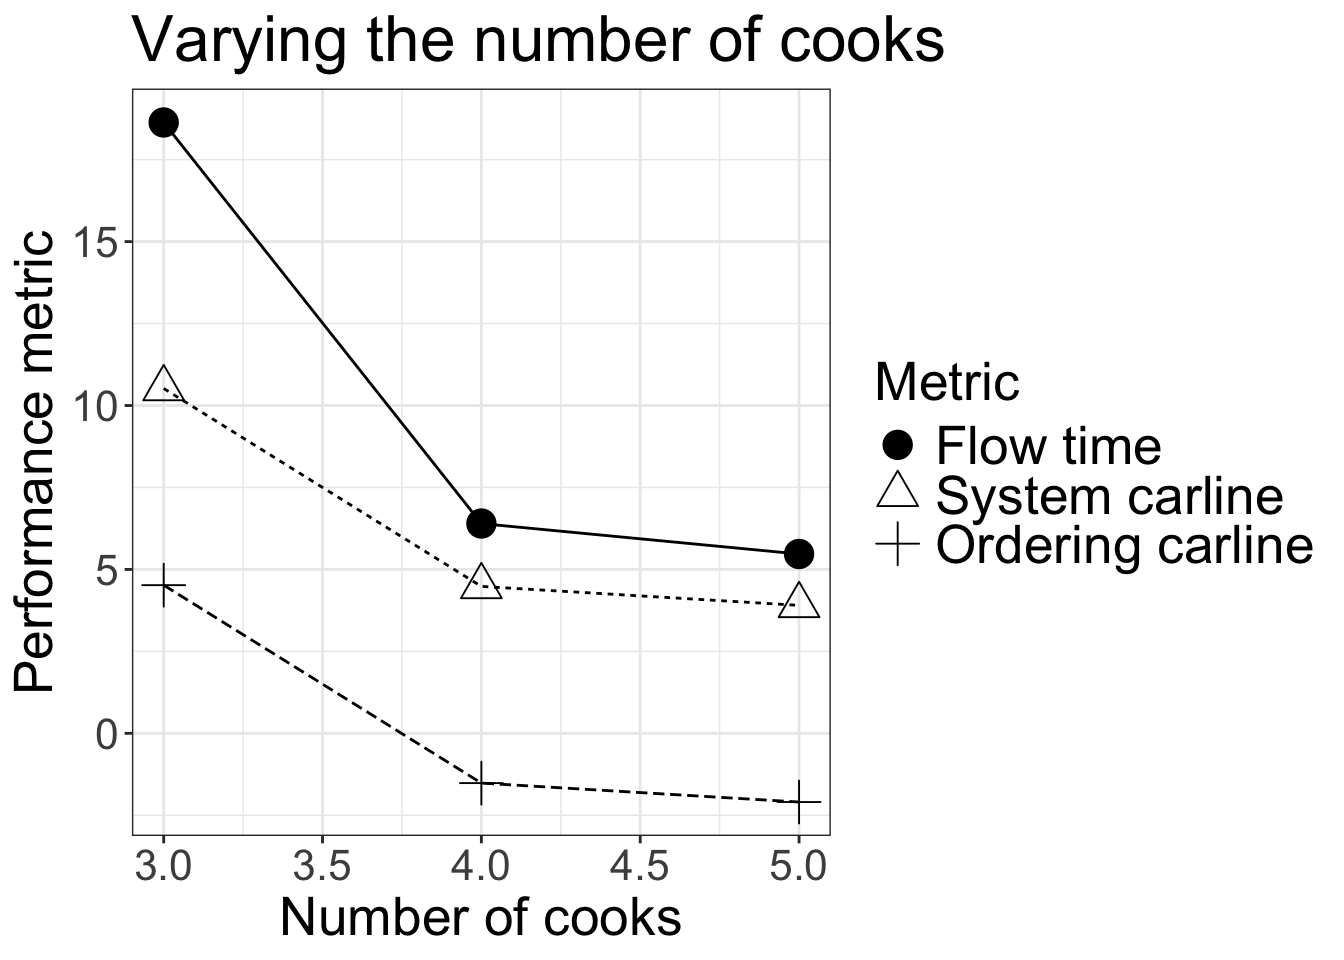
4.2.3 Vary the number of car spaces
Finally, we vary the number of car spaces in the pickup lane.
################################################################################
############ Vary the number of car space ######################################
################################################################################
Bottleneck_car = data.frame(num_cashier=as.numeric(),num_cook=as.numeric(),space_pickup=as.numeric(),flow_time=as.numeric(),system_carline=as.numeric())

num_cashier=2
num_cook=3
#space_pickup=6

for(space_pickup in 4:10){
  print(num_cook)
  out = DES_before(num_cashier,num_cook, space_pickup)
  Bottleneck_car = rbind(Bottleneck_car,
                          data.frame(num_cashier=num_cashier,num_cook=num_cook,space_pickup=space_pickup,flow_time=out$flow_time,system_carline=out$system_carline))
}
Plotting the results.
Bottleneck_car$ordering_line=Bottleneck_car$system_carline-Bottleneck_car$space_pickup

data_plot = melt(Bottleneck_car,measure.vars=c("flow_time","system_carline","ordering_line"))

ggplot(data_plot, aes(x=space_pickup,y=value,shape=variable,linetype=variable)) + theme_bw()+
  geom_line() +
  geom_point(size=5)+
  labs(title="Varying the number of car spaces \n at the pickup station",x="Number of car spaces", y = "Performance metric")+
  scale_shape_manual(name = "Metric",
                     labels = c("Flow time", "System carline", "Ordering carline"),
                     values = c(16,2,3))+
  scale_linetype_discrete(guide = "none") +
  theme(text=element_text(size=20),legend.text=element_text(size=20))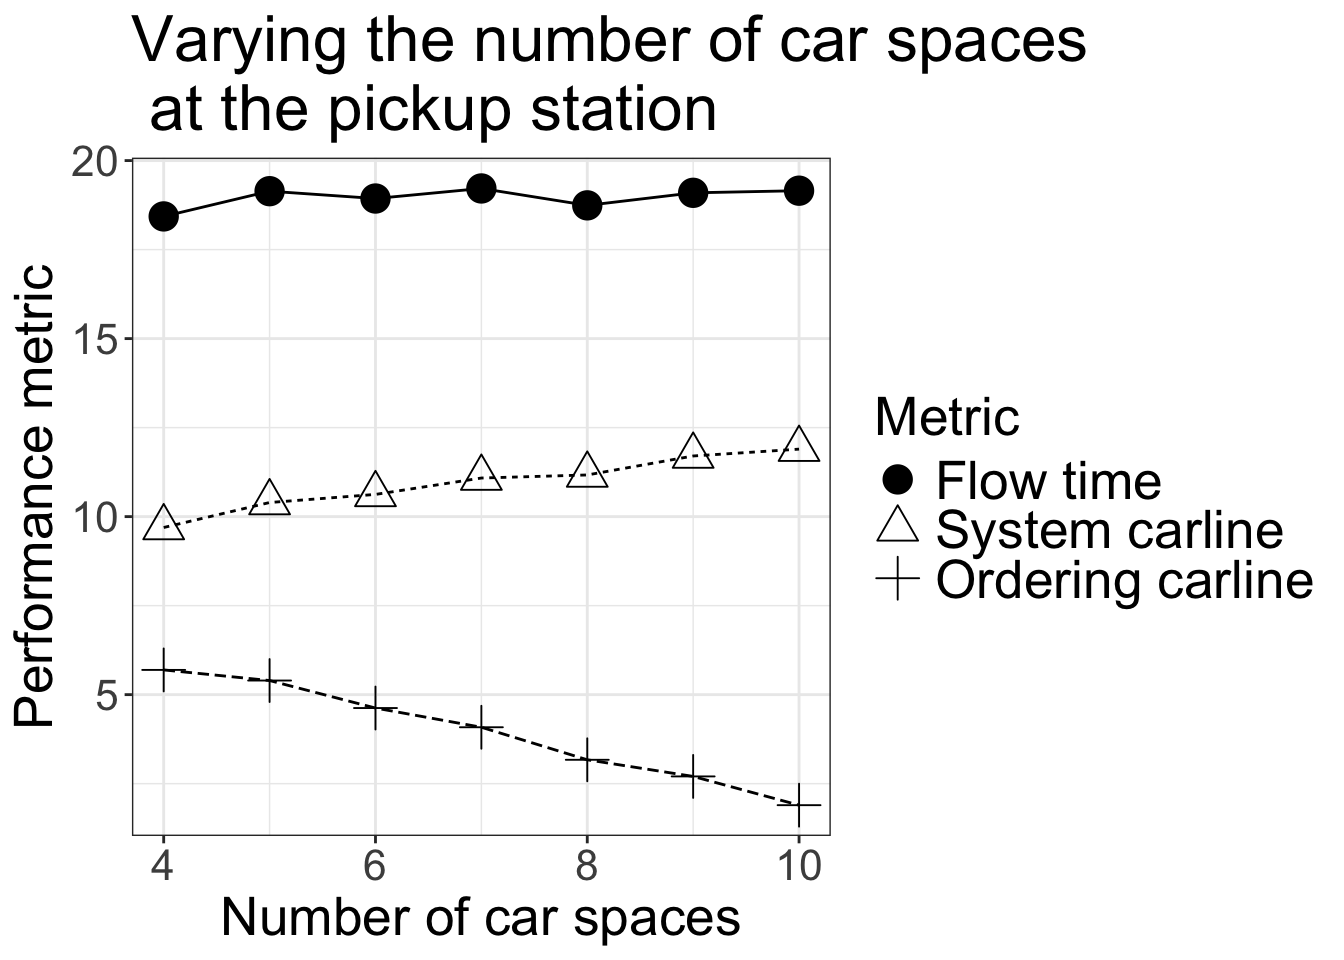
4.2.4 Compile the results
Figure 4.1 compiles the results of the above bottleneck analysis. Specifically, in the original model, the facility is staffed with 2 cashiers at the ordering lane and 3 cooks at the pickup station, and there are 6 car spaces in the pickup lane. Figure 4.1 (a) varies the number of cashiers from 1 to 4 while the numbers of cooks and car spaces do not change from the original setting. Similarly, Figures 4.1 (b) and (c) vary the number of cooks and the number of car spaces, respectively. In addition to the flow time and system carline, we add another metric, ordering carline, which is the longer queue among two ordering lanes.
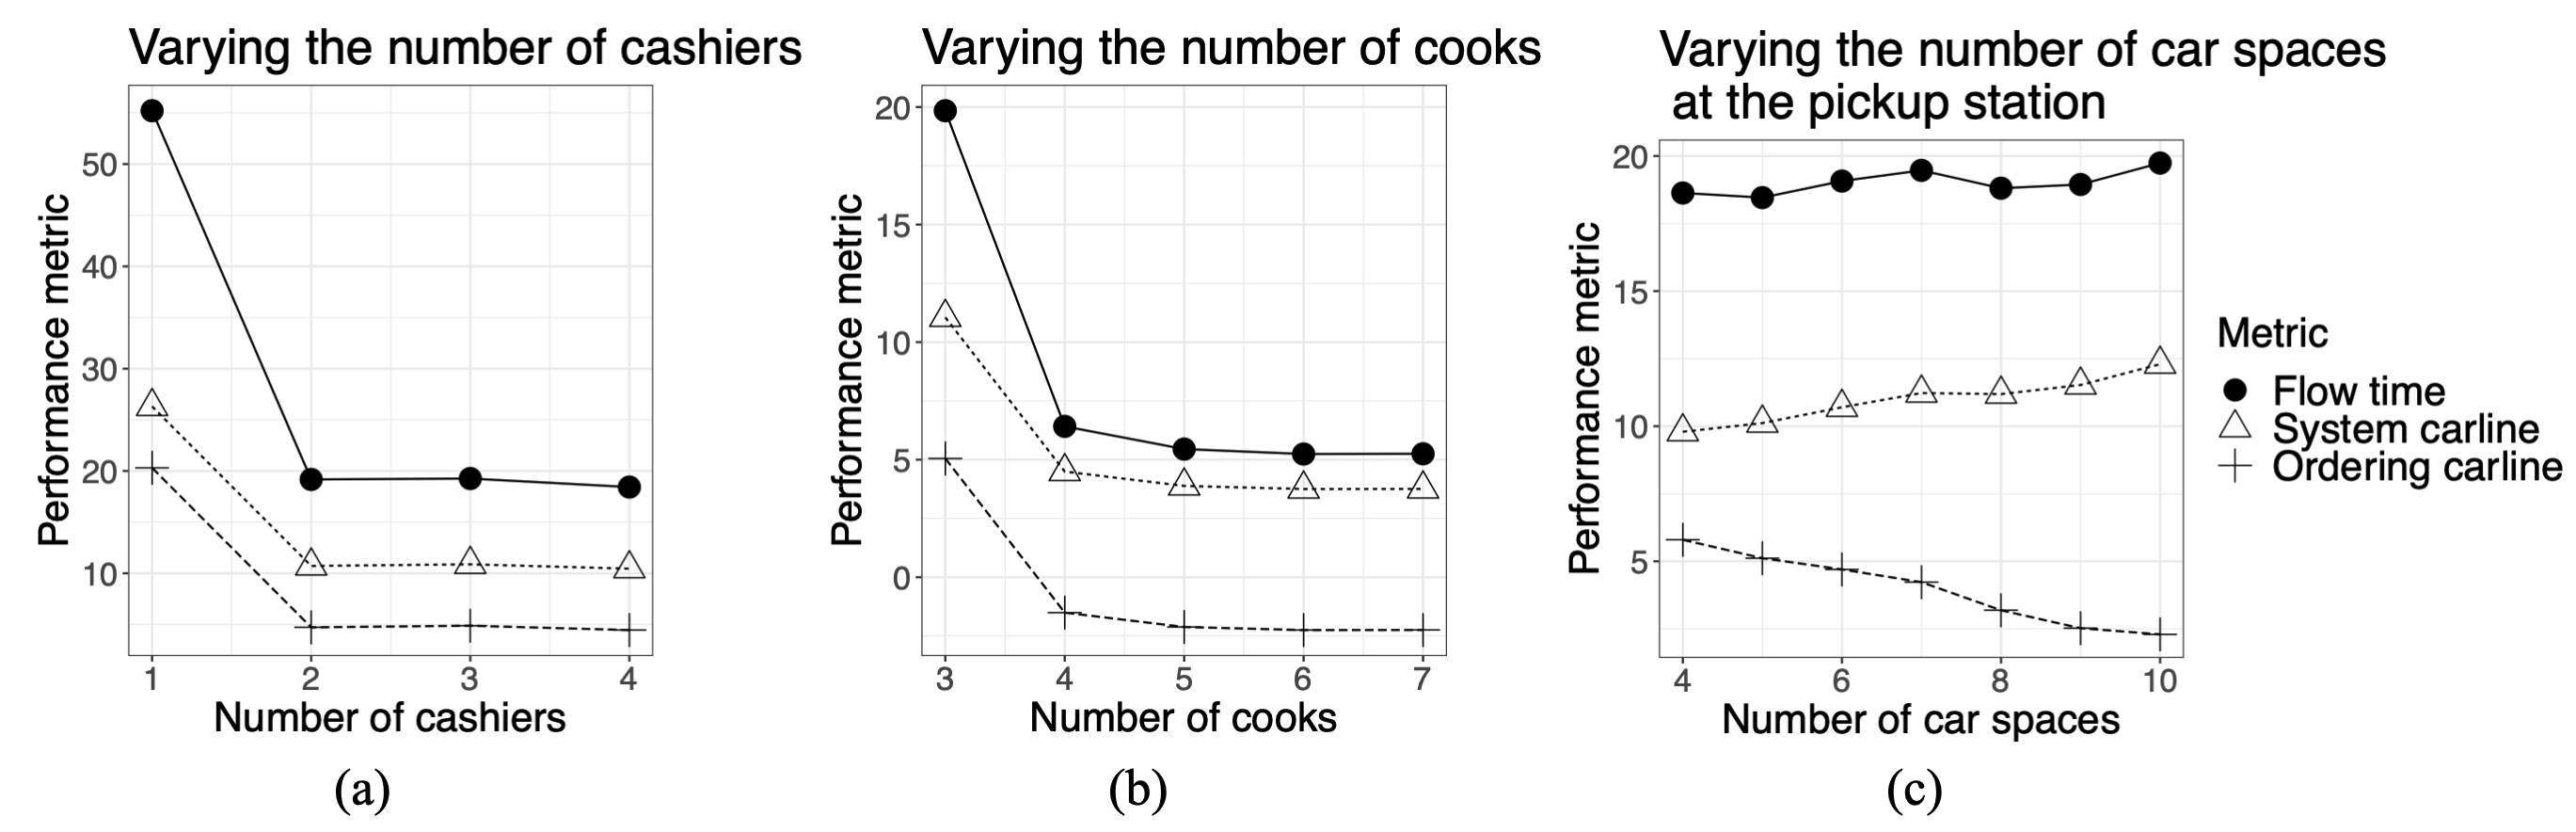
Figure 4.1: Bottleneck analysis
We summarize our findings as follows.
- The current staffing level at the ordering station is sufficient and should not be reduced. Increasing the number of cashiers from 2 does not improve the system performance, but reducing the number of cashier workers may significantly increase the congestion.
- The current number of cooks at the pickup station is insufficient, as one additional cook (i.e., staffing level raises from 3 to 4) could significantly reduce congestion measured by all three metrics. However, the benefit of employing more than 4 cooks is marginal.
- Increasing the car spaces in the pickup lane does not have a clear impact on the flow time but negatively affects the system carline.
- This observation regarding flow time is because the additional car spaces do not contribute to a quicker service at the drive-through.
- Moreover, as we increase the car spaces in the pickup lane, cars are more likely to move from the ordering station to the pickup station. Since there is only one pickup lane, a merge from two ordering lanes to a single pickup lane will typically result in a longer queue of cars.
- Finally, increasing the capacity of the pickup lane effectively shortens the queue at the ordering station, as cars have a higher chance of leaving the ordering station and moving to the pickup lane.
According to the above analysis, the worker who prepares the orders (i.e., cook) is the major bottleneck resource that causes customers’ long wait times and a long carline at the ordering station. Because the renovation of Chick-fil-A at the Marketplace Mall mainly redesigned the organization of the car spaces, it would have no impact on customers’ waiting time.
Nevertheless, additional car spaces at the pickup station reduce the ordering queue. Since the system carline combines the carlines at both the pickup and the ordering stations, the design of two pickup lanes successfully reduces the carline at the pickup station. Therefore, we observe a reduction in the system carline after renovation.