4 Validation
4.1 Leave-one-out cross validation
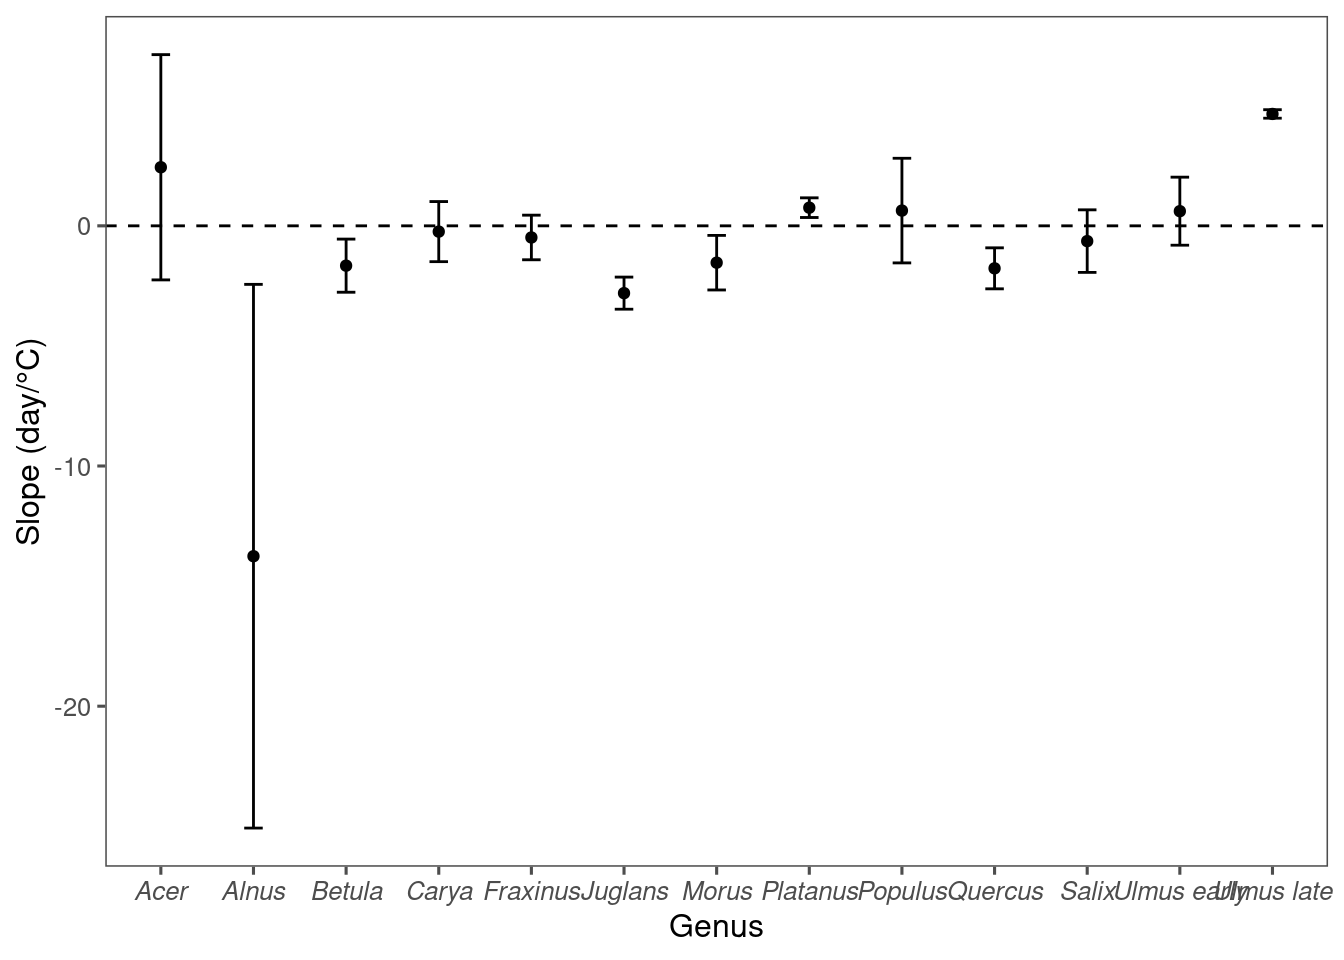
Plot correlation between mean annual temperature (MAT) and lag between green-up/down frequency and pollen count. * A positive lag means leafing phenology leads pollen phenology; a negative lag means leafing phenology lags pollen phenology.
 * At warmer places, oak pollen tend to percede 50% green-up and vice versa.
Linear regression to check significance of the correlation. When looking at individual taxa, only Quercus was statistically significant.
We conducted leave-one-out cross validation to test the robustness of the climate-phenology relationship and the effectiveness of using it to infer flowering phenology in new locations. Specifically, we removed a random city from the pollen dataset at a time, matched leafing and pollen phenology in the other cities, and modeled the climate-lag correlation. We predicted the leafing-phenology lag with the linear model and subsequently predicted the flowering phenology from known leafing phenology at the city held for validation. We evaluated the accuracy of our methods by calculating the RMSE between the predicted flowering phenology and standardized pollen count observations at the cities held for validation.
4.2 Benchmarking
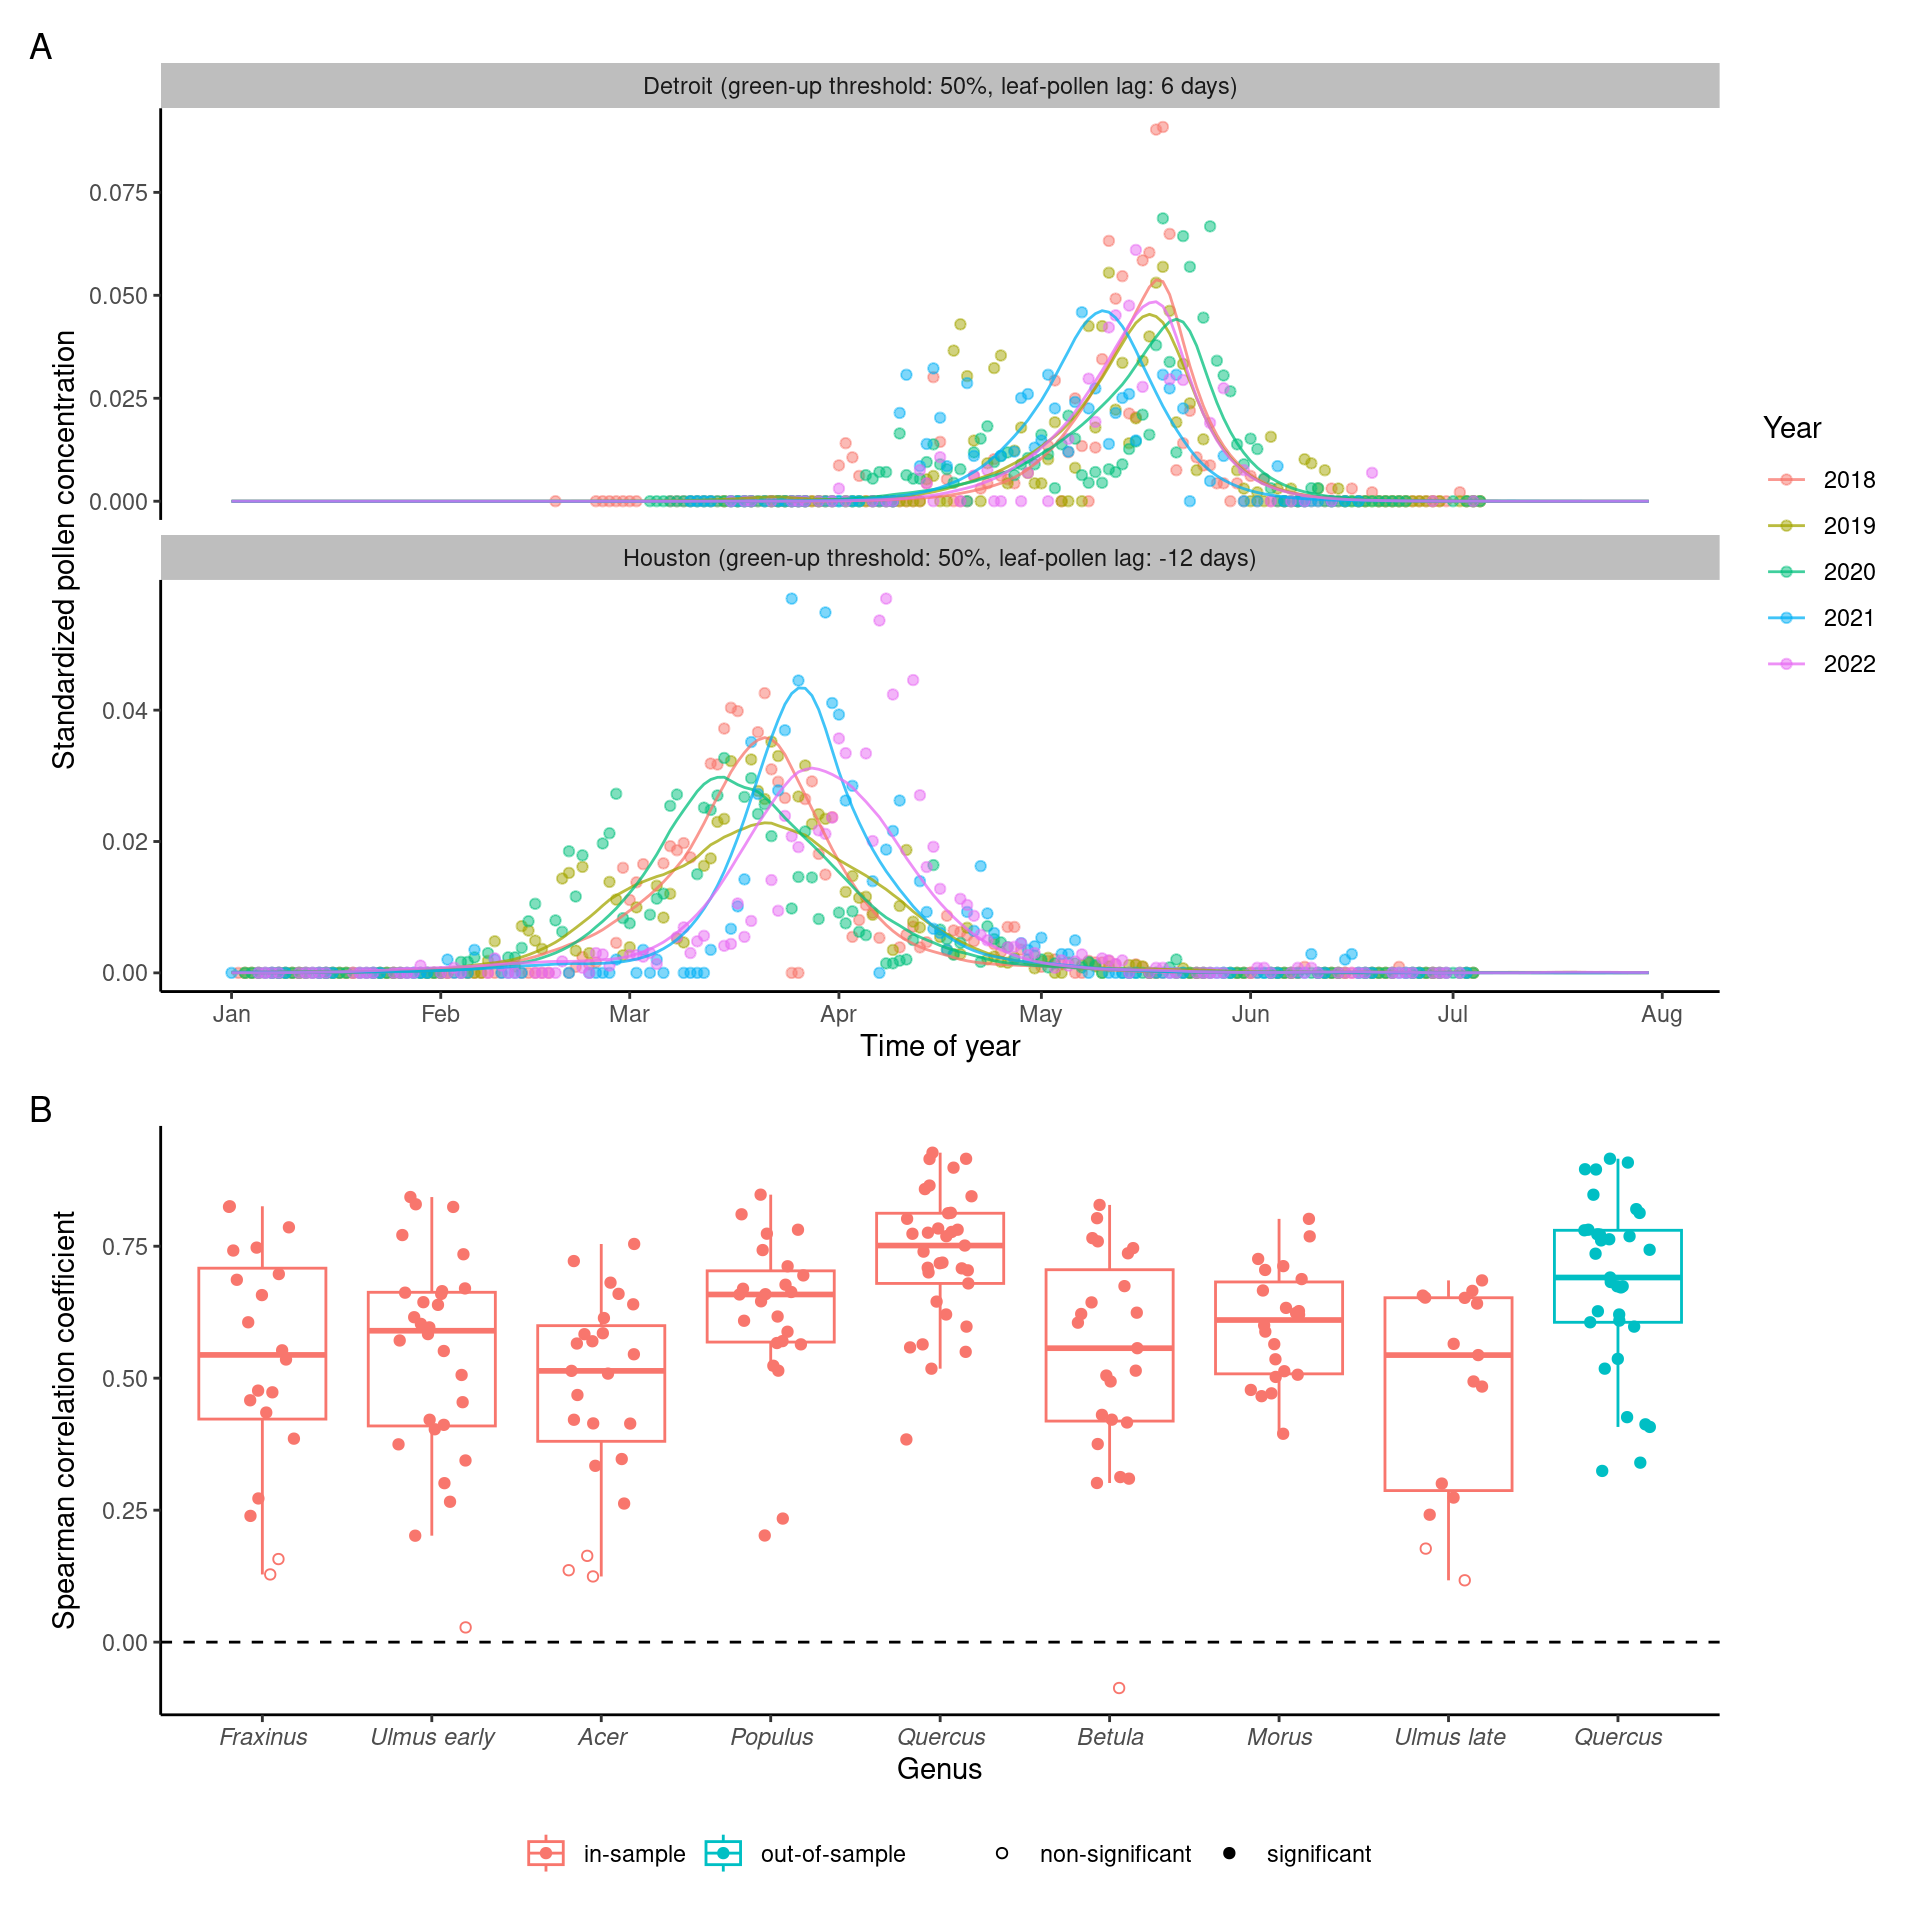
Predict pollen phenology with climatology (site-specific long-term mean), tested for accuracy only in-sample.
Predict pollen phenology with Gaussian methods, tested for accuracy in-sample and out-of-sample.
Read in validation results and visualize.
source("code/valid_fit.R")

df_fit_all %>%
  drop_na(nrmse) %>%
  group_by(method) %>%
  summarise(
    median = median(nrmse),
    mean = mean(nrmse),
    lower = quantile(nrmse, 0.025),
    upper = quantile(nrmse, 0.975),
    n = n()
  )
## # A tibble: 5 × 6
## method median mean lower upper n
## <fct> <dbl> <dbl> <dbl> <dbl> <int>
## 1 in-sample (Gaussian) 0.135 302790309. 0.0783 0.340 299
## 2 in-sample 0.142 0.159 0.0881 0.336 282
## 3 in-sample (climatology) 0.126 0.201 0.0549 0.941 299
## 4 out-of-sample (Gaussian) 0.156 0.185 0.111 0.416 33
## 5 out-of-sample 0.145 0.173 0.0982 0.360 33df_fit_all %>%
drop_na(nrmse) %>%
filter(method == "in-sample") %>%
group_by(taxa) %>%
summarise(
median = median(nrmse),
mean = mean(nrmse),
lower = quantile(nrmse, 0.025),
upper = quantile(nrmse, 0.975),
n = n()
) %>%
arrange(desc(median))## # A tibble: 15 × 6
## taxa median mean lower upper n
## <chr> <dbl> <dbl> <dbl> <dbl> <int>
## 1 Alnus 0.190 0.172 0.107 0.239 13
## 2 Acer 0.189 0.214 0.100 0.408 23
## 3 Ulmus early 0.172 0.203 0.111 0.435 28
## 4 Betula 0.157 0.154 0.0971 0.207 23
## 5 Salix 0.156 0.156 0.0947 0.242 19
## 6 Morus 0.144 0.148 0.0832 0.244 22
## 7 Platanus 0.142 0.147 0.0853 0.241 18
## 8 Populus 0.141 0.142 0.0972 0.215 23
## 9 Fraxinus 0.140 0.149 0.0912 0.248 20
## 10 Juglans 0.140 0.143 0.109 0.204 15
## 11 Ulmus late 0.136 0.148 0.110 0.204 15
## 12 Quercus 0.135 0.154 0.0967 0.321 33
## 13 Carya 0.130 0.135 0.104 0.174 15
## 14 Celtis 0.124 0.130 0.0993 0.184 10
## 15 Liquidambar 0.110 0.110 0.0868 0.127 5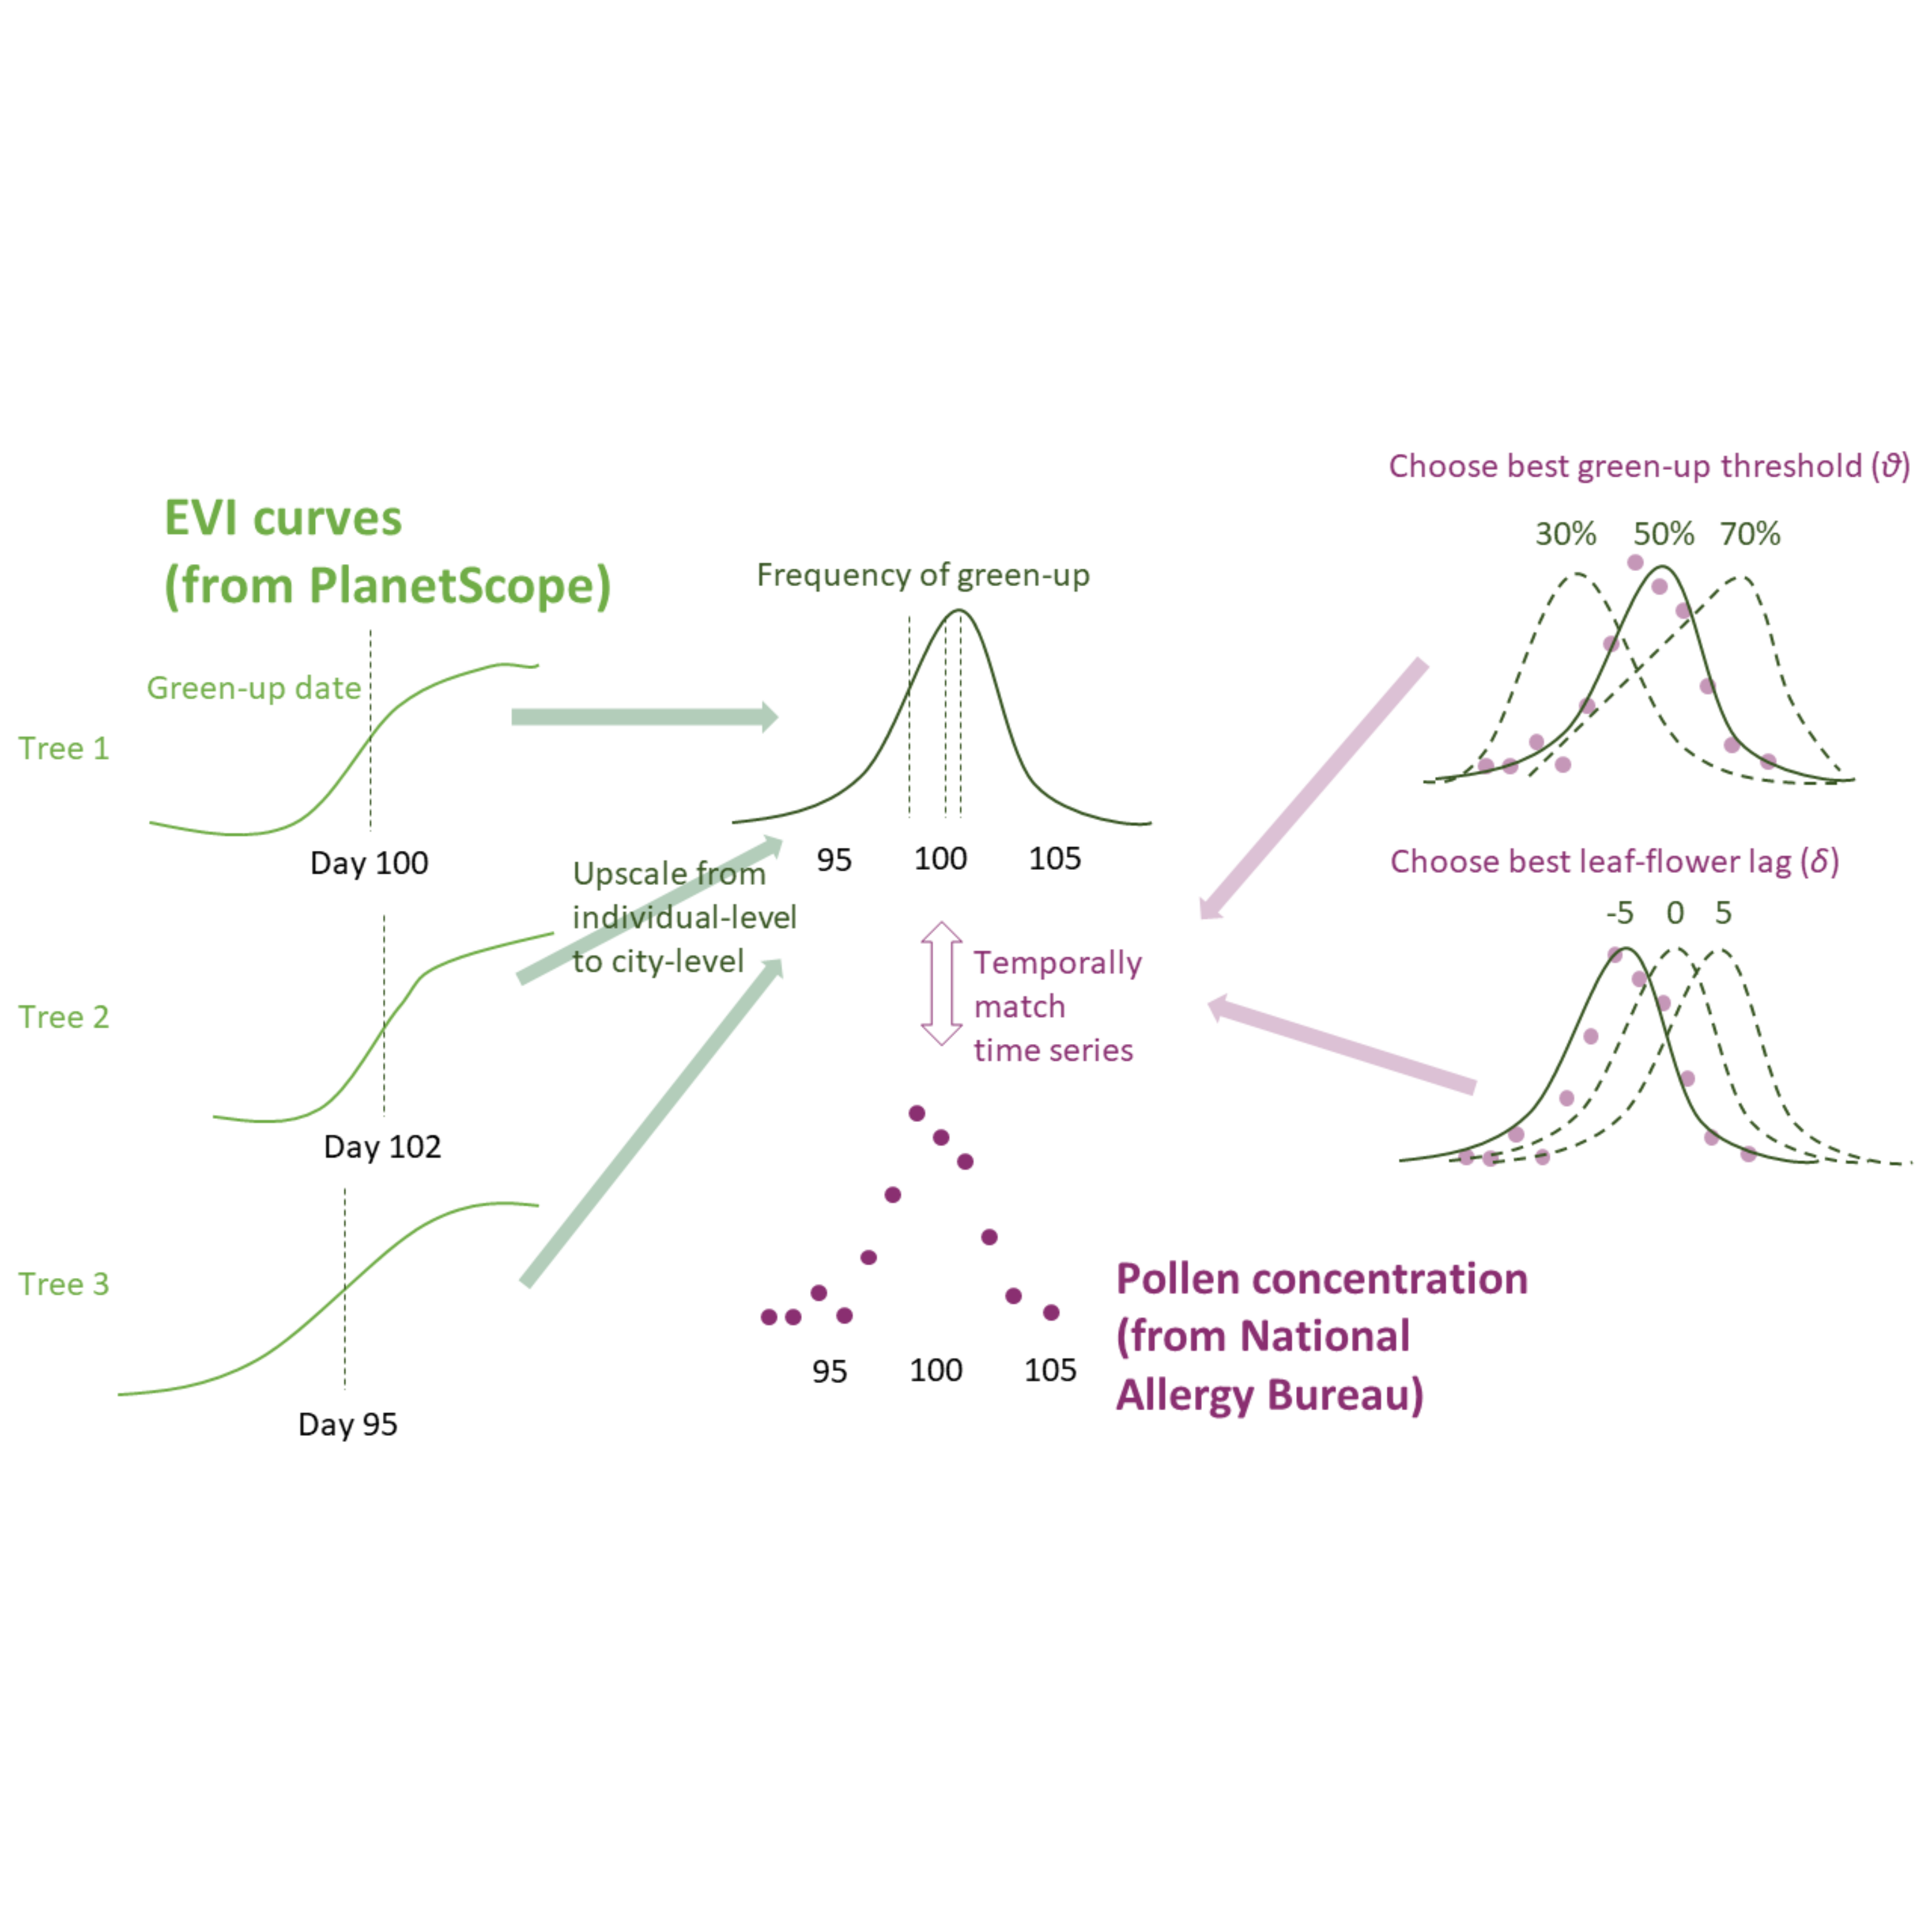
df_fit_all %>%
  drop_na(spearman) %>%
  group_by(method) %>%
  summarise(
    median = median(spearman),
    mean = mean(spearman),
    lower = quantile(spearman, 0.025),
    upper = quantile(spearman, 0.975),
    n = n()
  )
## # A tibble: 5 × 6
## method median mean lower upper n
## <fct> <dbl> <dbl> <dbl> <dbl> <int>
## 1 in-sample (Gaussian) 0.598 0.580 0.205 0.864 299
## 2 in-sample 0.567 0.544 0.125 0.845 282
## 3 in-sample (climatology) 0.669 0.645 0.250 0.981 299
## 4 out-of-sample (Gaussian) 0.755 0.702 0.346 0.910 33
## 5 out-of-sample 0.691 0.679 0.337 0.910 33df_fit_all %>%
drop_na(spearman) %>%
filter(method == "in-sample") %>%
group_by(taxa) %>%
summarise(
median = median(spearman),
mean = mean(spearman),
lower = quantile(spearman, 0.025),
upper = quantile(spearman, 0.975),
n = n()
) %>%
arrange(desc(median))## # A tibble: 15 × 6
## taxa median mean lower upper n
## <chr> <dbl> <dbl> <dbl> <dbl> <int>
## 1 Quercus 0.751 0.733 0.491 0.918 33
## 2 Populus 0.659 0.623 0.220 0.827 23
## 3 Morus 0.610 0.600 0.432 0.784 22
## 4 Celtis 0.599 0.580 0.280 0.761 10
## 5 Ulmus early 0.590 0.542 0.145 0.834 28
## 6 Carya 0.575 0.590 0.421 0.750 15
## 7 Betula 0.557 0.537 0.127 0.814 23
## 8 Fraxinus 0.544 0.534 0.142 0.825 20
## 9 Ulmus late 0.544 0.477 0.138 0.678 15
## 10 Liquidambar 0.542 0.492 0.241 0.627 5
## 11 Acer 0.514 0.479 0.131 0.736 23
## 12 Alnus 0.500 0.427 -0.0246 0.785 13
## 13 Salix 0.468 0.430 0.0784 0.708 19
## 14 Platanus 0.460 0.460 0.125 0.719 18
## 15 Juglans 0.454 0.423 0.260 0.531 15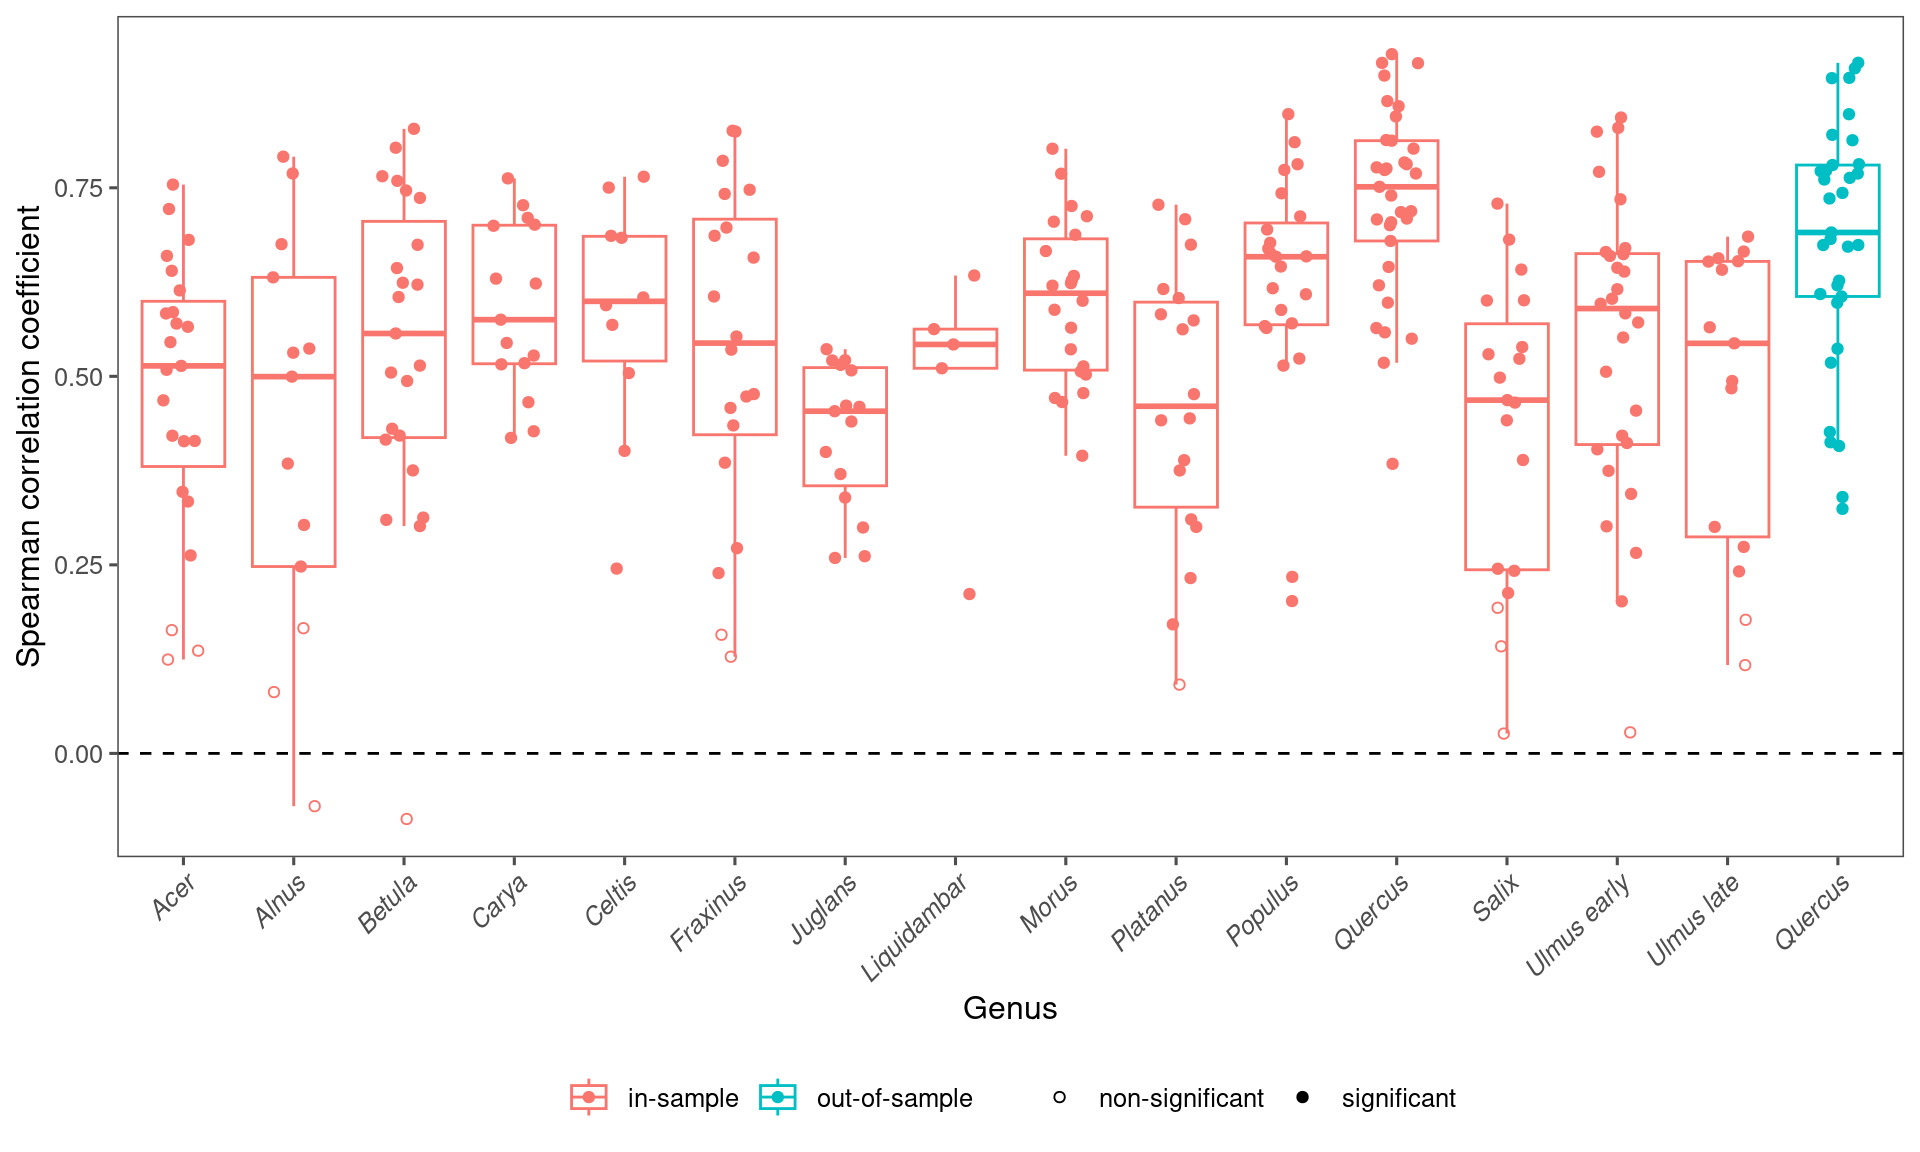
Validate with NPN instead of NAB and visualize.
df_fit_all %>%
  drop_na(spearman_npn) %>%
  group_by(method) %>%
  summarise(
    median = median(spearman_npn),
    mean = mean(spearman_npn),
    lower = quantile(spearman_npn, 0.025),
    upper = quantile(spearman_npn, 0.975),
    n = n()
  )
## # A tibble: 2 × 6
## method median mean lower upper n
## <fct> <dbl> <dbl> <dbl> <dbl> <int>
## 1 in-sample 0.479 0.398 -0.297 0.795 130
## 2 out-of-sample 0.470 0.476 0.0214 0.788 27df_fit_all %>%
drop_na(spearman_npn) %>%
filter(method == "in-sample") %>%
group_by(taxa) %>%
summarise(
median = median(spearman_npn),
mean = mean(spearman_npn),
lower = quantile(spearman_npn, 0.025),
upper = quantile(spearman_npn, 0.975),
n = n()
) %>%
arrange(desc(median))## # A tibble: 12 × 6
## taxa median mean lower upper n
## <chr> <dbl> <dbl> <dbl> <dbl> <int>
## 1 Acer 0.583 0.515 -0.0364 0.809 20
## 2 Juglans 0.576 0.524 0.195 0.671 6
## 3 Carya 0.556 0.319 -0.291 0.714 10
## 4 Quercus 0.542 0.503 0.0000180 0.820 27
## 5 Betula 0.515 0.367 -0.305 0.759 14
## 6 Celtis 0.444 0.444 0.306 0.582 2
## 7 Populus 0.387 0.415 0.156 0.677 14
## 8 Ulmus early 0.368 0.249 -0.601 0.790 18
## 9 Alnus 0.352 0.398 0.300 0.576 4
## 10 Platanus 0.276 0.207 -0.232 0.489 8
## 11 Fraxinus 0.246 0.232 -0.0995 0.550 3
## 12 Salix 0.242 0.300 0.0371 0.664 4