1 Data
1.1 Climate data
## # A tibble: 8 × 4
##   site    mat   tap   vpd
##   <chr> <dbl> <dbl> <dbl>
## 1 SJ    14.6   650.  971
## 2 DV     8.05  432. 1131.
## 3 AT    19.8   931. 1810.
## 4 ST    10.7  1118.  839.
## 5 NY    12.2  1216. 1319.
## 6 DT    10.3   984. 1211.
## 7 TP    22.1  1355. 1365
## 8 HT    20.4  1343. 1525.
Climatologies.
## # A tibble: 7 × 3
##   site    mat   tap
##   <chr> <dbl> <dbl>
## 1 AT    19.4   842.
## 2 DV     9.25  424
## 3 ST    10.9  1011
## 4 HT    21.3  1249.
## 5 NY    12.3  1198.
## 6 DT    10.2   869.
## 7 TP    22.6  1298
Annual summaries.
## # A tibble: 35 × 4
##    site    mat   tap  year
##    <chr> <dbl> <dbl> <int>
##  1 AT    20.0   882   2018
##  2 DV     9.92  364.  2018
##  3 ST    11.5   955.  2018
##  4 HT    22.0  1281.  2018
##  5 NY    13.1  1720.  2018
##  6 DT    10.8  1063.  2018
##  7 TP    23.4  1579.  2018
##  8 AT    20.1   783.  2019
##  9 DV     9.61  342.  2019
## 10 ST    11.6   812.  2019
## # ℹ 25 more rows
1.2 NAB data
Read in data using tidynab package.
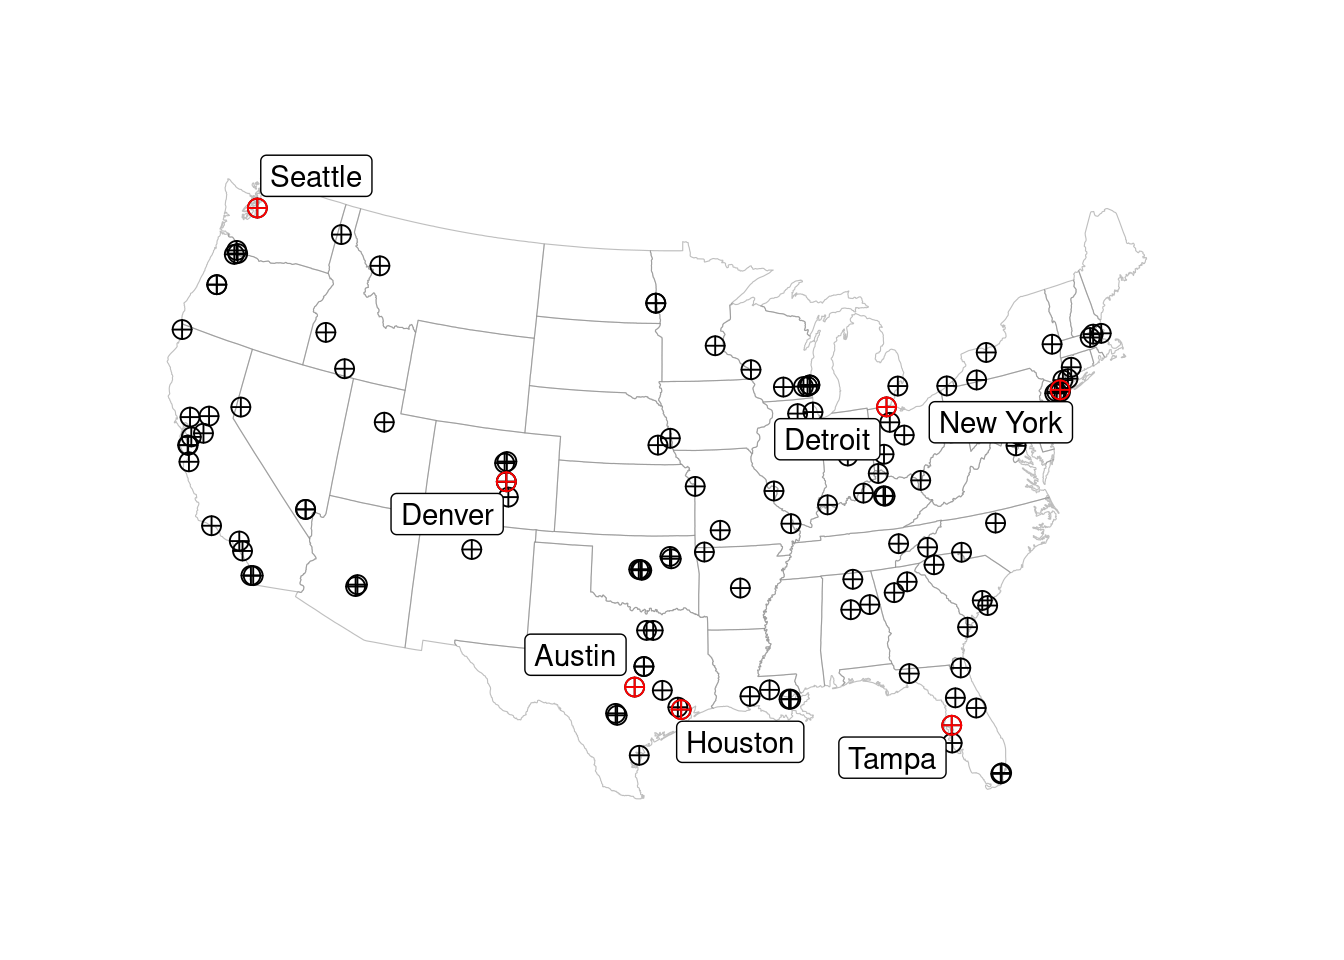
Focus on seven cities. * Exceptions: Denver pollen data are from Colorado Springs; Austin pollen data are from Georgetown; Detroit pollen data are from Sylvania.
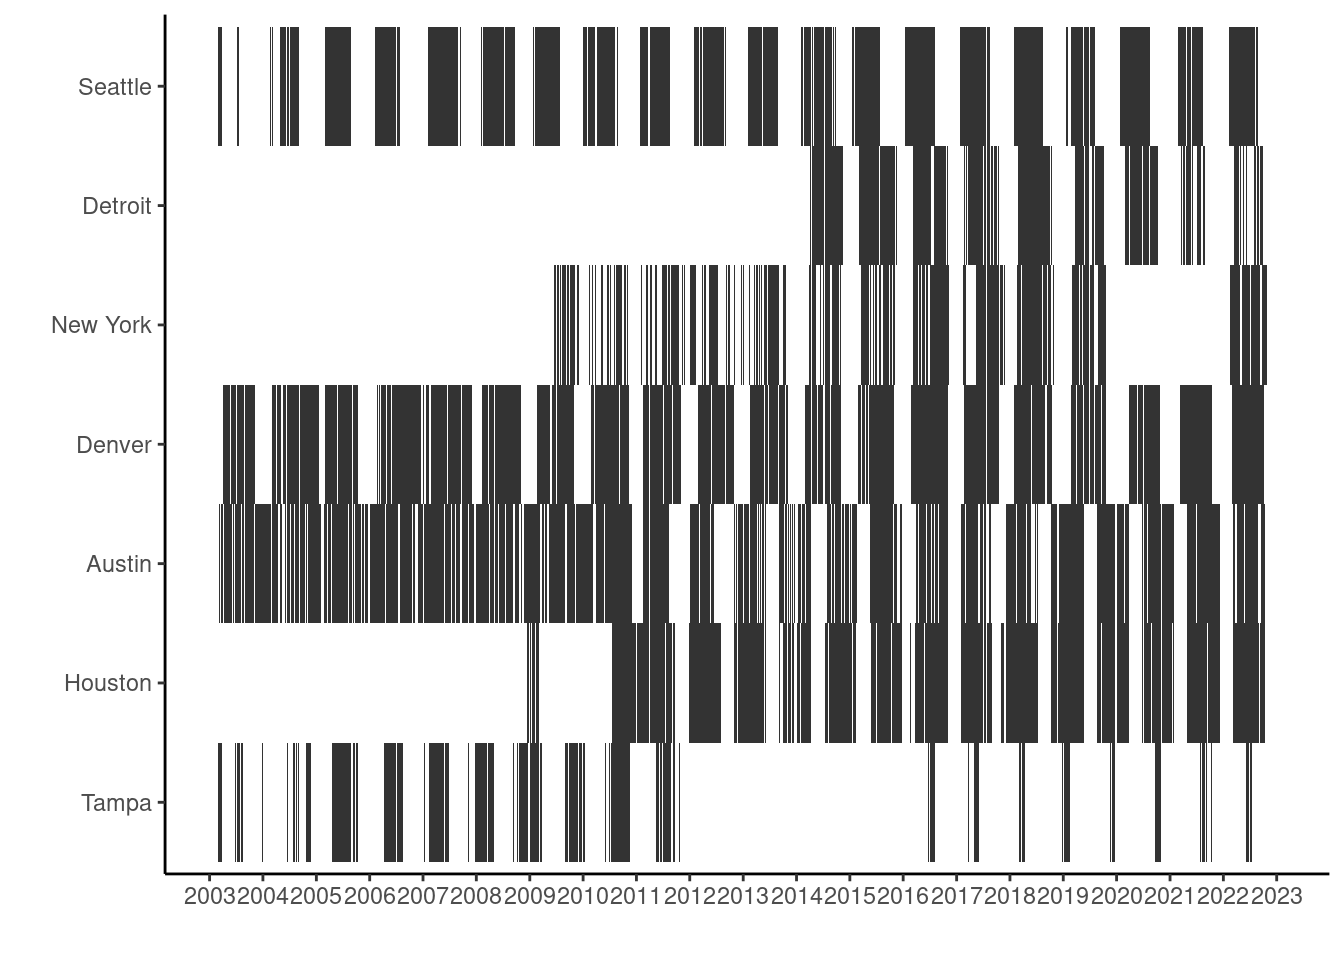
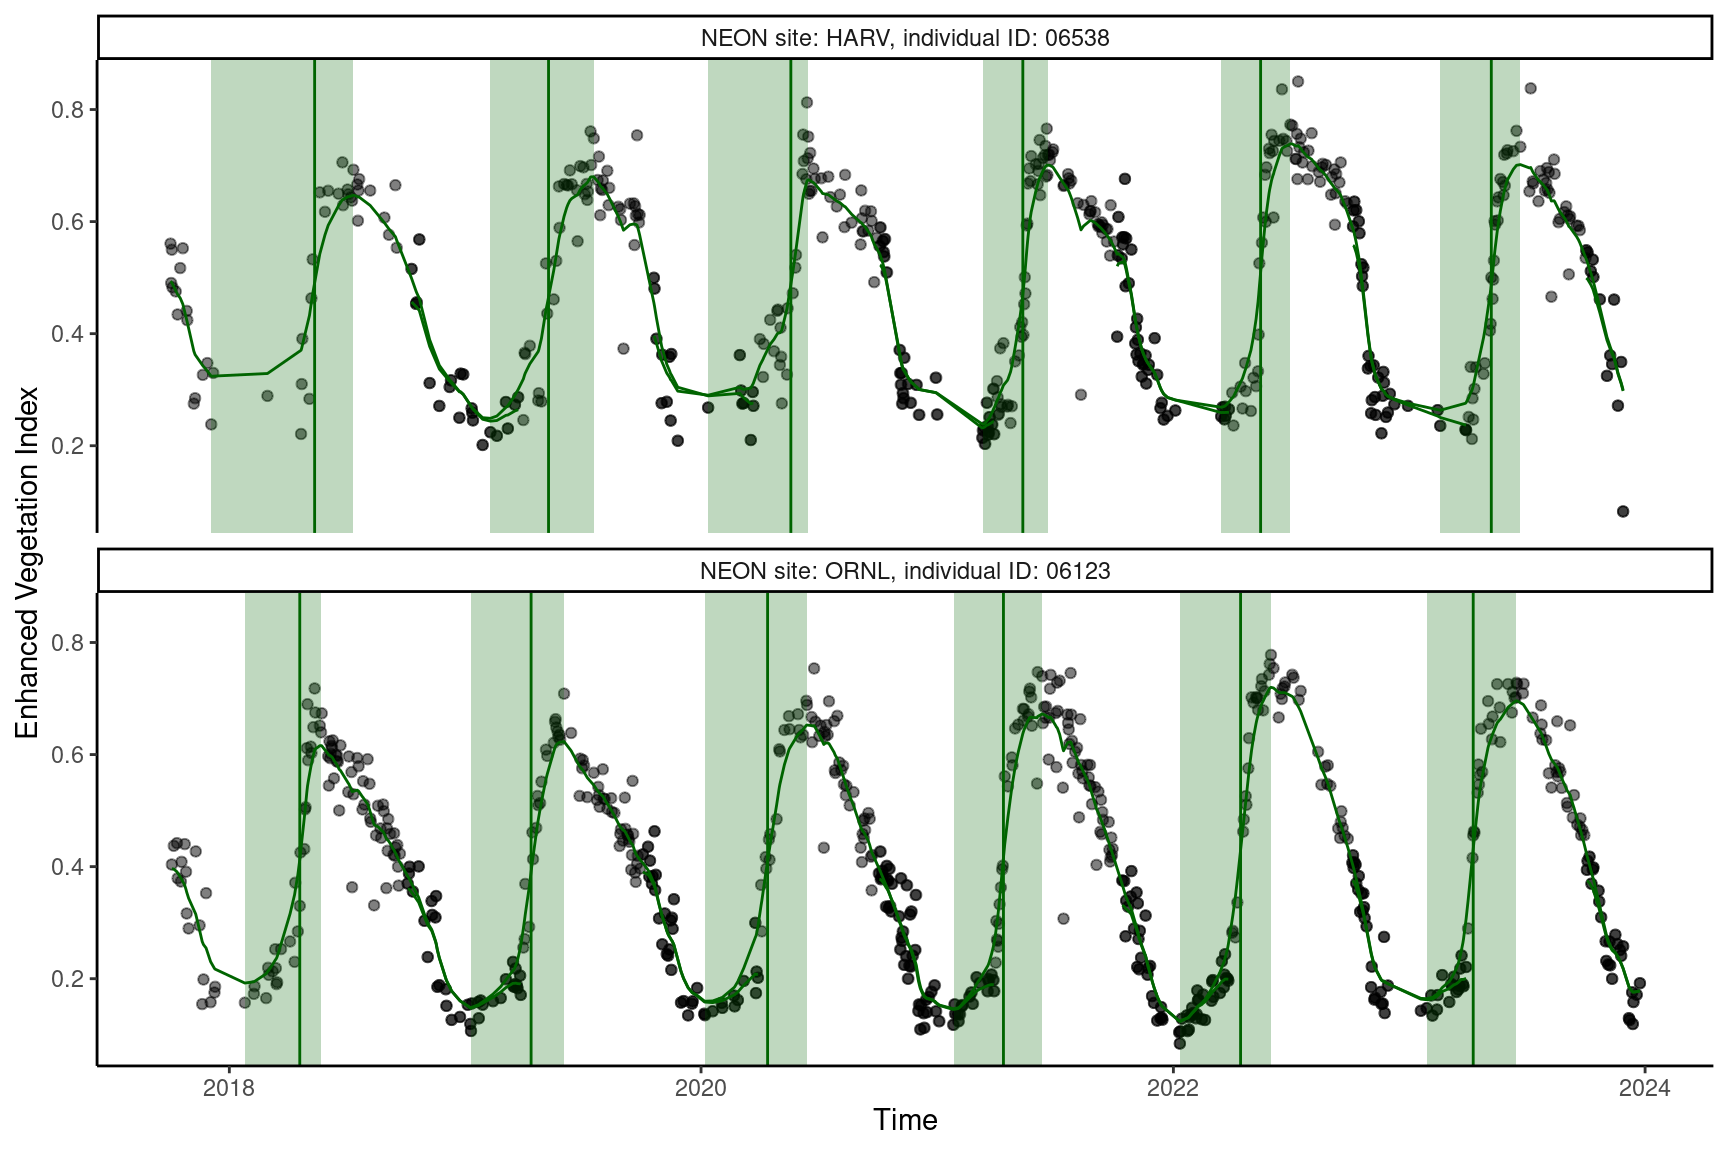
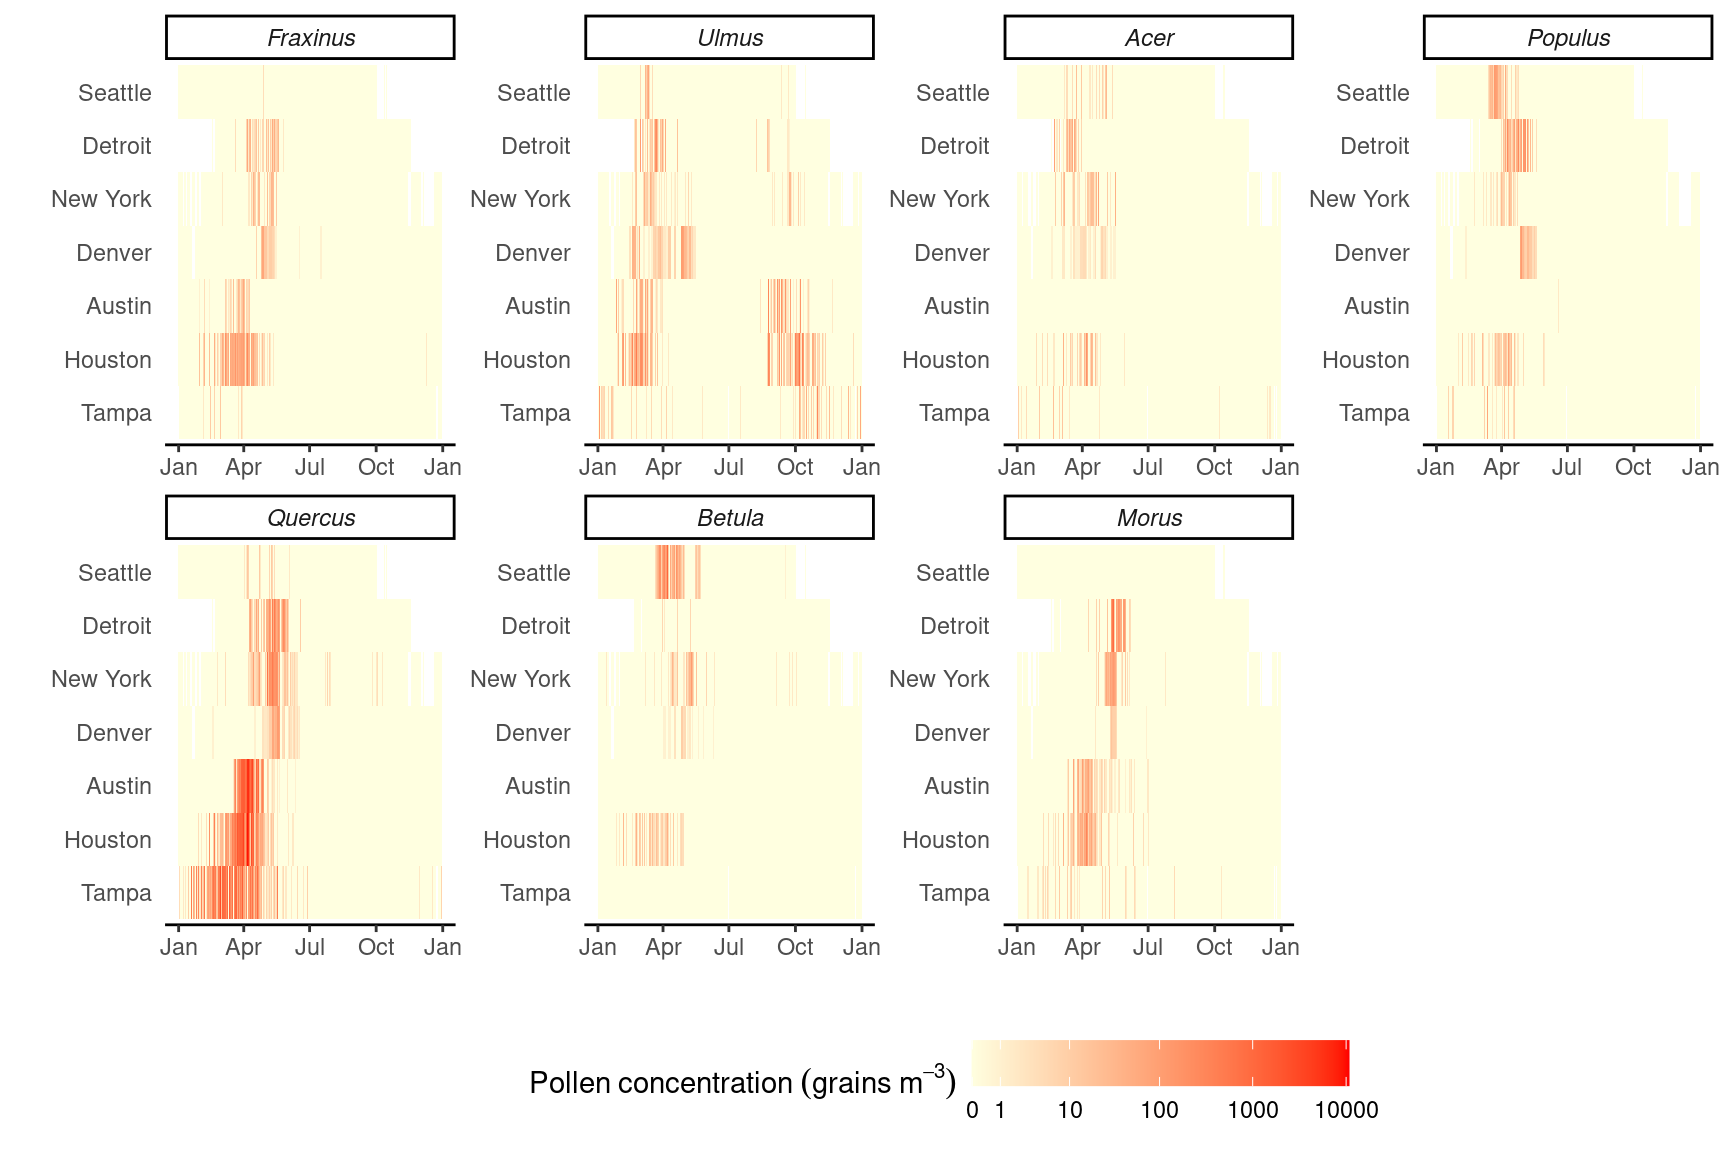
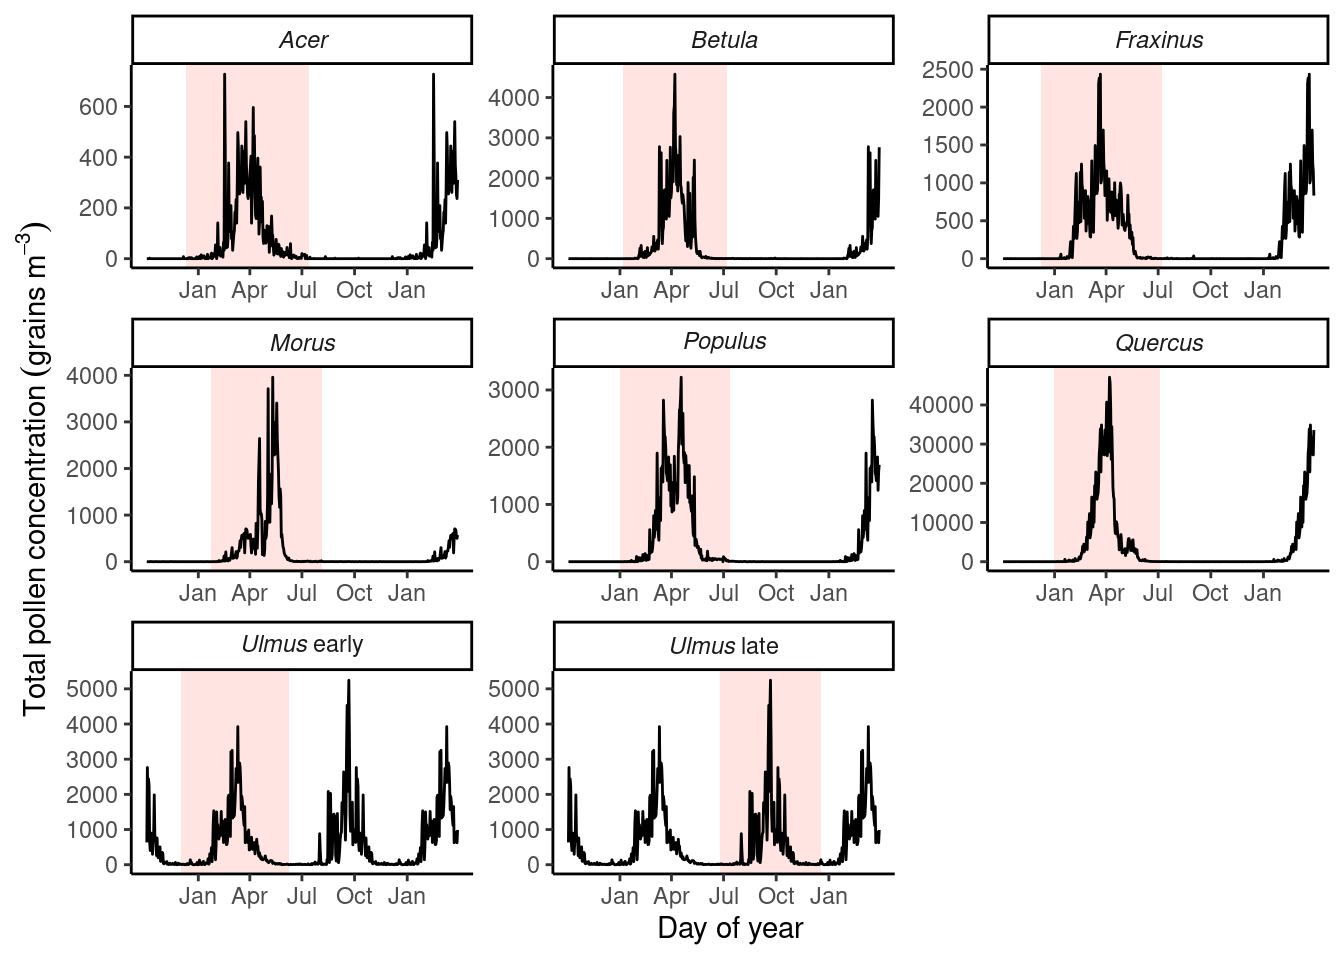
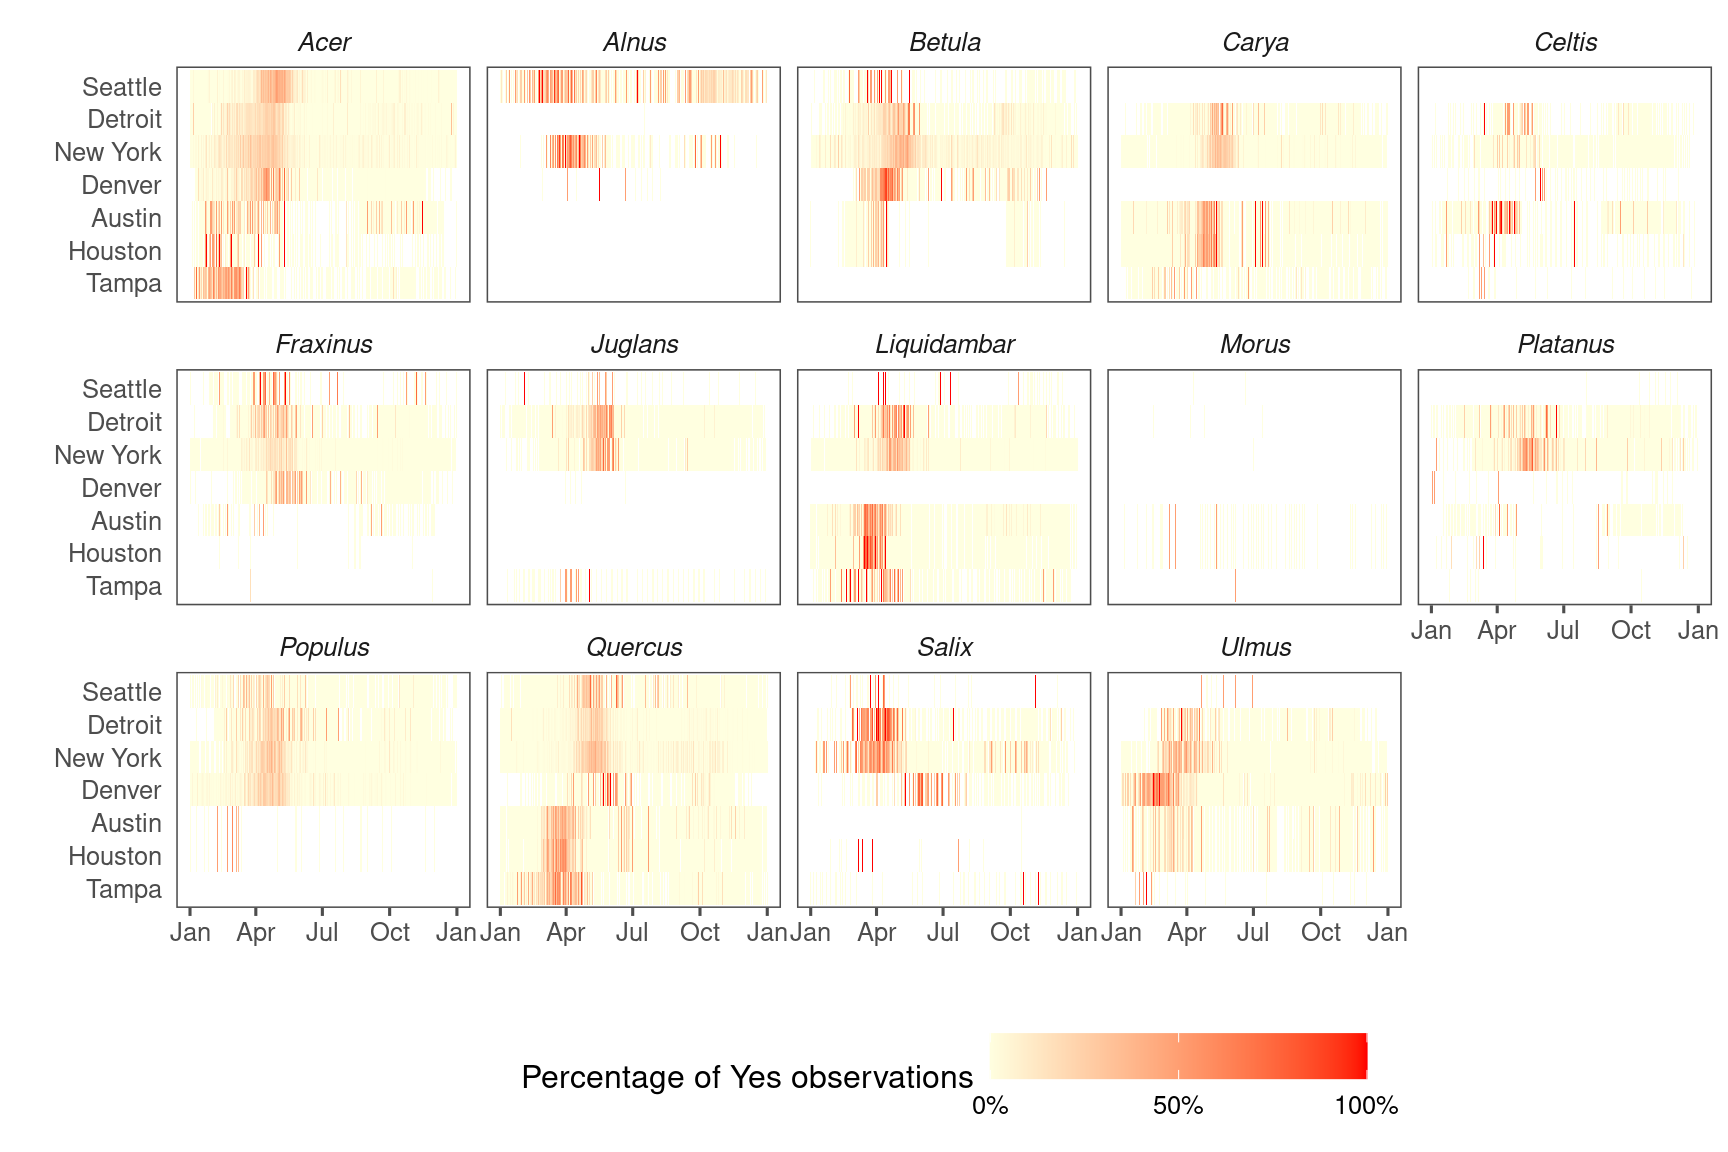
View pollen phenology in study sites.
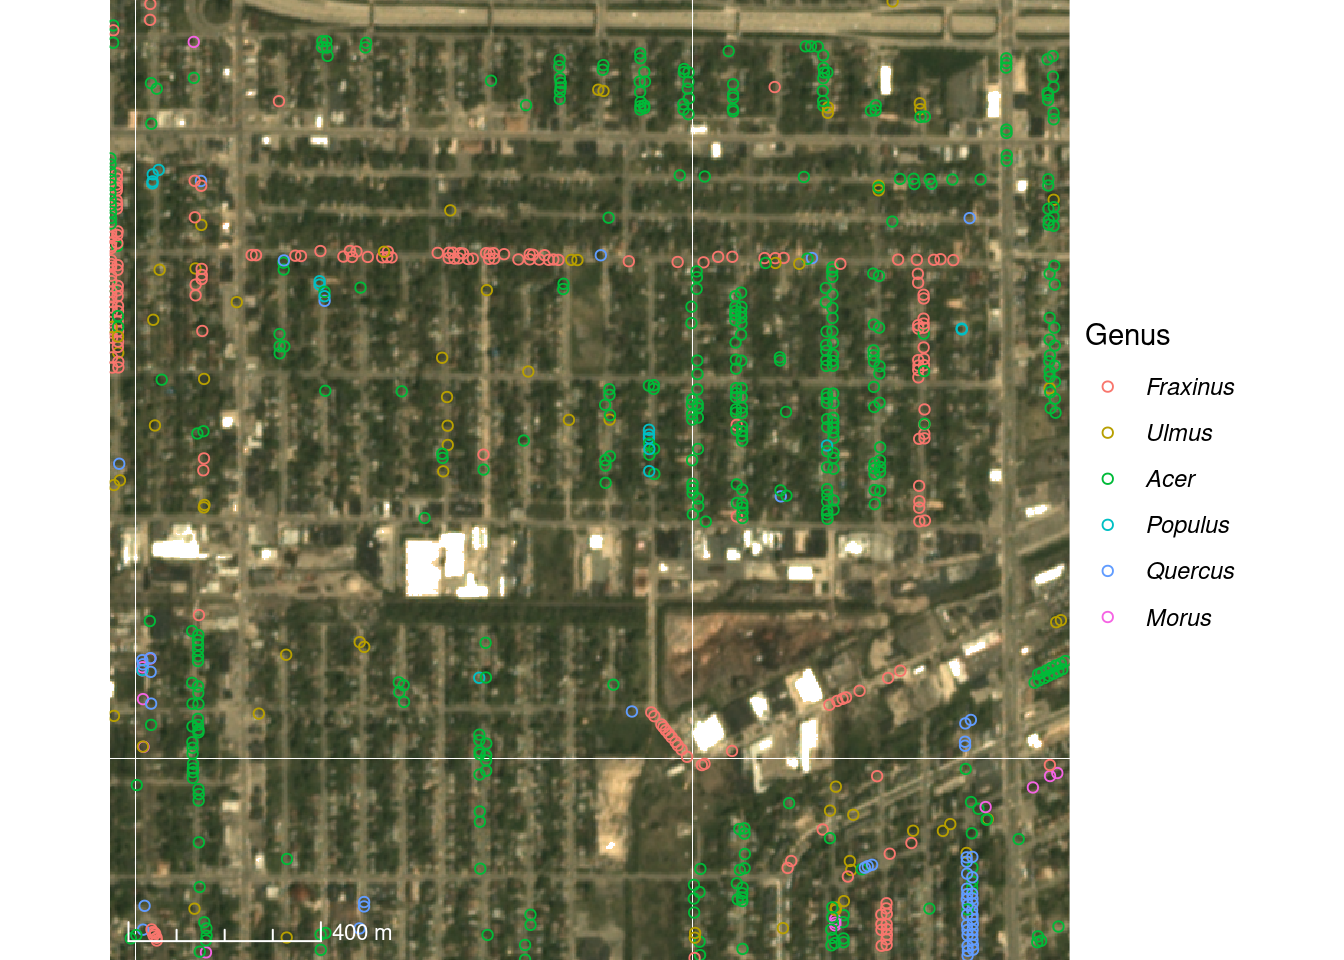
1.4 Plant location data
Read in data previously processed with batchplanet package.
Find family names from genus names. This step needs supervision.
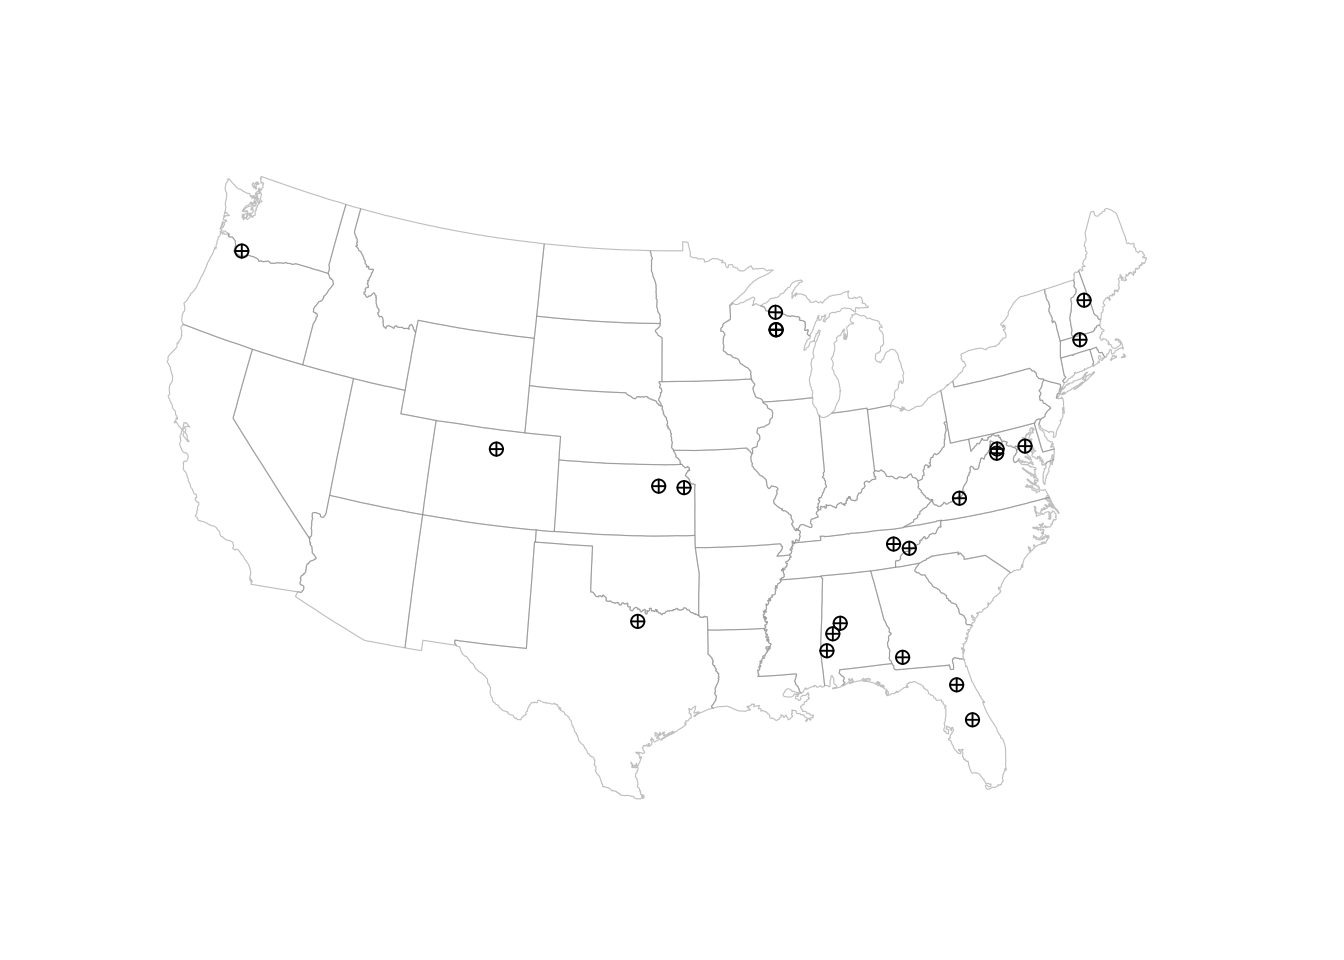
Map relative position of tree inventory and nab station.
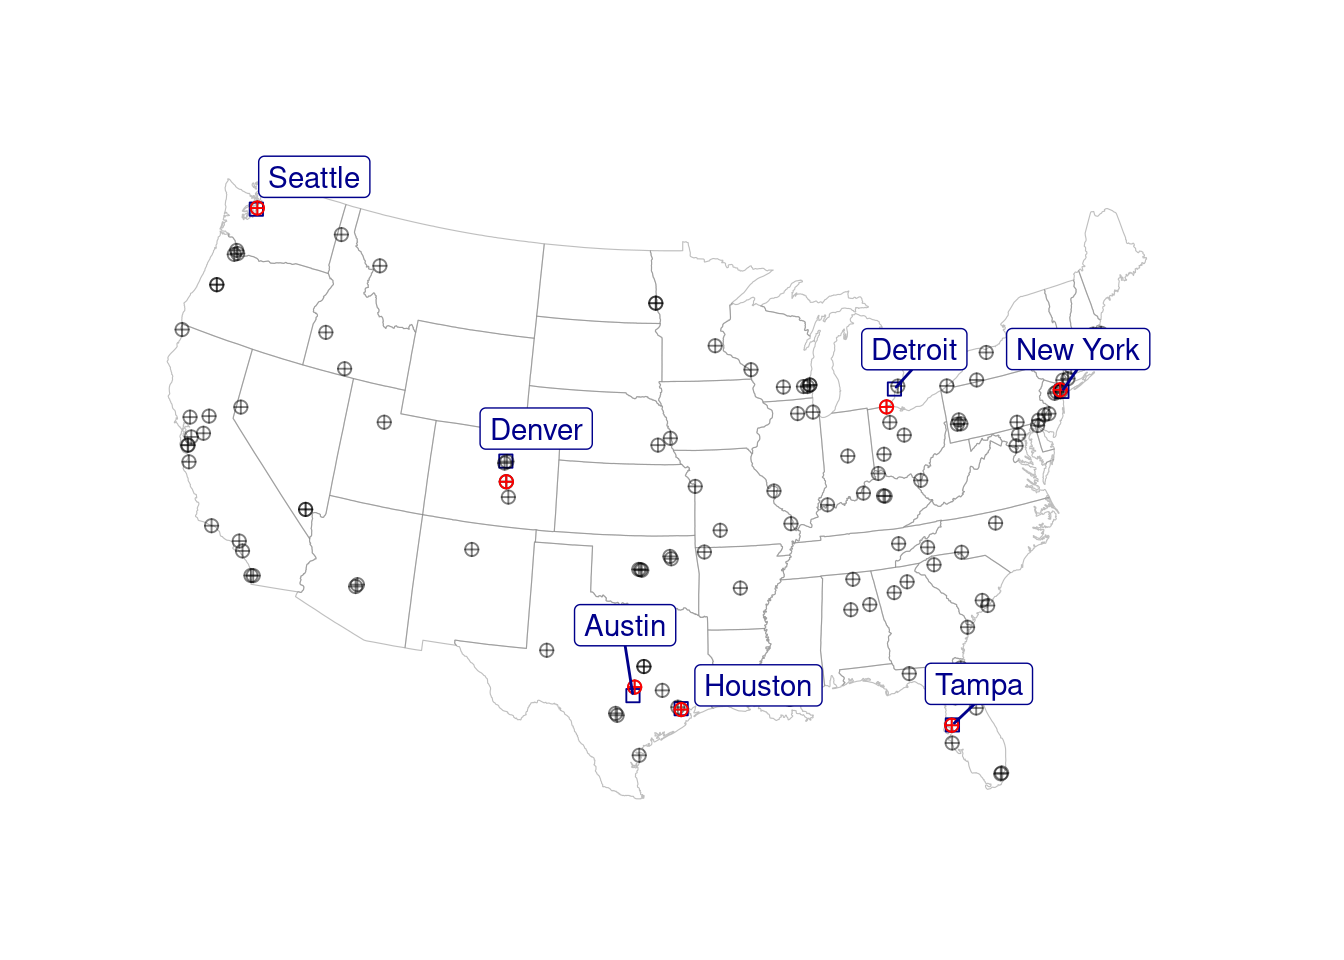
Calculate distance from plants to NAB stations in the unit of km.
## # A tibble: 1 × 7
##   site  midlon midlat sitelon sitelat sitename distance
##   <chr>  <dbl>  <dbl>   <dbl>   <dbl> <fct>       <dbl>
## 1 NY     -73.9   40.7   -74.0    40.8 New York     11.1
Prepare street map as basemap. Street shapefiles for major cities manually downloaded from https://dataverse.harvard.edu/dataset.xhtml?persistentId=doi:10.7910/DVN/CUWWYJ. Boeing, Geoff, 2017, “U.S. Street Network Shapefiles, Node/Edge Lists, and GraphML Files”, https://doi.org/10.7910/DVN/CUWWYJ, Harvard Dataverse, V2
Map plant occurrence in a city.