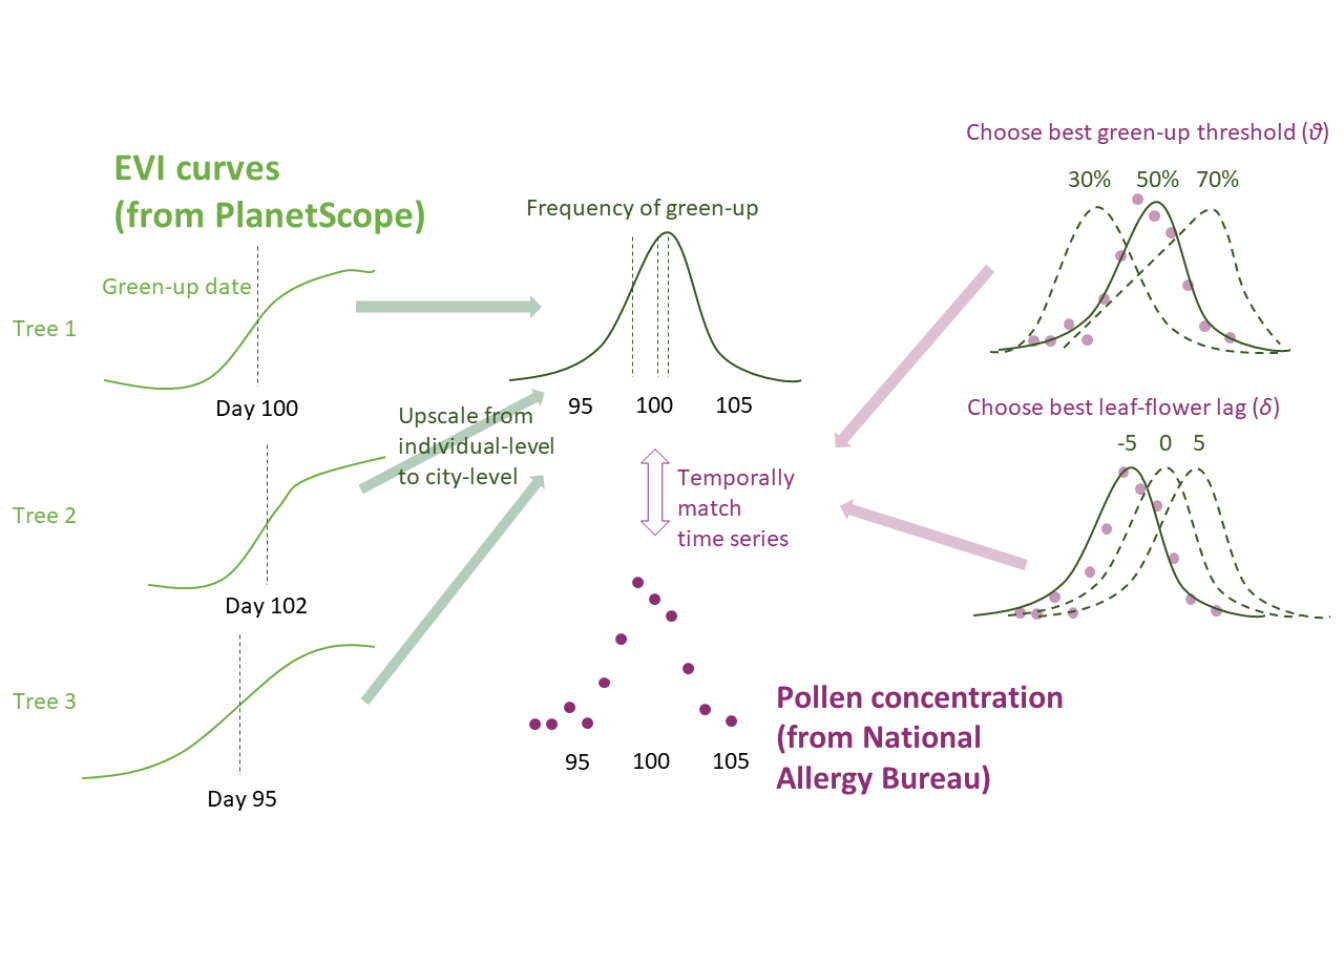
Conceptual figure.
Characterize leafing phenology for all taxa and cities
Set green-up/down thresholds for each taxa.
source("code/city_prep.R")
Read in green-up down day of year previously processed using the batchplanet package.
source("code/city_doy.R")
Convert into probability density.
source("code/city_freq.R")
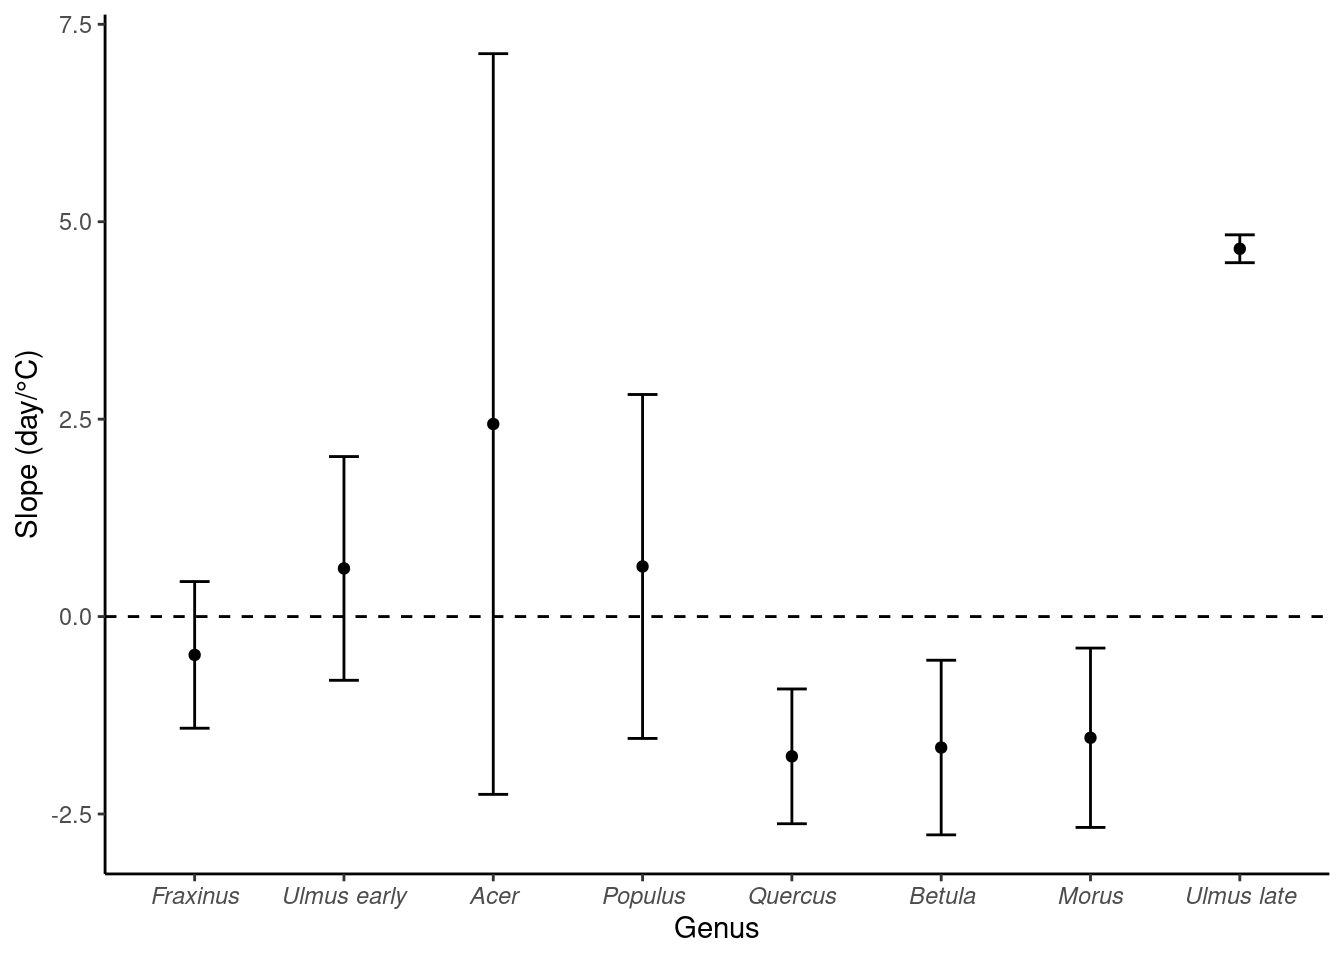
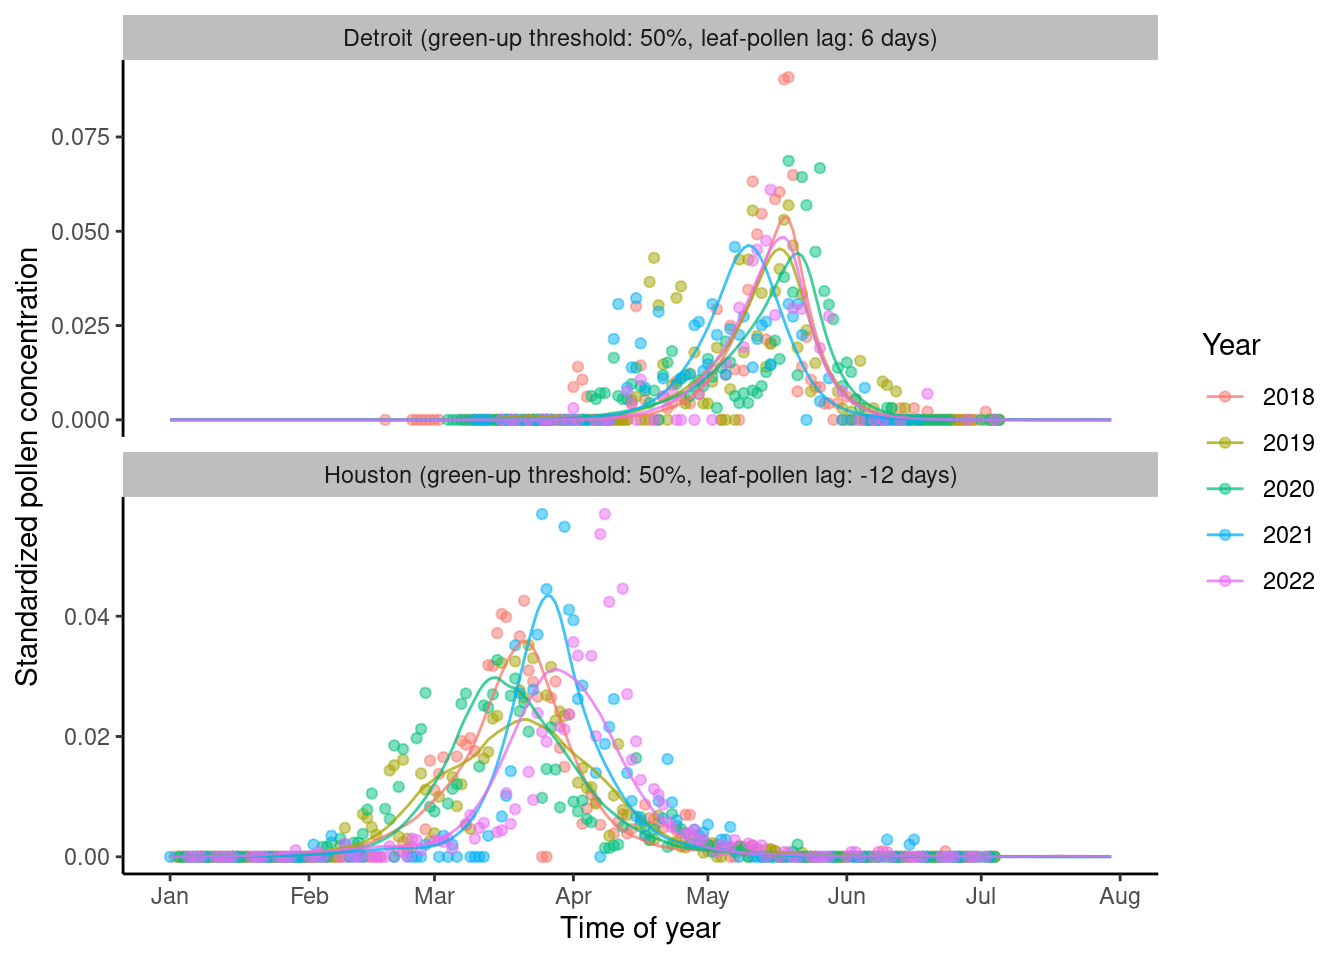
Results
Prepare for Shiny app by copying result figures to the current folder. Shiny app code is in ./shinyapp/app.R. Needs to deploy app once every time results are changed.
source("code/city_shiny.R")
Display results in a Shiny app.
knitr::include_app("https://yiluansong.shinyapps.io/RS4flower_result/", height = "600px")
source("code/city_plot_subset.R")
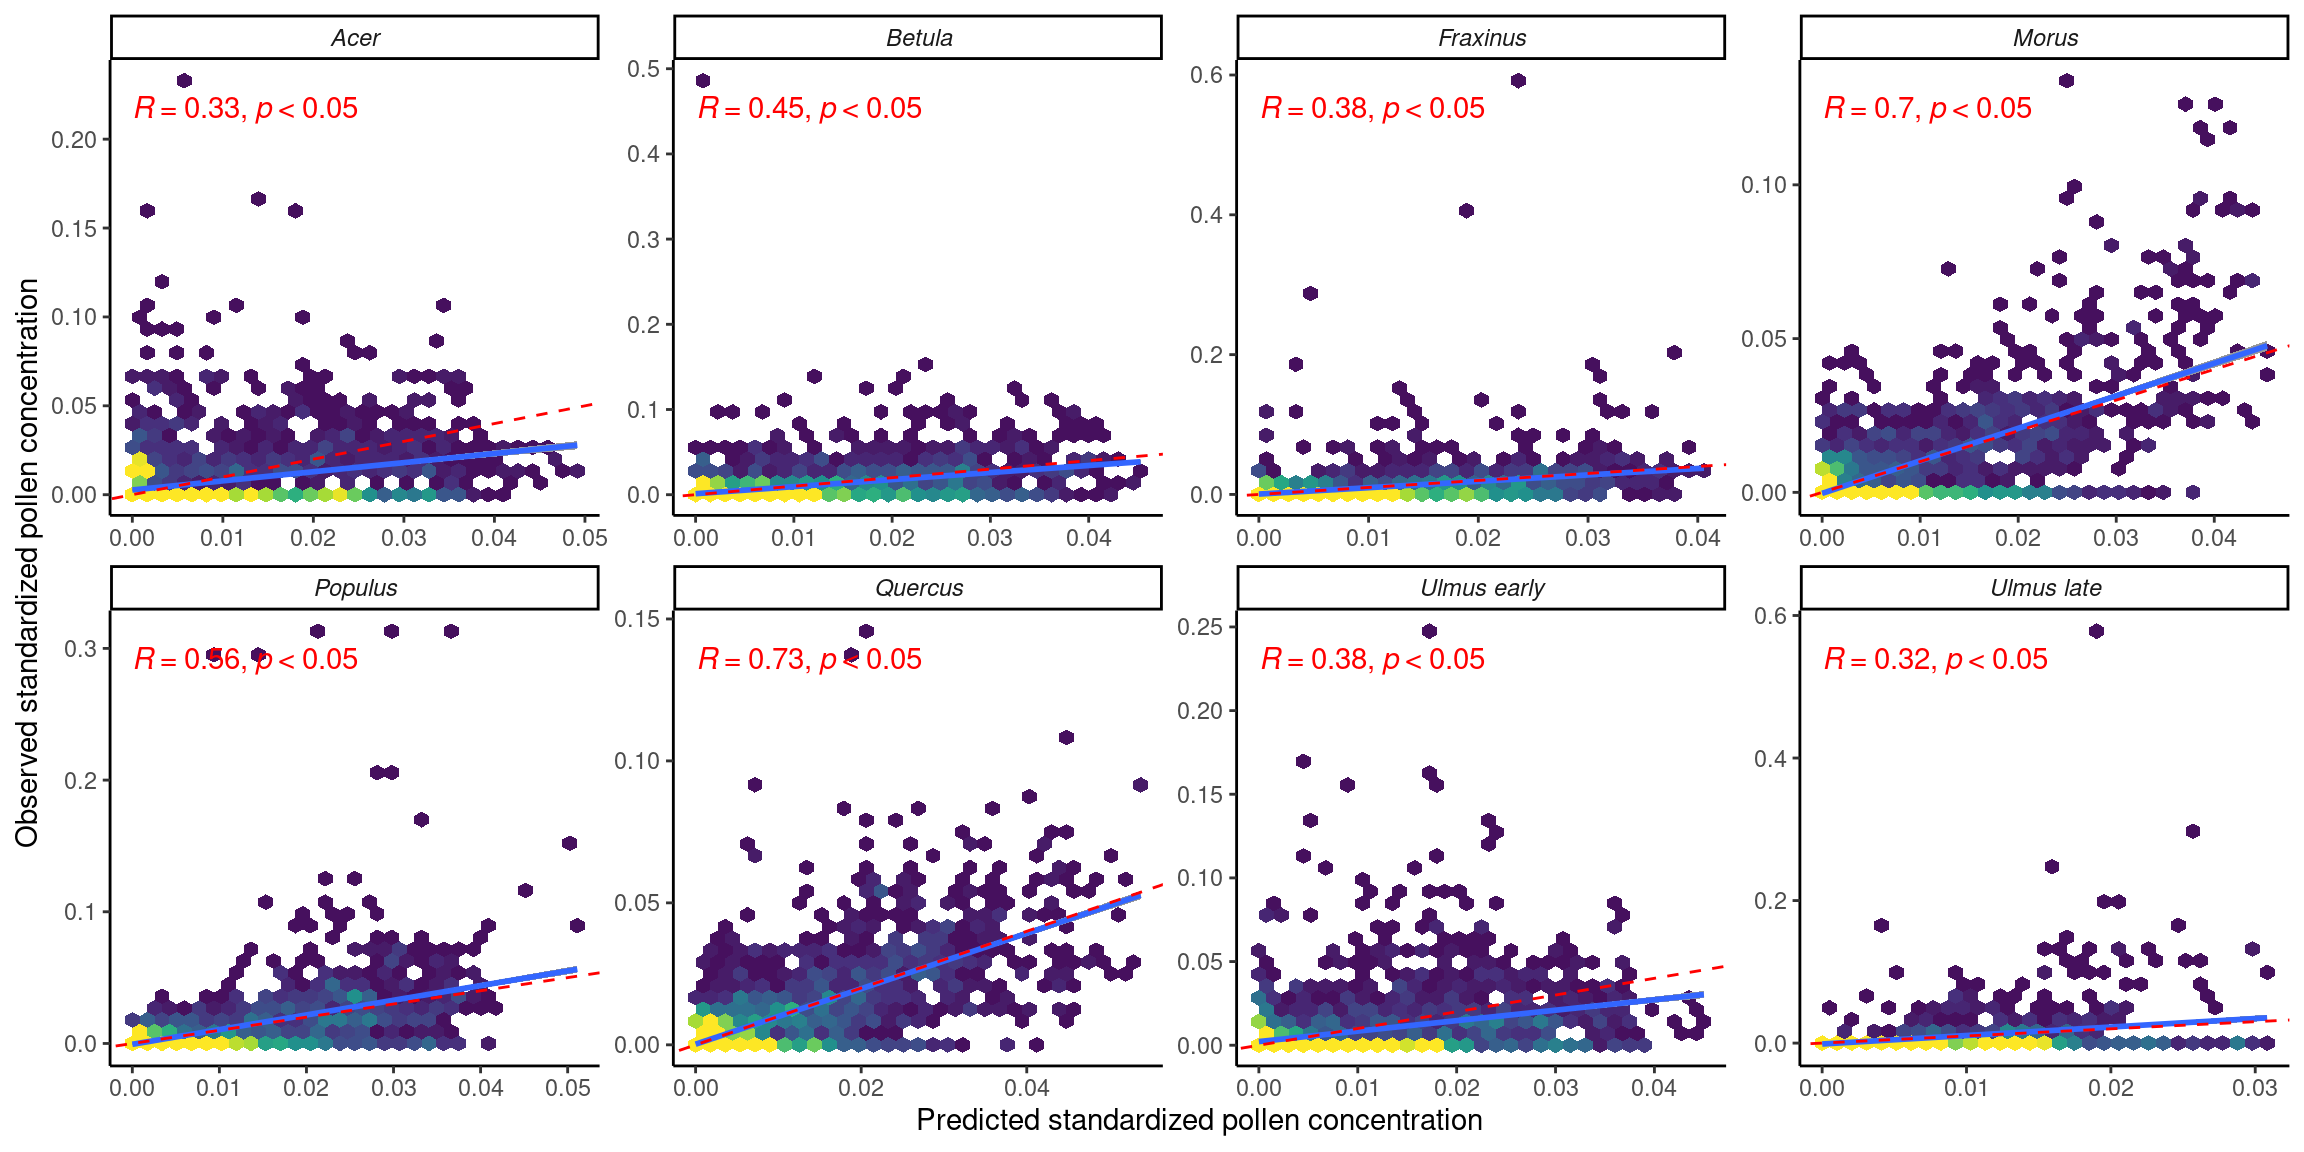


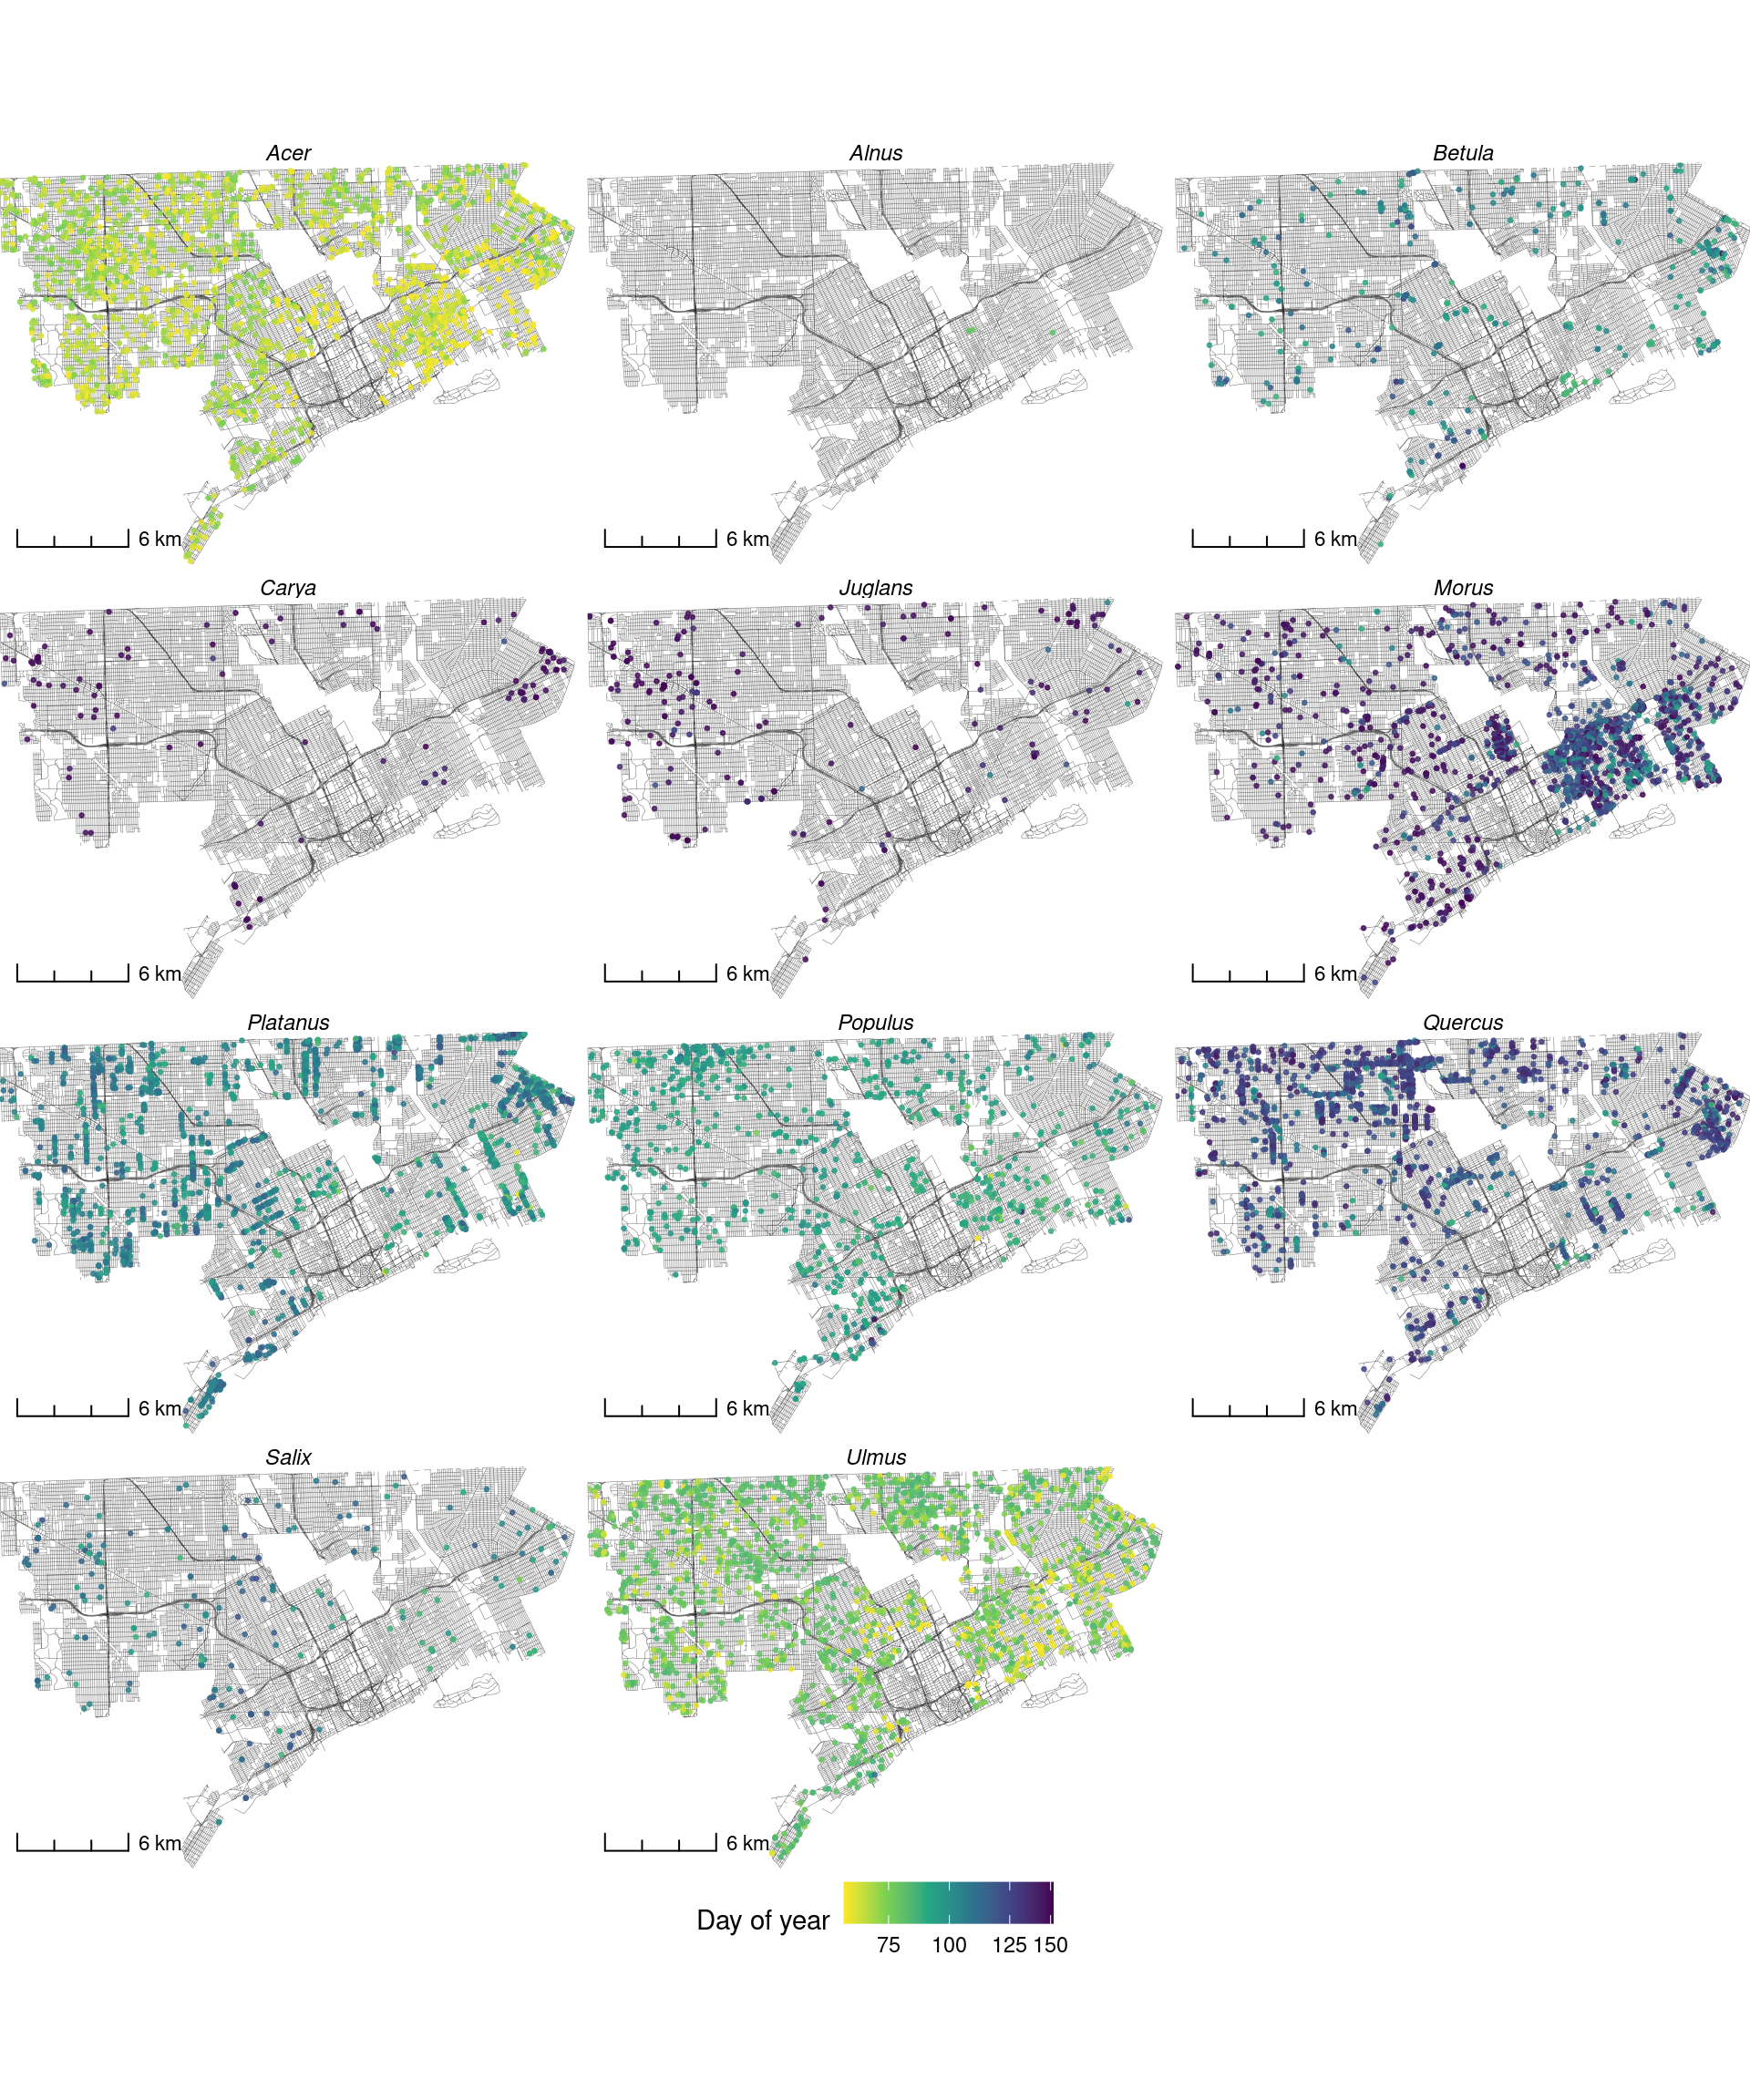
Visualize matching results for all taxa.
source("code/map_tidy.R")
source("code/map_plot.R")