6 Triple-Double vs Quantitative Variables
Our next goal is to examine the relationships between triple-double and some quantitative variables. Here we’re going to take a look at Westbrook’s playing time (in minutes), and plus/minus value.
6.1 Minutes
It’s now time to determine whether Westbrook’s game playing time contributes to the prediction of whether he has a triple-double. Below are a boxplot and some basic descriptive statistics of Russ’ minutes played, broken down by triple-double outcomes.
RussStats %>%
  ggplot(aes(y = Minutes, color = TripDbl)) +
  geom_boxplot() +
  theme(axis.text.x=element_blank()) +
  xlab("Triple-Double")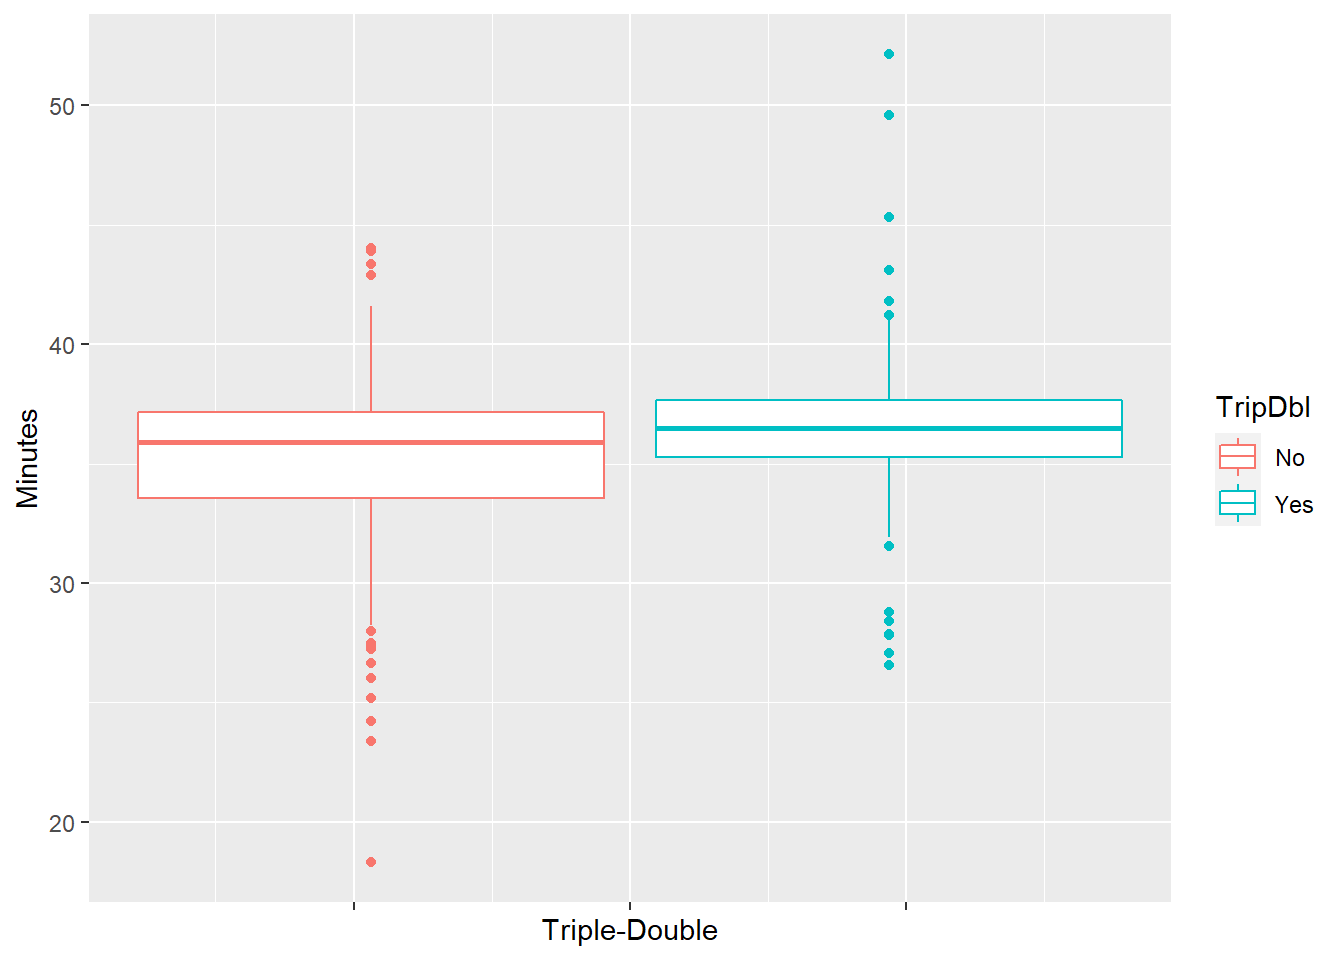
| TripDbl | min | Q1 | median | Q3 | max | mean | sd | n | missing |
|---|---|---|---|---|---|---|---|---|---|
| No | 18.32 | 33.57 | 35.9 | 37.15 | 44.02 | 35.03669 | 4.138038 | 133 | 0 |
| Yes | 26.58 | 35.27 | 36.5 | 37.65 | 52.13 | 36.48653 | 3.634914 | 101 | 0 |
From these summaries, we can see that Russ tends to play more minutes in games that he achieved a triple-double and in games that he did not. This actually quite makes sense, since occasionally, in games that he was 1 assist or 1 rebound shy of completing a triple-double, Westbrook usually stayed on the court for a few extra minutes and tried to stuff the stat sheet.
We then go on to dig deeper into our analysis by fitting a simple logistic regression model with triple-double as the categorical response and Minutes as the numerical independent variable.
Just as before, we can interpret the slope coefficient for our model term, which in this case is Minutes. And again, because our fitted slope represents the log odds ratio, we have to back-transform in order to get the actual odds ratio.
## (Intercept)     Minutes
## -3.84064951 0.09964255## Minutes
## 1.104776So an odds ratio for minutes of 1.10 suggests that every extra 1 minute of playing time multiplies the odds of Russ recording a triple-double by 1.10.
And then, we can explore statistical inference tools for our model, namely hypothesis tests and confidence intervals.
##                Estimate Std. Error   z value    Pr(>|z|)
## (Intercept) -3.84064951 1.34566346 -2.854094 0.004315981
## Minutes      0.09964255 0.03729246  2.671922 0.007541818
R’s output of Z = 2.67 and p-value = 0.008 leads us to the conclusion that Westbrook’s triple-double and non-triple-double games differ in his playing time. So Minutes is a helpful predictor for whether Russ was able to finish a game with double figures in three major statistical columns of the box score. As a side note, we can also use ANOVA to confirm this association between triple-double and minutes played.
##              Df Sum Sq Mean Sq F value  Pr(>F)
## TripDbl       1    121  120.67   7.817 0.00561 **
## Residuals   232   3582   15.44
## ---
## Signif. codes:  0 '***' 0.001 '**' 0.01 '*' 0.05 '.' 0.1 ' ' 1
With F = 7.82 and p-value = 0.006, we have evidence that the mean playing time differs for the two triple-double groups.
Similar to previous models, we can get a 95% confidence interval for the odds ratio based on the Minutes coefficient of this model, after exponentiating.
##                   2.5 %    97.5 %
## (Intercept) 0.001327727 0.2685521
## Minutes     1.029947125 1.1932006
Accordingly, we’re 95% confident that every extra minute of playing time is associated with multiplying the odds of having triple-double by a factor of 1.03 to 1.19.
## [1] 35.66248During his last 3 OKC years, Westbrook averaged close to 36 minutes/game. We now take a look at what this model says about Westbrook’s chance of having a triple-double for this typical playing time value. Again, since this is a fitting for the logit model, we have to back-transform to get these desired values.
##          1
## -0.2871492## 1
## 0.7503998## 1
## 0.4287019We get an odds of 0.75 and a probability of 0.43, which means Westbrook has about a 3:4 odds and a 43% chance of recording a triple-double in a game that he plays 36 minutes.
6.2 Plus/Minus
As mentioned before, plus/minus is a basketball metric that reflects how well a player’s team did while he is on the court. We would like to see if there’s an association between plus/minus and triple-double. As always, we begin with some simple data exploration summaries of our variables of interest.
RussStats %>%
  ggplot(aes(y = PlusMinus, color = TripDbl)) +
  geom_boxplot() +
  theme(axis.text.x=element_blank()) +
  xlab("Triple-Double")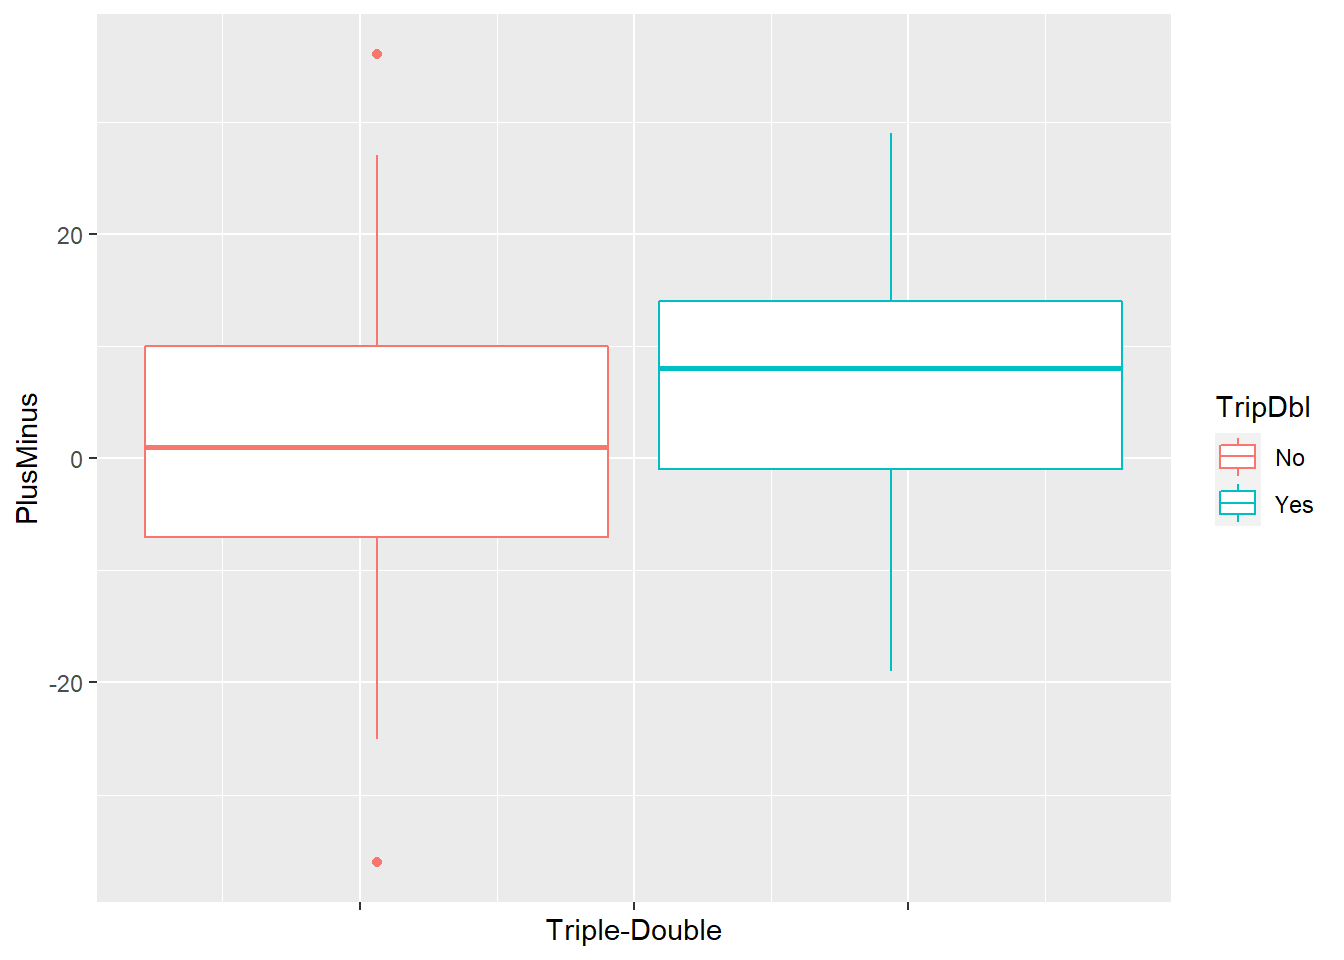
| TripDbl | min | Q1 | median | Q3 | max | mean | sd | n | missing |
|---|---|---|---|---|---|---|---|---|---|
| No | -36 | -7 | 1 | 10 | 36 | 1.503759 | 12.67521 | 133 | 0 |
| Yes | -19 | -1 | 8 | 14 | 29 | 7.158416 | 11.01339 | 101 | 0 |
In his triple-double games, Westbrook tends to have more positive plus/minus, meaning that his team is more likely to perform better when he’s on the court in these games. Let’s now fit a logistic regression model to confirm this relationship.
PlusMinusModel <- glm(TripDbl ~ PlusMinus,
                  family = binomial,
                  data = RussStats)
summary(PlusMinusModel)$coefficients
## Estimate Std. Error z value Pr(>|z|)
## (Intercept) -0.44788262 0.14636633 -3.060011 0.0022132866
## PlusMinus 0.03964066 0.01160996 3.414366 0.0006393061With Z = 3.41 and p-value = 0.001, Westbrook’s plus/minus indeed helps the prediction of his triple-double outcome. We can then get the fitted slope for PlusMinus, and also get a confident interval for this coefficient.
## PlusMinus
## 1.040437## 2.5 % 97.5 %
## (Intercept) 0.4769019 0.847610
## PlusMinus 1.0175539 1.065092So every 1 point increment in plus/minus multiplies the odds of having triple-double by 1.04. And we’re 95% confident that every extra 1 point of the difference between points scored and points allowed when Russ is in the game is associated with multiplying the odds of having triple-double by a factor of 1.02 to 1.07.
| x |
|---|
| 3.944444 |
During his last 3 OKC seasons, Westbrook averaged a plus/minus statistic of about 4. We’re interested in seeing what this model predicts for his odds and probability of having a triple-double when having this typical +/-.
PMData <- data.frame(PlusMinus = AvgPM)
Logit <- predict(PlusMinusModel, PMData)
Odds <- exp(Logit)
Odds
## 1
## 0.7471254## 1
## 0.4276312We get an odds of 0.75 and a probability of 0.428 (almost identical to the values when having Minutes as a predictor), which means Westbrook has a 3:4 odds and a 42.8% chance of recording a triple-double with a +4 point differential when playing.
6.3 Minutes, Plus/Minus, and Result
The last model we’re going to take a look at is a multiple logistic regression model of predicting triple-double, with Result, Minutes, and Plus/Minus - the 3 factors that gave us the best single (one-predictor) models above - as the 3 predictors.
##               Estimate Std. Error   z value     Pr(>|z|)
## (Intercept) -6.1671451 1.59672642 -3.862368 0.0001122932
## ResultWin    1.2538745 0.39059605  3.210157 0.0013266264
## Minutes      0.1407024 0.04309919  3.264619 0.0010961150
## PlusMinus    0.0173258 0.01670633  1.037080 0.2996987535
Based on the coefficients table, we don’t have evidence that Plus/Minus is a helpful predictor of triple-double, after accounting for Win and Minutes. On the other hand, Win and Minutes are helpful in predicting whether Westbrook had a triple-double, after accounting for the other two factors.
Lastly, we’re going to carry out a drop-in deviance test to check whether the two numerical factors Minutes and Plus/Minus together are significant predictors of Triple-double, after accounting for Result. The null hypothesis is the full model (Result, Minutes, Plus/Minus) is the same as the reduced model with Result as the only predictor for Triple-double, whereas the alternative hypothesis is the full model is better than the reduced model. To get the answer, we have to get the difference in deviances and degrees of freedom between the full and reduced model, which will then allow us to obtain a p-value from the upper tail of a Chi-square distribution.
## Analysis of Deviance Table
##
## Model 1: TripDbl ~ Result
## Model 2: TripDbl ~ Result + Minutes + PlusMinus
##   Resid. Df Resid. Dev Df Deviance Pr(>Chi)
## 1       232     296.35
## 2       230     283.78  2   12.566 0.001868 **
## ---
## Signif. codes:  0 '***' 0.001 '**' 0.01 '*' 0.05 '.' 0.1 ' ' 1
The drop-in-deviance test statistic (G) is 296.4 - 238.8 = 12.6 on 232 - 230 = 2 degrees of freedom, producing a p-value of 0.002. Hence this provides us evidence that the full model is better than the reduced model, thus Minutes and Plus/Minus together are helpful in explaining triple-double outcome, over and above game result.