7 A Fun Data Visualization Exploration
The last thing we’d like to do for this project is to study some visualization techniques using this data. What we are interested in observing is the number of triple-double Russell Westbrook recorded versus every NBA teams, during the course of his last 3 years as OKC’s starting point guard. Rather than just looking at basic numerical and summaries of this value, why don’t we plot the number of times Westbrook recorded a triple-double against each opponent to their corresponding locations on the map?
In order to do this, the first thing we need to do is to get the team’s coordinates (latitude and longitude). We once again use web scraping to accomplish this extra piece of data. Fortunately for us, the Wikipedia page of the NBA has all the team’s coordinates in a data table, so we’re going to harvest the data from there. After the data is collected, we perform some data transformation tasks to get a table of each NBA team and their latitude and longitude.
NBAWiki <- read_html("https://en.wikipedia.org/wiki/National_Basketball_Association")
TeamsTable <- html_table(NBAWiki, fill = TRUE)[[3]]library(biogeo) #geography data
TeamLocation <- TeamsTable[,1:8] %>%
filter(!(Team %in% c("Eastern Conference", "Western Conference"))) %>%
select(Team, Coordinates) %>%
separate(Coordinates, c("Coord1", "Coord2", "Coord3"), " / ") %>%
separate(Coord1, c("lat", "long"), sep = " ") %>%
dmsparse(x = "long", y = "lat", id = "Team") %>% ##transform coordinate data
select(ID, x, y) %>%
rename(Team = ID, long = x, lat = y) %>%
arrange(Team)Here’s a quick glimpse of our team location table:
| Team | long | lat |
|---|---|---|
| Atlanta Hawks | -84.39639 | 33.75722 |
| Boston Celtics | -71.06222 | 42.36639 |
| Brooklyn Nets | -73.97472 | 40.68278 |
We then obtain a table of all OKC’s opponents and their coordinates data, by filtering out the Thunder from the previous coordinates table.
OppAbbrev <- sort(unique(RussStats$Opp))

OppLocation <- TeamLocation %>%
  filter(Team != "Oklahoma City Thunder") %>%
  mutate(Opp = OppAbbrev)
And now let’s get the triple-double count of Russell Westbrook against every NBA team not named Oklahoma City Thunder.
GamesCount <- RussStats %>%
  filter(TripDbl == "Yes") %>%
  group_by(Opp) %>%
  summarise(count = n()) %>%
arrange(desc(count))| Opp | count |
|---|---|
| NOP | 8 |
| UTA | 6 |
| IND | 5 |
| MEM | 5 |
| BRK | 4 |
## [1] 29So from 2016 to 2019, Westbrook tallied a total of 8 triple-doubles against OKC’s in-division rival, the New Orleans Pelicans, more than any other team in the league. Next up on the list is Utah with 6 triple-doubles conceded to Westbrook, followed by Indiana and Memphis, both with a count of 5. It is worth noticing that Westbrook recorded at least one triple-double against all 29 NBA opponents during this 3-year span, which is astonishing.
For our first mapping approach, we utilize R’s maps package, which contains some functions we can use to map the number of triple-double recorded by Westbrook with the corresponding opponent.
OppInfo <- full_join(OppLocation, GamesCount, by = "Opp")

USMap <- map_data("usa")     # get US map
States <- map_data("state")  # get state map
USMap %>%
ggplot(mapping = aes(x = long, y = lat)) +
borders("state") +
geom_polygon(mapping = aes(group = group)) +
geom_polygon(data = States, mapping = aes(x = long, y = lat, group = group),
fill = "lightyellow", color = "grey") +
geom_point(data = OppInfo, mapping = aes
(x = long, y = lat, size = count, color = count)) +
geom_text(data = OppInfo, mapping = aes
(label = Opp), nudge_y = -0.7) +
scale_size(breaks = 1:8) +
scale_color_gradient(low="blue", high="red", breaks = 1:8) +
theme(axis.text = element_blank(),
axis.ticks = element_blank(),
panel.grid = element_blank())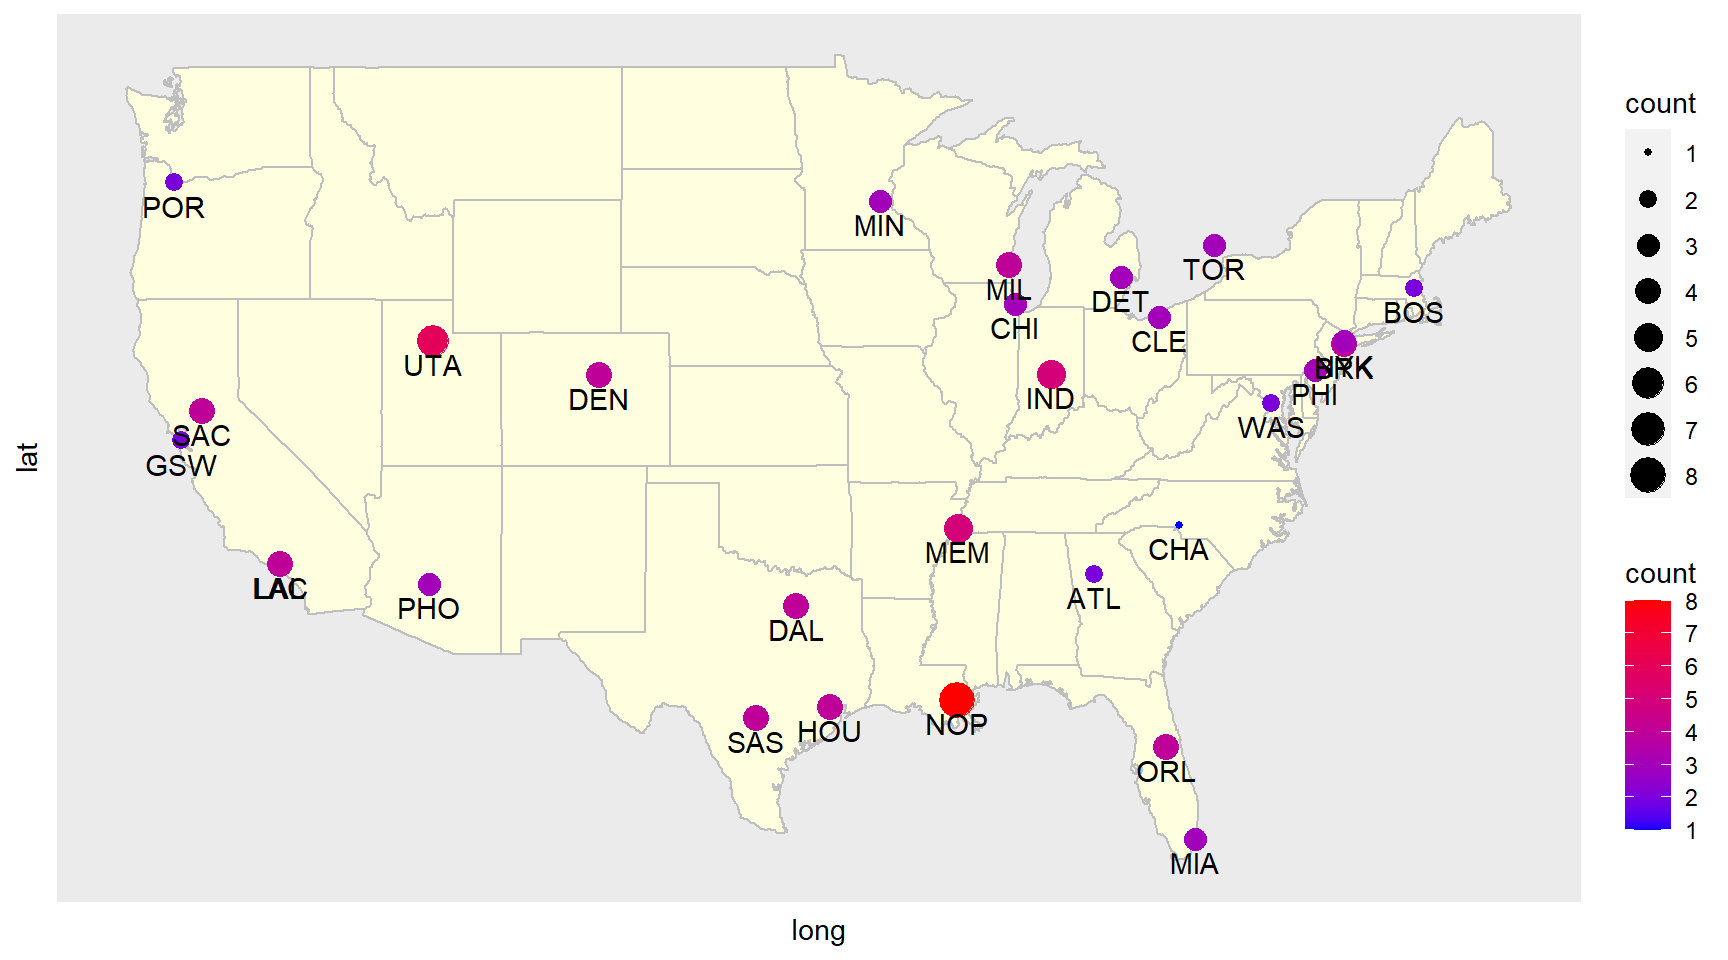
This map indicates the locations of teams on the US map, with each NBA team being represented by each plotted point. The bigger the point, the more triple-doubles Russ had against the team represented by that point. It easy to recognize New Orleans and Utah as the two teams with most triple-doubles conceded to Westbrook, and also Charlotte (represented by the tiniest dot) as Westbrook’s “triple-double kryptonite”, as he only had one triple-double game in three years when playing against the team owned by Michael Jordan.
However, this map has some limitations, as we can’t zoom in to view teams that are in regions having multiple NBA squads, and also tell exactly how many triple-double each team concedes. For that reason, we’re now going to look at a fancier, more versatile and interactive mapping method.
We’ll need functions from the following packages, all of which will play a huge role in this second mapping approach.
This interactive method allows us to change the zoom scale, choose between different map-viewing options (street map, topographic map, etc.), and most importantly see what each point represent by moving the pointer closer enough to the points or clicking on the points. Let’s first look at where each NBA team is located on the world map.
NBATeams <- st_as_sf(TeamLocation, coords = c("long", "lat"), crs = 4326) #st_as_sf: parse
mapview(NBATeams, legend = FALSE)
And now we can map all OKC’s opponents and their triple-double counts when facing Westbrook.
Opponents <- NBATeams %>%
  filter(Team != "Oklahoma City Thunder") %>%
  mutate(Opp = OppAbbrev) %>%
  full_join(GamesCount, by = "Opp") %>%
select(Team, count)mapview(Opponents[],
zcol = "count", # variable to be represented
cex = "count", # set circle radius
legend = TRUE,
col.regions = colorRampPalette(c("purple", "yellow")),
alpha.regions = 1.5,
layer.name = "count") As we can see, compared to the fair-to-say limited and plain vanilla first approach, this second mapping approach evidently gives us better mapping output, in terms of versatility, user-friendliness, and neatness.