Introduction to GIS
GIS is the abbreviation for geographic information system. It is a computer-based tool designed to collect, store, process, analyse, visualise and interpret spatially referenced data.
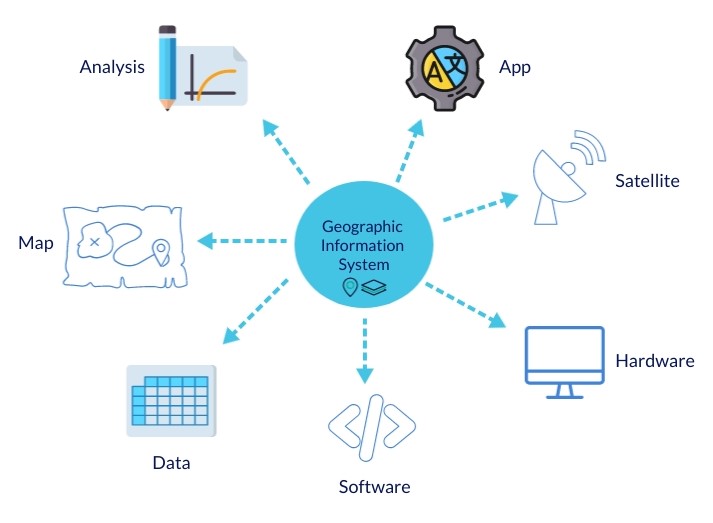
GIS is a useful tool to help answer geographic questions and make decisions.
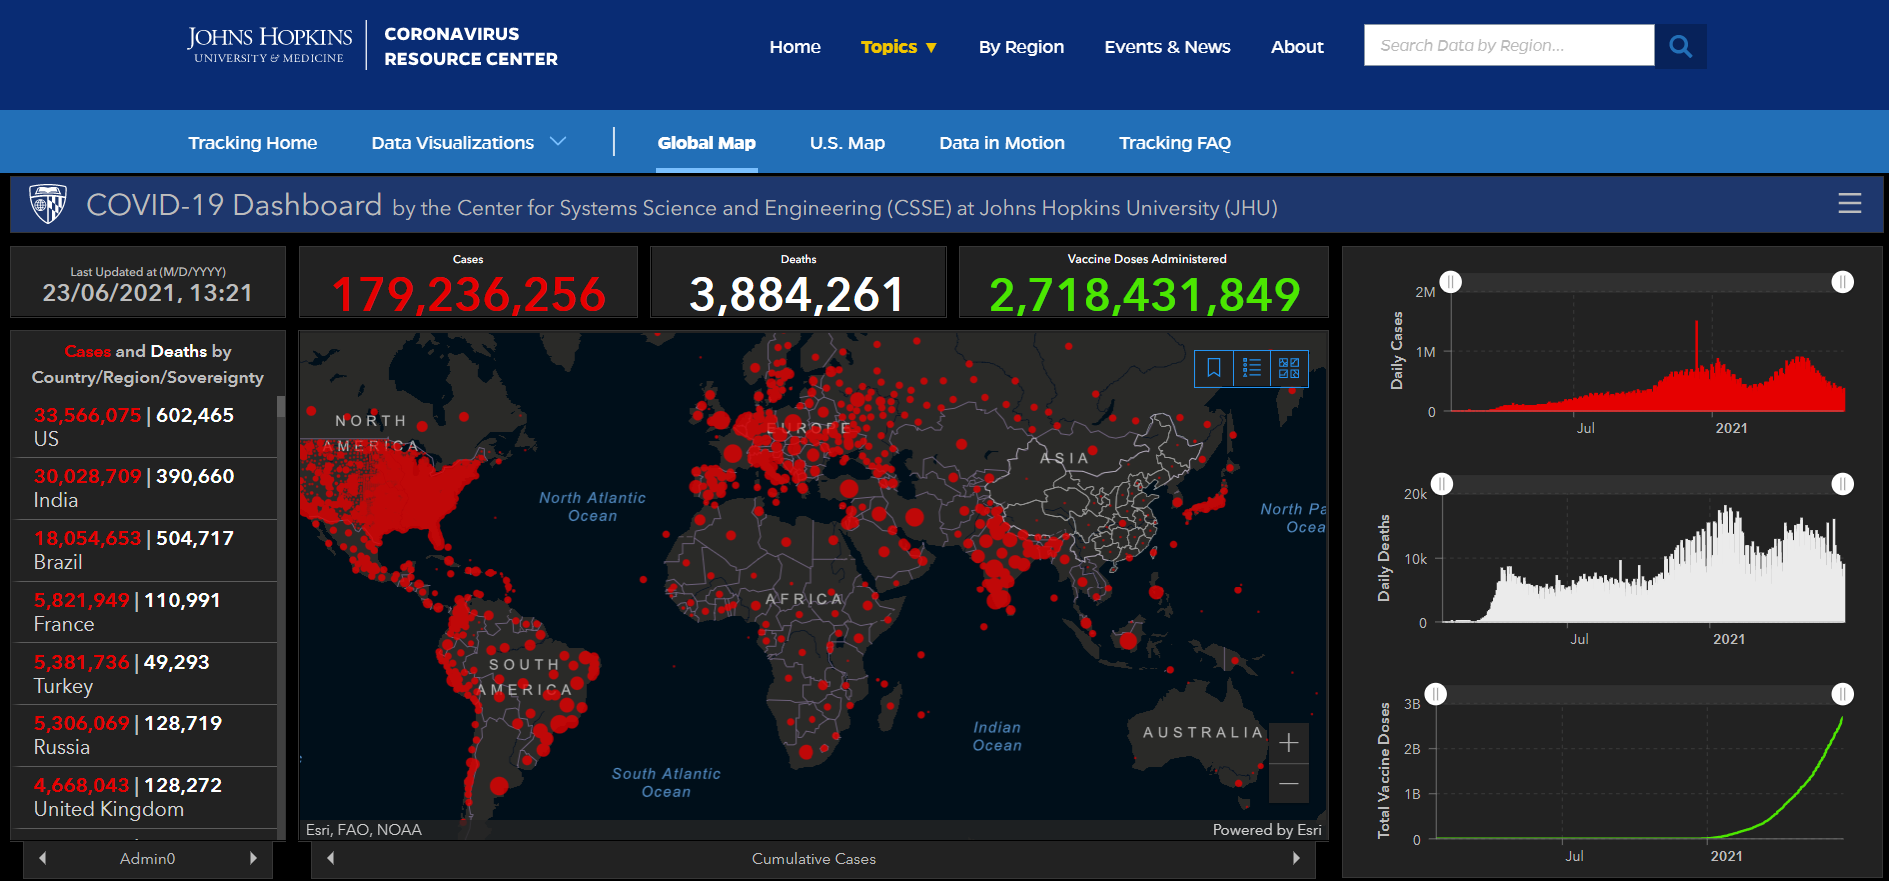
For example, GIS can be used by climatologists to understand the causes and consequences of climate change, by political consultants to develop campaign strategies for elections or by epidemiologists to locate ground zero of a disease outbreak.
Dangerous heatwave along the western side of North America (Source: Scott Duncan)
Geographic Information
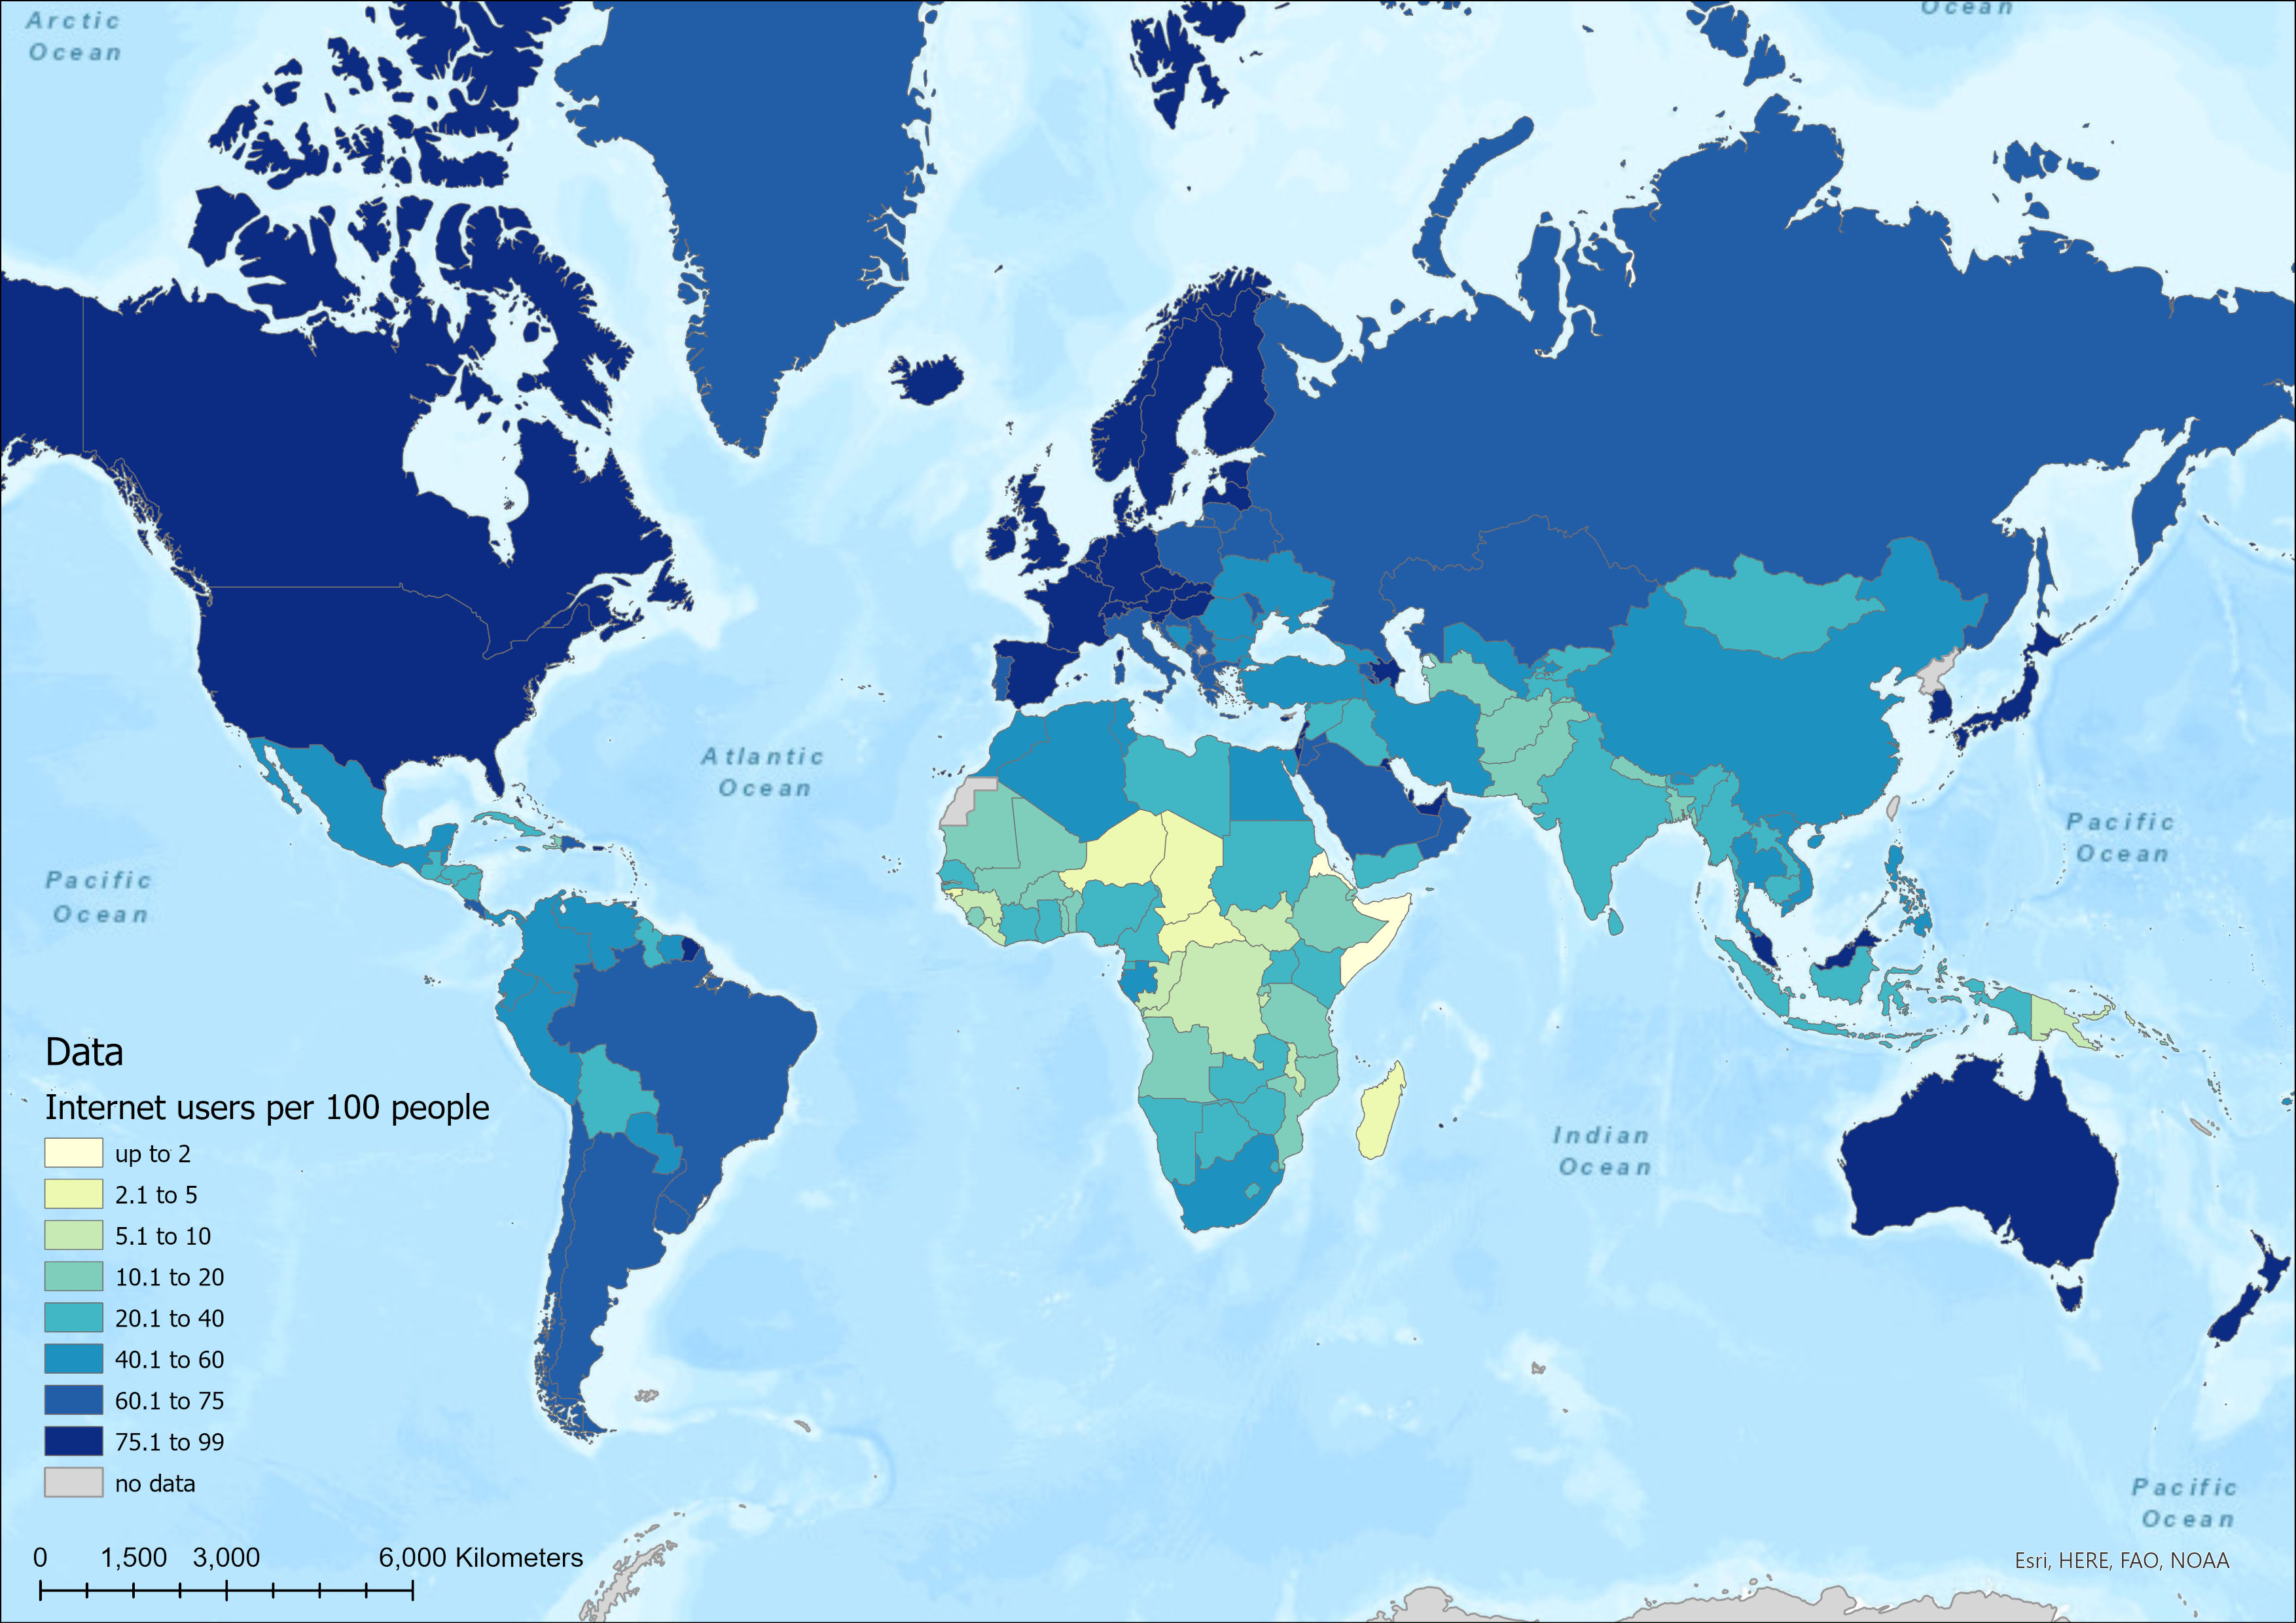
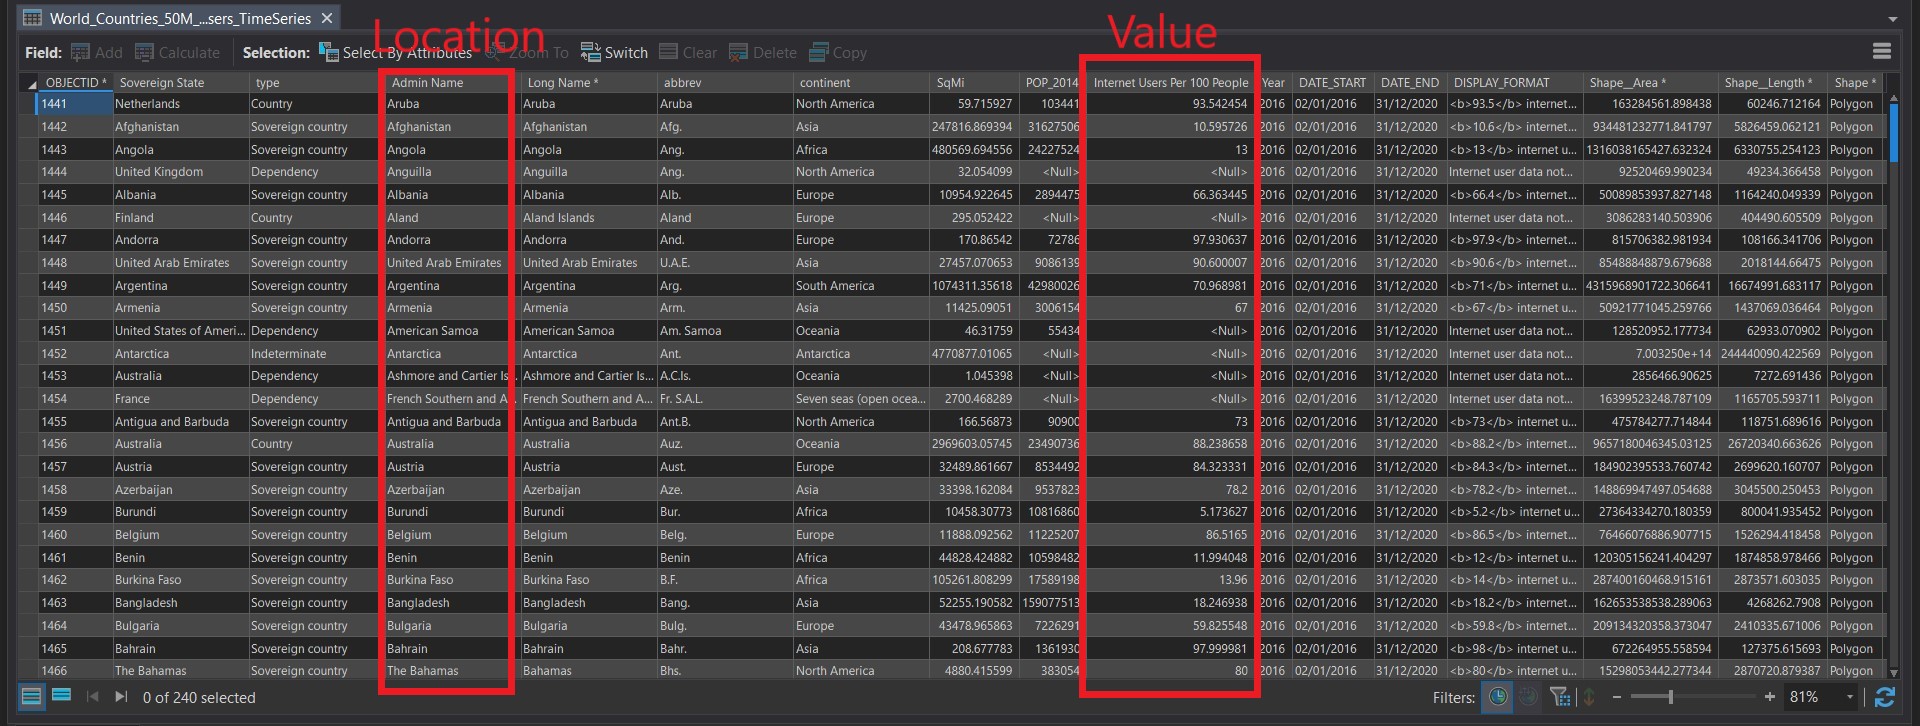
In GIS geographic information is made up of spatial location data and attribute data.
Spatial location data is data with geographic component. It answers the question where something is.
Attribute data answers the question what something is.
The database that contains these geographic information is called an attribute table and it can be used to symbolise features, make queries and to analyse the data.
The example below shows a choropleth map of Internet users (per 100 people) in 2016 and its associated attribute table.
GIS capabilities
GIS has many capabilities. These are:
Data processing: GIS can be used to view, create, edit, transform and display geospatial data.
Spatial analysis: Different tools are used within GIS to identify trends, patterns and relationships in data. For example spatial analysis can be creating buffers, clipping features, network analysis, performing spatial statistics and so on.
Map making: Map making helps spatially represent data from multiple sources (e.g. spreadsheets). This is the most common use of GIS.
Imagery and remote sensing: This is used to extract information from imagery and remotely sensed data (e.g. satellites).
Data collection and management: This can help to access, use, integrate and store data in a GIS.
GIS data
Types
Geographic information can be stored either as a vector data or a raster data.
Vector data
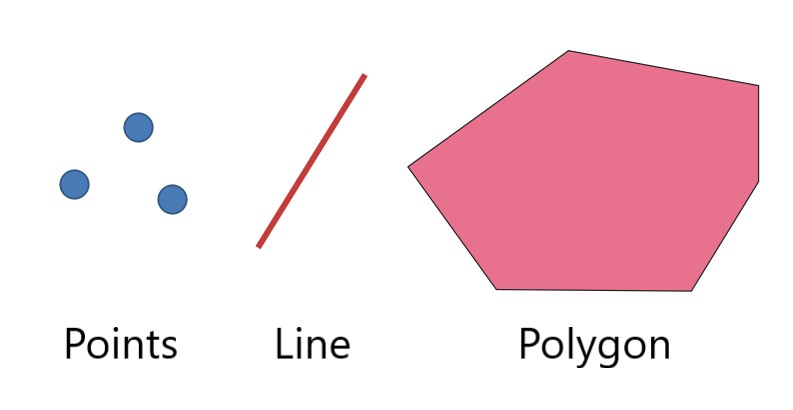
Vector (or feature) data is categorical data stored as geometrical shapes such as:
Points: Points are single x,y coordinate locations.
Lines: Lines are defined by two or more points that are connected with lines.
Polygons: Polygons are defined by multiple points that are connected with lines and are closed.
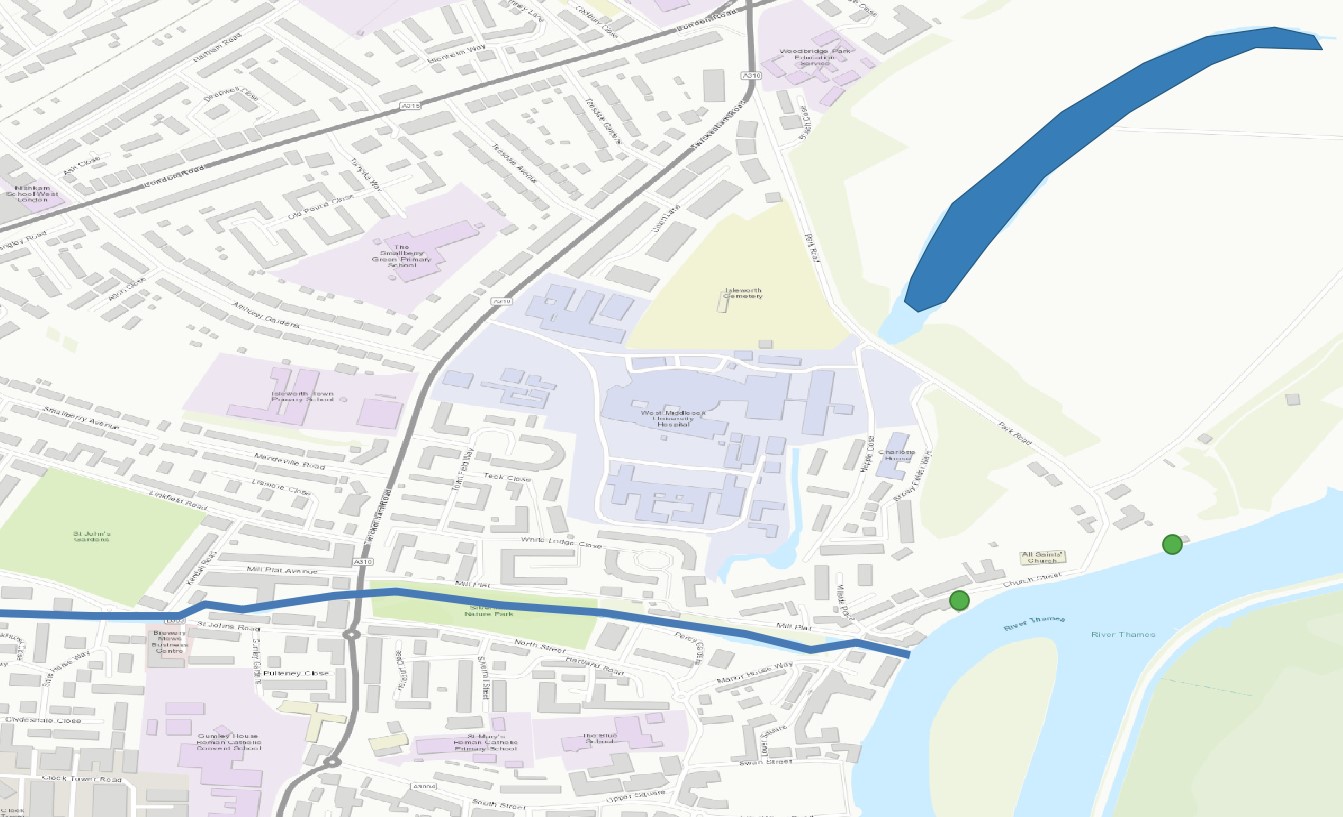
For example, geospatial data that show the location of buildings, rivers or ponds.
Raster data
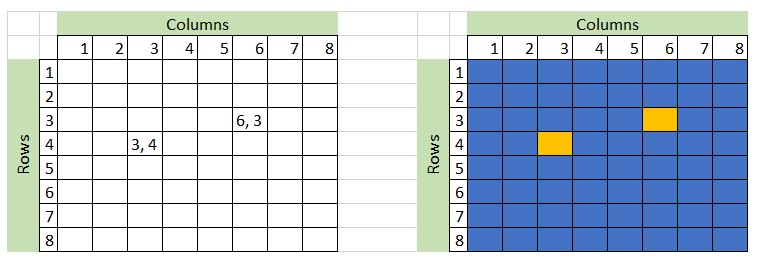
Raster data is made up of a matrix of pixels, called cells, with each being the same size and containing a value that represents the conditions for the area covered by that cell. Raster data formats include JPEG (Joint Photographic Experts Group), BMP (Bitmap Image), PNG (Portable Network Graphics) and TIFF (Tagged Image File Format) files.
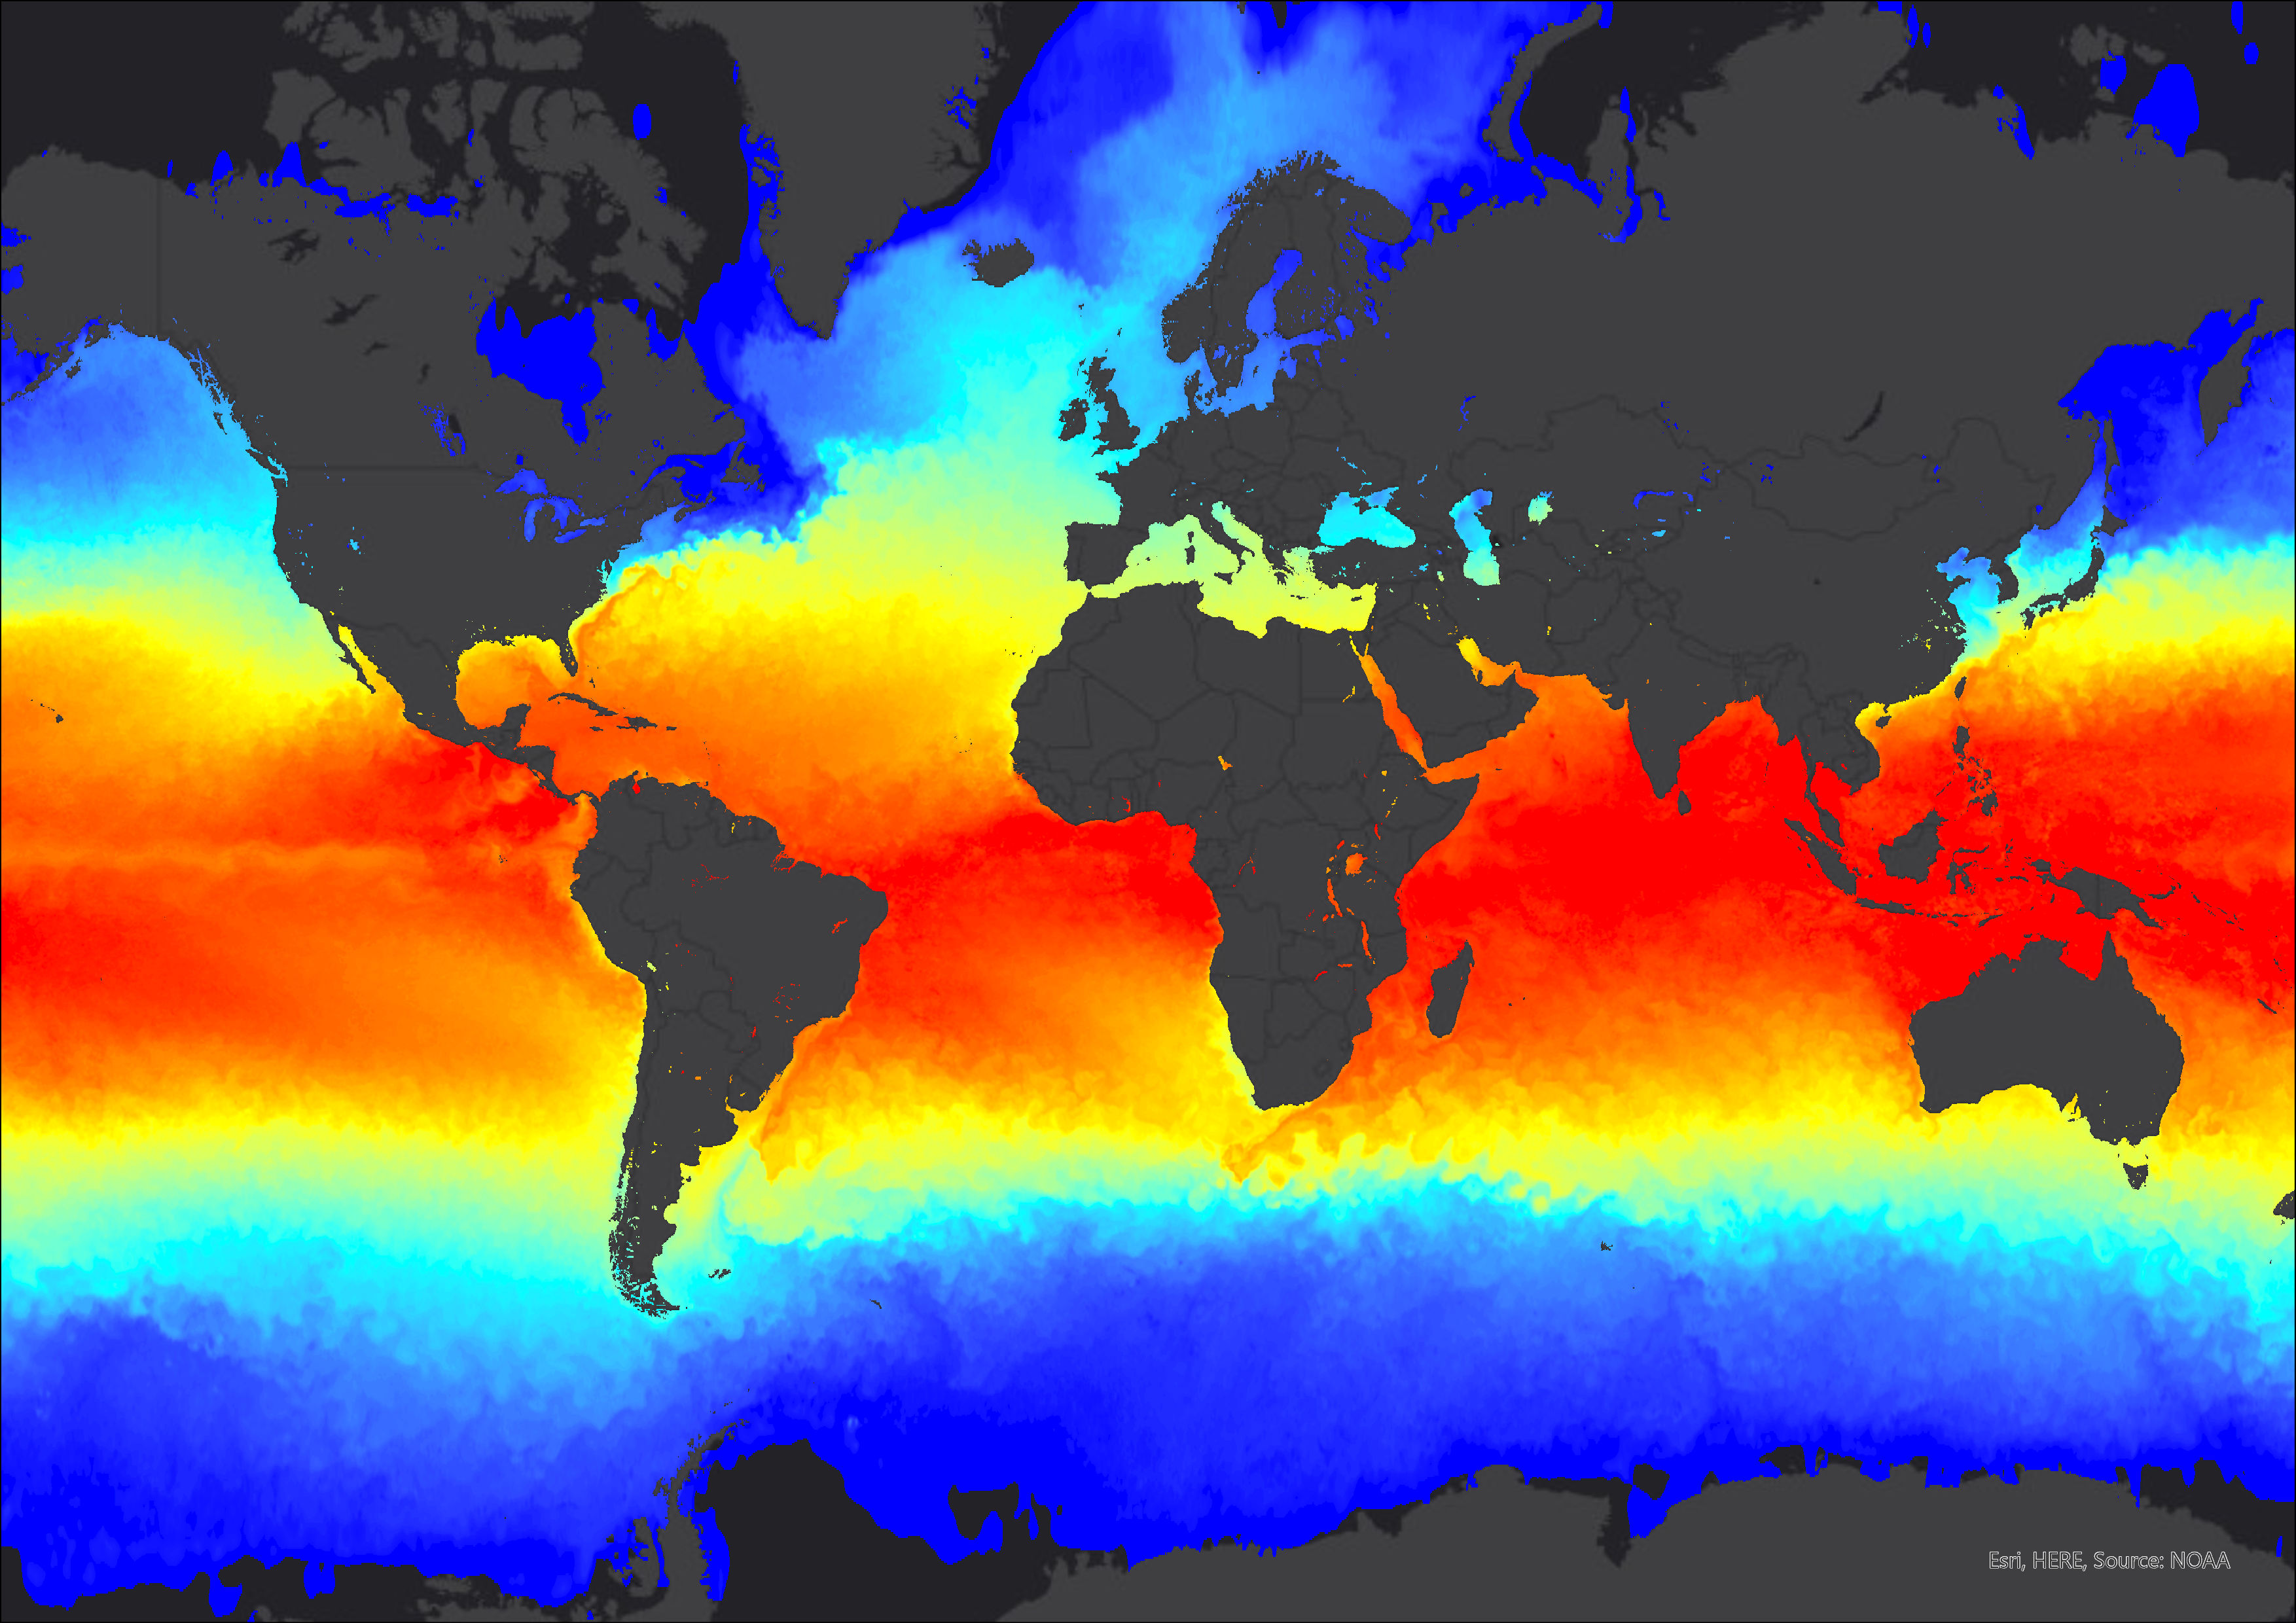
Raster data represents continuous data (integer or real values) like temperature or elevation.
The example map below shows the average sea surface temperature on the 1st April in 2008.
Metadata
Here it also worth mentioning metadata which is essentially data about data. It provides additional information about the (geographic) data such purpose, who created it, scale, projection, attributes, its usage constraints and so on. The more detailed the metadata is, the easier for the user to interpret it and implement it.
Capture
Primary data capture is a direct data acquisition methodology. Directly captured data can come from a global positioning system (GPS) or from remote sensing and surveying technologies. For example, data collected during field surveys, using satellite imaginary or Lidar.
Lidar
Lidar (Light Detection and Ranging) is a remote sensing method that uses light in the form of a pulsed laser to measure ranges to the Earth. These light pulses—combined with other data recorded can generate precise, three-dimensional information about the shape of the Earth and its surface characteristics. A lidar instrument principally consists of a laser, a scanner and a specialised GPS receiver.
The two types of Lidar are:
Topographic uses a near-infrared laser to map the land.
Bathymetric uses water-penetrating green light to also measure seafloor and riverbed elevations.
Secondary data capture is an indirect data acquisition methodology. For example, the use of existing geospatial data (e.g. through sites like NASA or NOAA) available in both digital and hardcopy formats.
A third way of data capture is digitization. This is used to create digital files from the original paper copy.
Format
Vector and raster data can be stored and distributed in different formats.
Shapefile
Shapefile was first developed by Esri and it is the most widely known format for distributing geospatial vector data. A shapefile will always come in a .zip format containing the following files:
.shp: Contains the geometry of each feature.
.dbf: Contains the attribute data for all of the features in the dataset.
.shx: Spatial index, it allows GIS systems to find features within the .shp file.
.prj: Contains information about the projection and coordinate system the data uses.
.cpg: This is an optional plain text file that describes the encoding applied to create the shapefile.
.sbn and .sbx: These are also optional files that store the spatial index of the features.
.qmd: Metadata stored by QGIS.
When you use a GIS software, you will only work with the .shp file, however, all the above files must be within the same folder in order for the .shp file to work!
GeoJSON
GeoJSON is a JavaScript format used to store geospatial vector data. It consists from the following different parts:
Geometry object: This is either the point, line, or polygon described earlier.
Feature object: This is the geometry object and the associated random data.
FeatureCollection: A list of feature objects.
GeoJSON is widely used in web-based mapping (e.g. Leaflet or CartoDB) as this format is easy to handle and also “lighter” than a shapefile.
TopoJSON
TopoJSON is simply an extension of the GeoJSON format that encodes topology.
CSV, TXT, and GPX files
Spreadsheet data can be stored and used in different GIS software in a comma-separated values text file (.csv), a delimited text file (.txt) or GPS Exchange Format file (.gpx) format.
KML
KML (Keyhole Markup Language) is a file format used to display geographic data in an Earth browser such as Google Earth or ArcGIS Earth. KMZ files are the zipped versions KML files.
GeoTiff
GeoTiff has georeferenced information embedded within an image file.
NetCDF
NetCDF (Network Common Data Form) files are a standard for the exchange of scientific data in binary format. This is used for storing raster data in GIS.
API
It is also worth mentioning API (Application Programming Interface). API is a software intermediary that allows two applications to talk to each other. For example, a data layer stored on ArcGIS can be directly plugged into a map made in QGIS or other web-mapping software. In GIS, a data layer through API can be accessed via Web Mapping Service (WMS), Web Feature Service (WFS) or GeoJSON.
Tip:
Useful sites:
Build custom geojson website for the creation of simplified GeoJSON regions.
geojson.io is a quick, simple tool for creating and viewing vector data.
Mapshaper can be used to edit Shapefile, GeoJSON, TopoJSON, CSV and several other data formats, written in JavaScript.
MyGeodata Converter is an online GIS data conversion and transformation tool.
Ogre translates spatial files into GeoJSON.
Quality
Due to how geospatial data is collected, analysed and represented, uncertainties with data quality may arise. These errors are in fact expected as almost all representations of the world are incomplete.
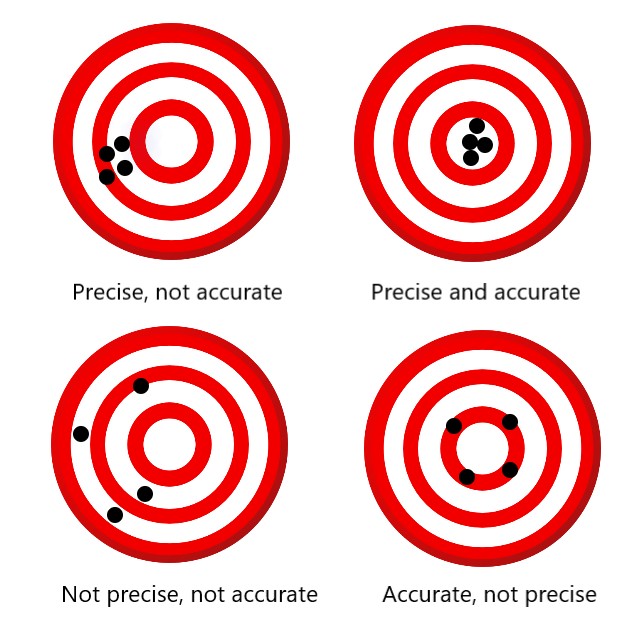
Two primary attributes that characterise data quality are precision and accuracy.
Precision refers to the fineness and exactness of the measurements, whilst accuracy is the difference between the recorded value and the true value.
To understand the difference between precision and accuracy, consider the illustration below:
When it comes to data quality in GIS, here are some of the things look out for:
The completeness of the attribute table (Is there any data missing?)
Temporal consistency (Is it up-to-date?)
Location accuracy (Is the position of the feature correct?)
Logical consistency (Is the data topologically correct?)
Unfortunately, the more accurate and precise a geospatial data is, the higher cost is to obtain it and store it. This is because of the time and equipment used to collect the data. Larger data will also always require constant maintenance.
Finding data
In the age of information, the world wide web has large amount of data available. A quick Google search can normally help to find geospatial data. However, it is best to acquire data from trusted sources.
ArcGIS Living Atlas of the World: This is a collection of geographic information from around the globe.
Cathcment Based Approach Data Hub: GIS data package is a set of over 150 data layers, which is provided to CaBA catchment hosts in the UK.
Copernicus: Copernicus is the European Union’s Earth observation programme.
Defra UK: Defra Data Services Platform
EmodNet: EmodNet is the gateway to marine data in Europe.
Esri Data Hub: Esri houses over 250,000 open data sets from 5,000 organisations worldwide.
JNCC Marine Protected Area (MPA) mapper: This is an interactive resource containing information on the MPAs designated in UK and Crown Dependency waters.
Koordinates: This is a geospatial data management platform.
MAGIC: The MAGIC website provides authoritative geographic information about the natural environment from across government.
Marine Regions: This is a standard list of marine georeferenced place names and areas.
Natural Earth Data: This site houses key cultural and physical vector GIS datasets.
Public Datasets: These are datasets collected and tidied from blogs, answers, and user responses.
Terra Populus: Terra Populus holds population and environmental data.
Open Geospatial Datasets: This is a repository of open geospatial datasets to be used in an educational context.
OpenStreetMap: OSM has some of the most detailed information on our planet.
Apart from these, there are many governmental and non-profit platforms that offer free access to geospatial data.
GIS software
There are a number of open-source (software that is freely available for use) and commercial GIS software available. Here are some of the most well-known (both desktop and web-based):
Summary
GIS is the abbreviation for geographic information system. It is a computer system used to create, manage, visualise, analyse and interpret spatially referenced data.
GIS is used to answer geographic questions and make decisions based on geospatial data.
Geographic information is made up of spatial location data (where something is) and attribute data (what something is).
GIS can be used for geospatial data processing, spatial analysis, map making, imagery and remote sensing, and data collection and management.
GIS data can either be vector or raster data.
The quality of geospatial data will depend on the time spent and the equipment used to collect it. However, almost all representations of the world are incomplete.
Nowadays there are many Internet platforms that offer open-access geospatial data.