2 Understanding figures
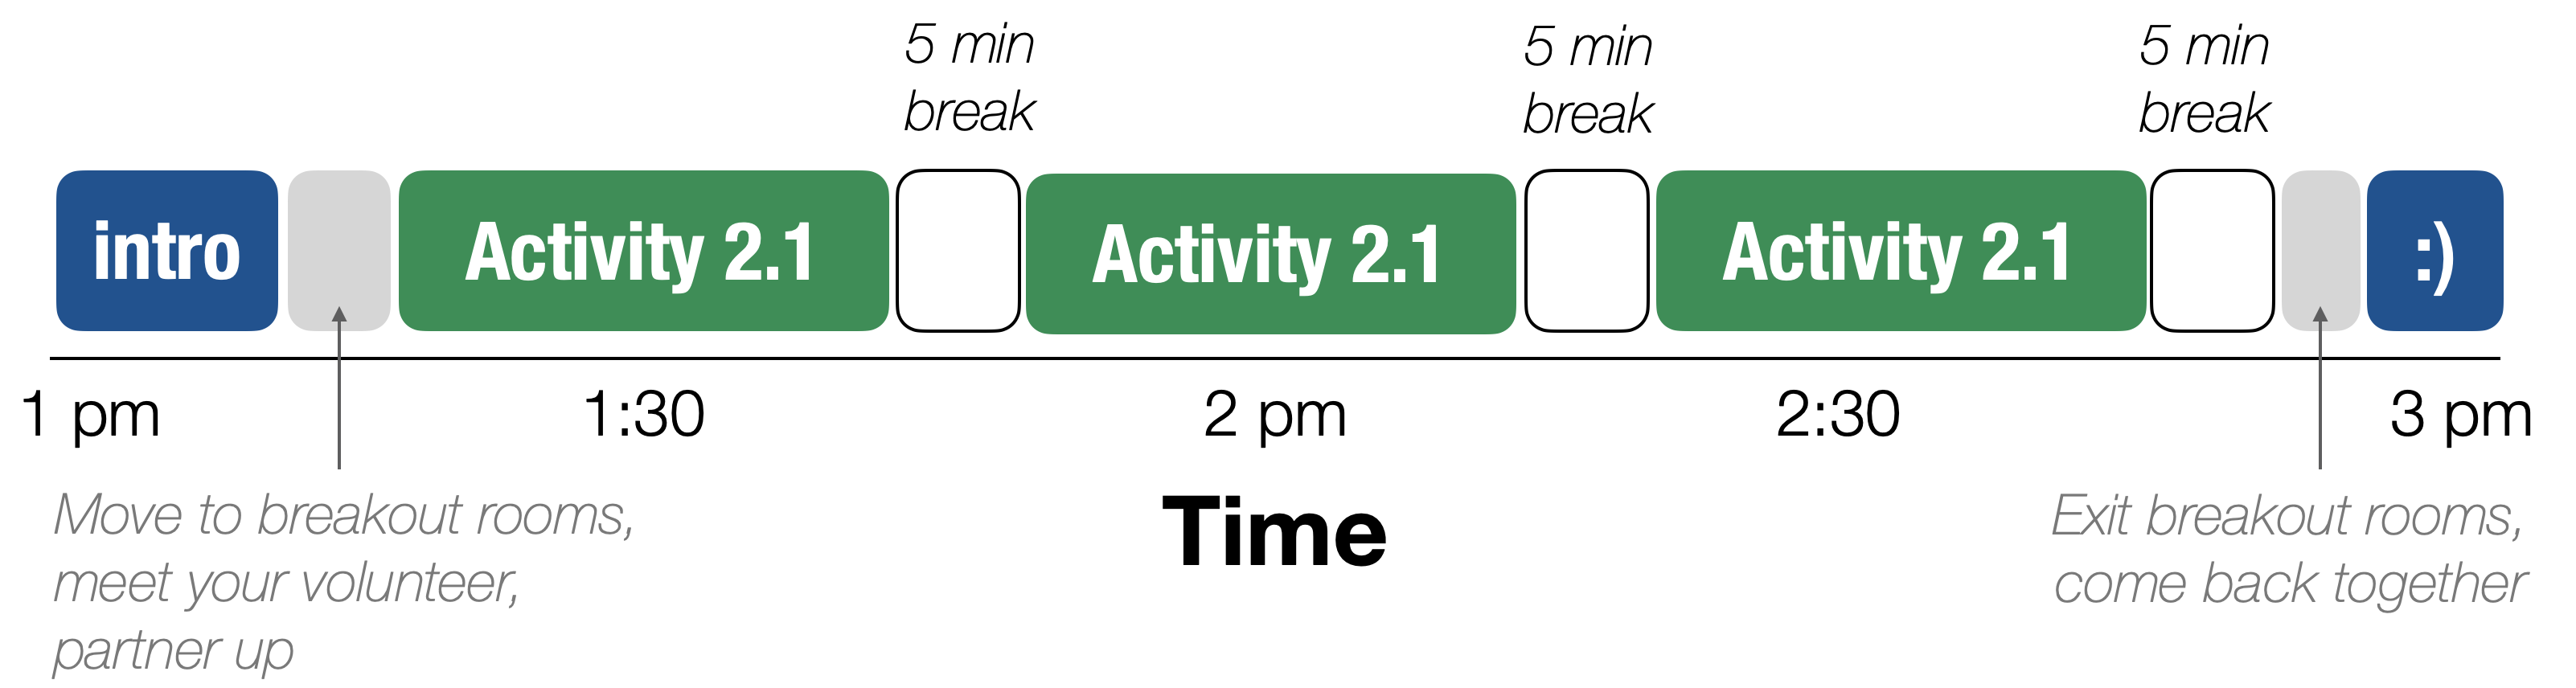
Figure 2.1: Most of this workshop will be spent practicing figure reading using the activity described below. (PS - this figure is a schematic!)
2.1 Activity
You can work in groups or alone. Once you finish your first panel, do another one! See if you can get through a whole figure.
Every scientist, at every level, depends on their ability to read figures. It’s a challenging and life-long skill. As you’re working on this activity, keep these goals in mind
If you were confused about a figure, and during this activity you find a more specific way to explain what you do not understand, you have succeeded.
If you were so overwhelmed by a figure that you didn’t know where to start to understand it better, and during this activity, you managed to get started on that process, you have succeeded.
If you didn’t have a system for reading figures before this activity, and afterwards, know that such a system is possible, you have succeeded.
Activity instructions
- Choose a single panel from a figure
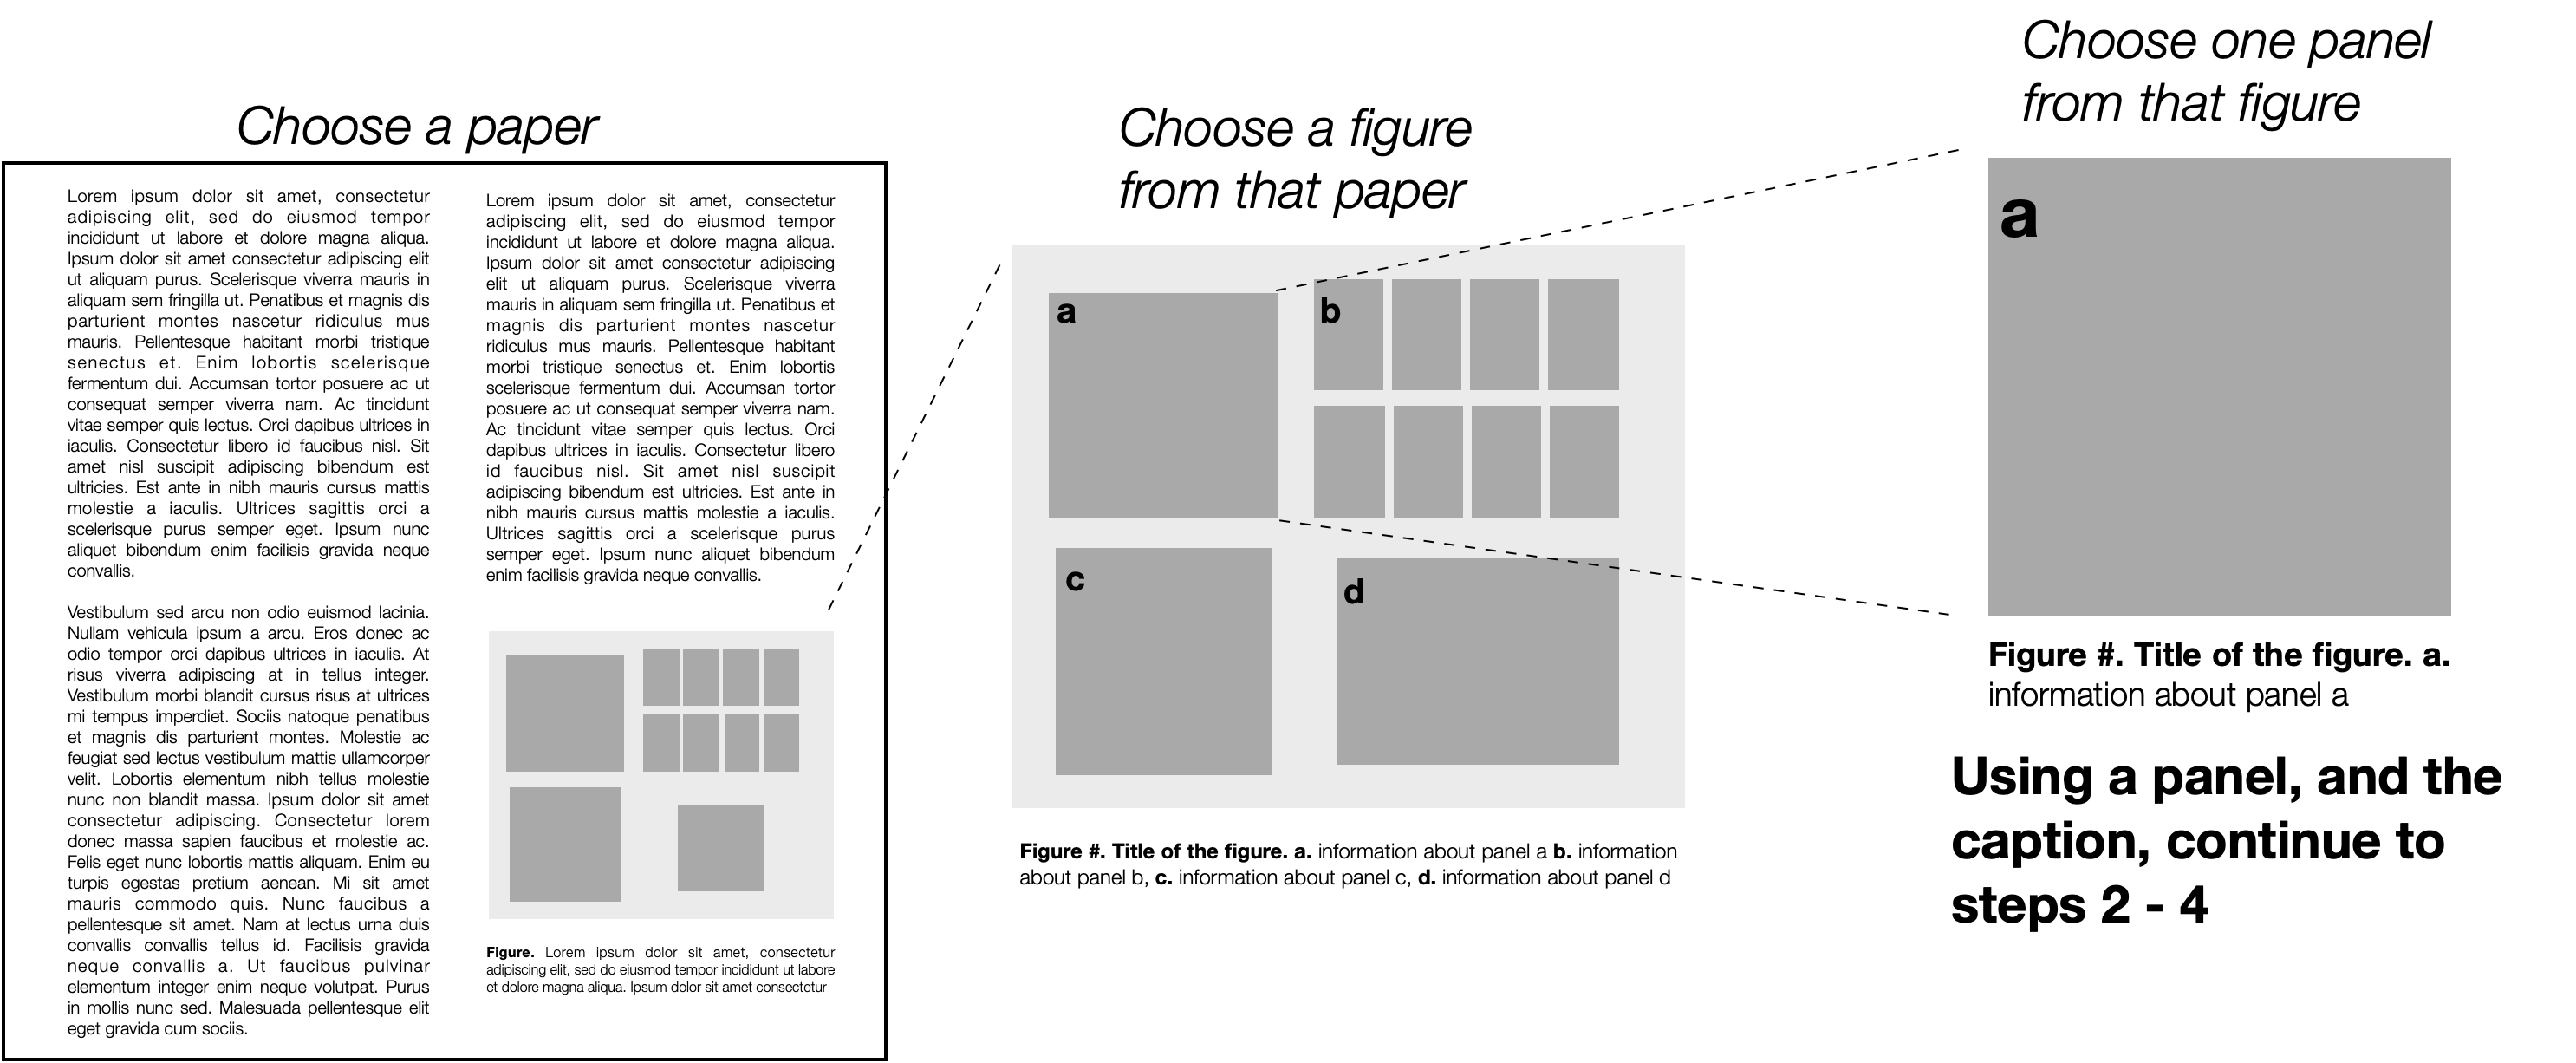
Figure 2.2: Choose a single panel of a figure.
- Identify what type of visualization your chosen panel is.
Use the Types of figures cheat sheet to determine if the panel you choose contains
a plot
an image or blot
a schematic
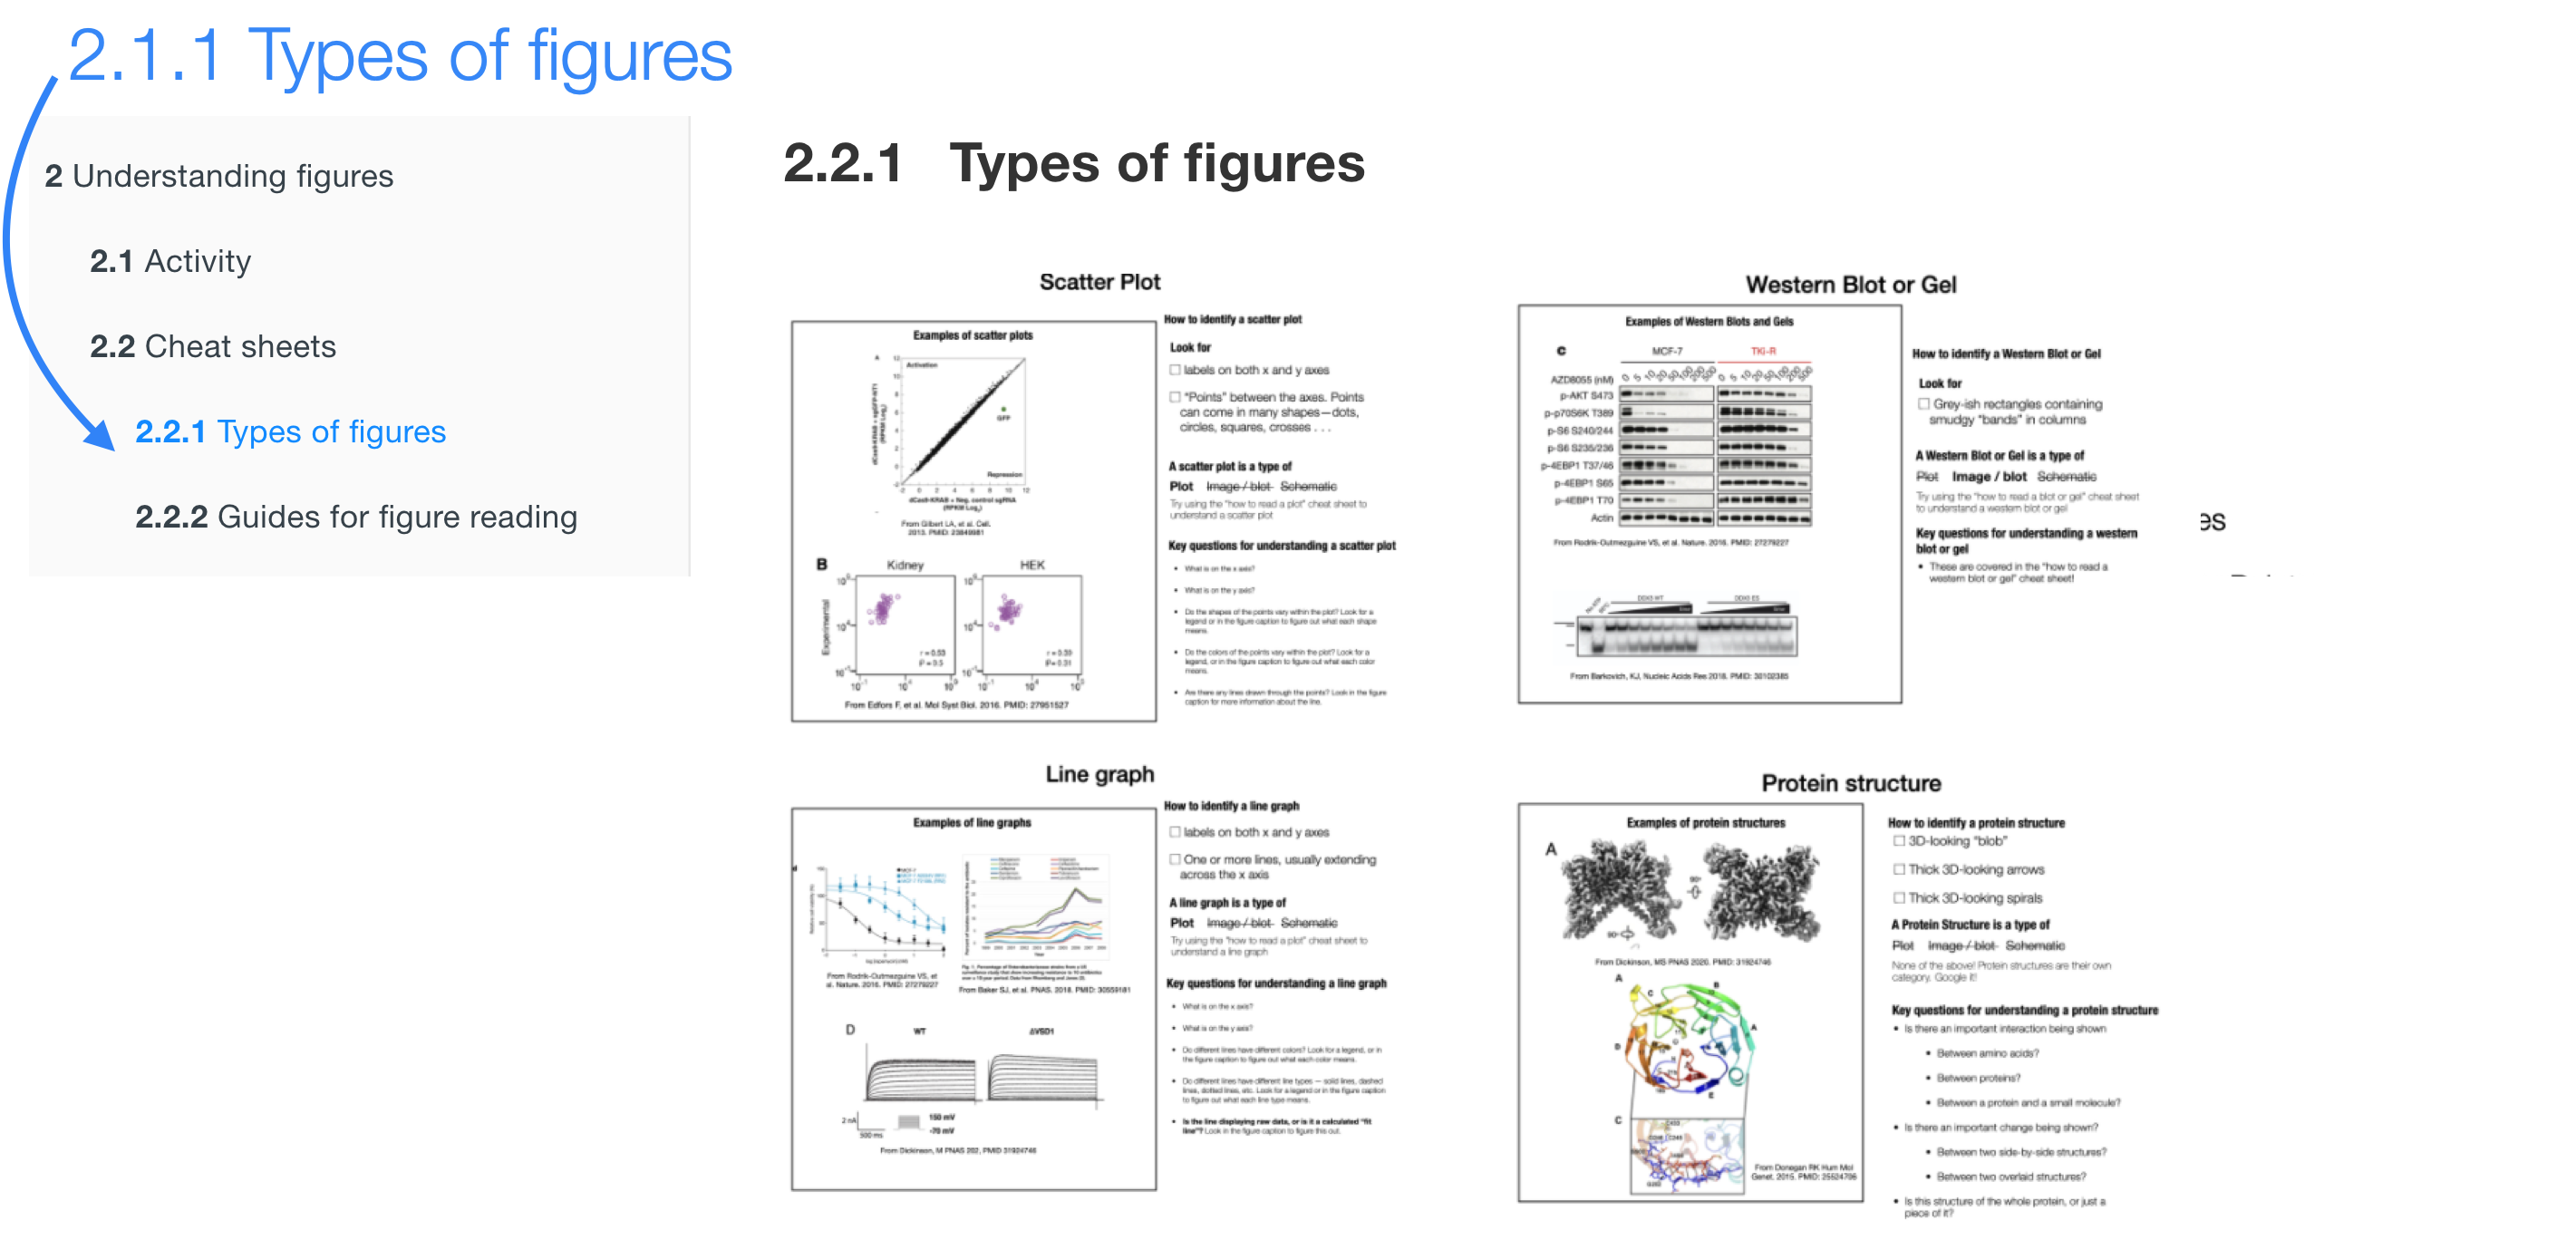
Figure 2.3: Screen shot of the “Types of figures” cheat sheet tab
- Decode the panel.
- If your chosen panel is a plot, use the “Reading a Plot” cheat sheet
- If your chosen panel is a western blot or gel, use the “Reading a gel or blot” cheat sheet
- If your chosen panel is a schematic, check out“Schematic” section of the Plot Type cheat sheet, found in Figure 2.14.
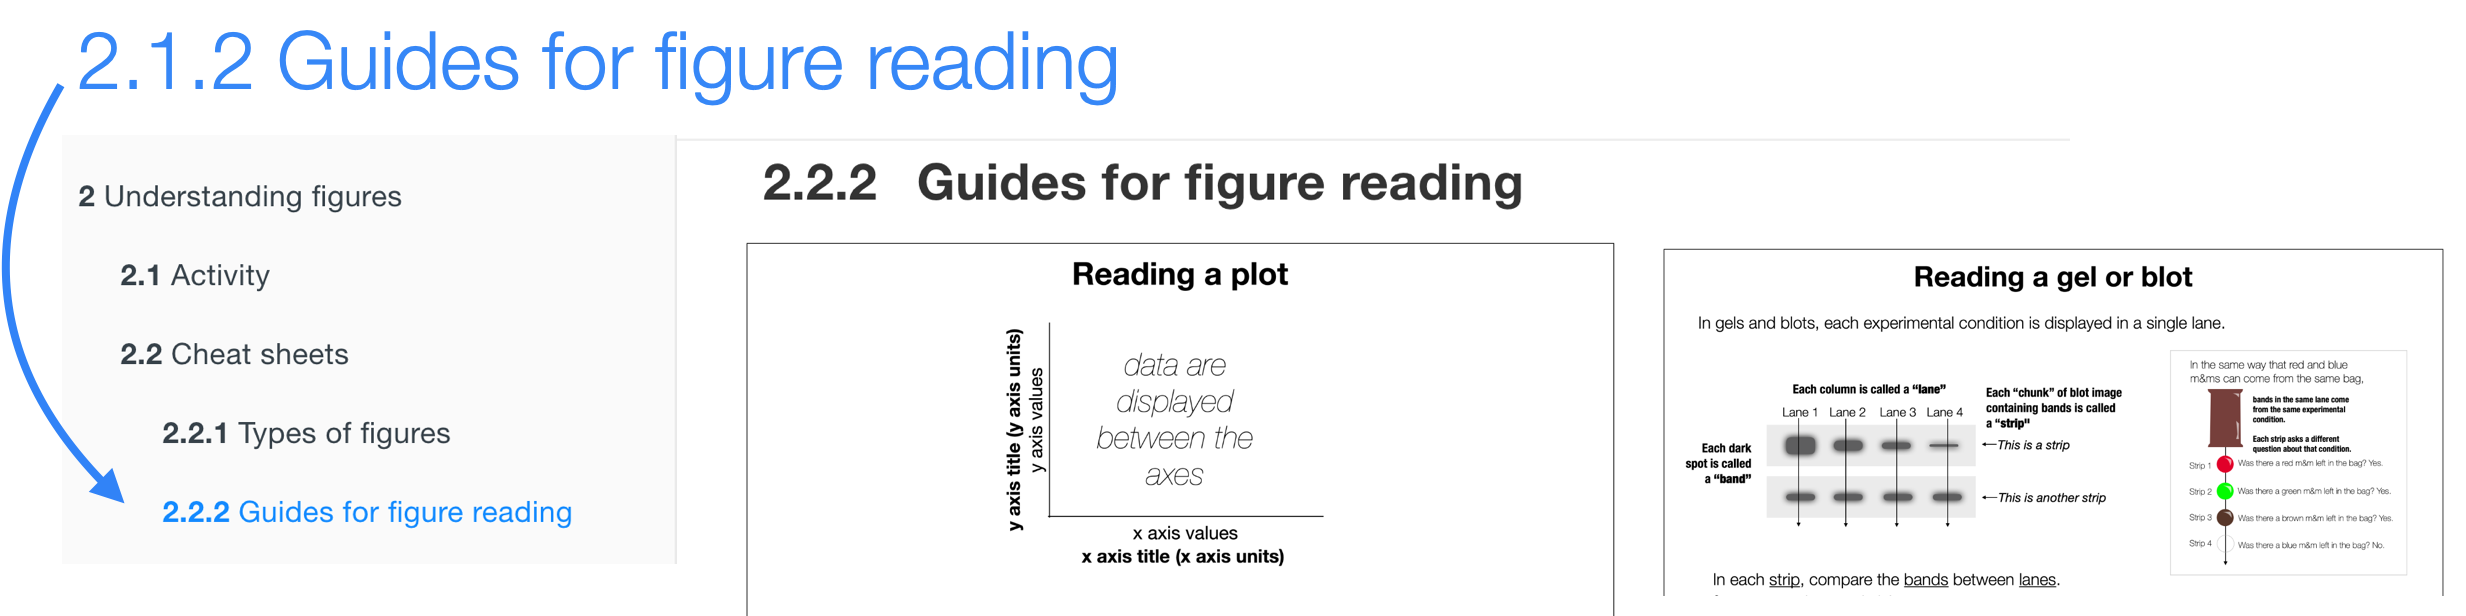
Figure 2.4: Screen shot of the “Guides for figure reading” cheat sheet tab
You can access the figure-reading guides in worksheet form at this google slides link: https://docs.google.com/presentation/d/1ZtMzW7vDdM1CbzIniX6GwBcMoMLLUGrkbibH9K0J3O4/edit?usp=sharing
You can copy the “Reading a plot” or “Reading a gel or blot” template into a new slide, and work directly in that.
- Extension: after this workshop is over, you can return to this activity to extend your understanding of the paper you worked on today.
During the session, please prioritize building up the figure-reading habits described in steps 1 - 3 of this activity! Only move on to this step if it’s really, really what you want to do.
Using the panel, figure caption, and now also the text from the paper, try to answer the following questions.
What experiment was performed to create the data in the panel?
What conclusions are the authors using the data in this panel to support?
In what ways do you agree that the data support these conclusions?
In what ways do you disagree that the data support these conclusions?
In what ways is this the correct experiment to test the authors’ hypothesis?
In what ways could this experiment better test the authors’ hypothesis?
In what ways does the visualization in this panel help you understand the experiment, result, and conclusion?
What could be changed in this panel to make it easier to understand the experiment, result, and conclusion?
2.2 Cheat sheets
The following two sections contain cheat sheets for figure reading.
These are meant to be resources you can return to after this workshop is over!
2.2.1 Types of figures
The first step in understanding a figure or panel is usually determining what kind of data visualization you are looking at. The more time you spend in research, the more familiar you will become with different types of visualizations. Until then, if you’re not sure what type of visualization you’re looking at, try checking your chosen panel against the common visualization types displayed below.
 .](images/plot_types/Plot_examples.001.jpeg)
Figure 2.5: If your panel most resembles a scatter plot, try using the Reading a plot guide .
.](images/plot_types/Plot_examples.002.jpeg)
Figure 2.6: If your panel most resembles a line graph, try using the Reading a plot guide.
.](images/plot_types/Plot_examples.003.jpeg)
Figure 2.7: If your panel most resembles a bar graph, try using the Reading a plot guide.
.](images/plot_types/Plot_examples.004.jpeg)
Figure 2.8: If your panel most resembles a histogram or densit plot, try using the Reading a plot guide.
.](images/plot_types/Plot_examples.005.jpeg)
Figure 2.9: If your panel most resembles a heat map, try using the Reading a plot guide.
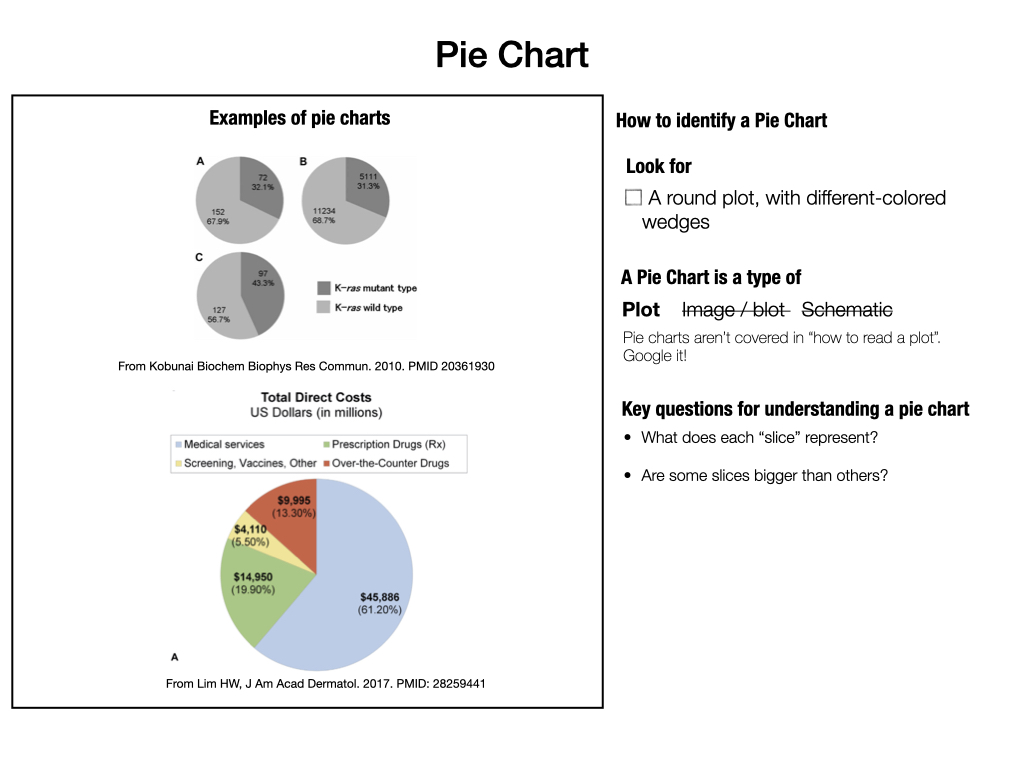
Figure 2.10: If your panel most resembles a pie chart, try looking up instructions online. We don’t have a guide for reading pie charts.
.](images/plot_types/Plot_examples.007.jpeg)
Figure 2.11: If your panel most resembles a western blot or gel, try the Reading a gel or blot guide.
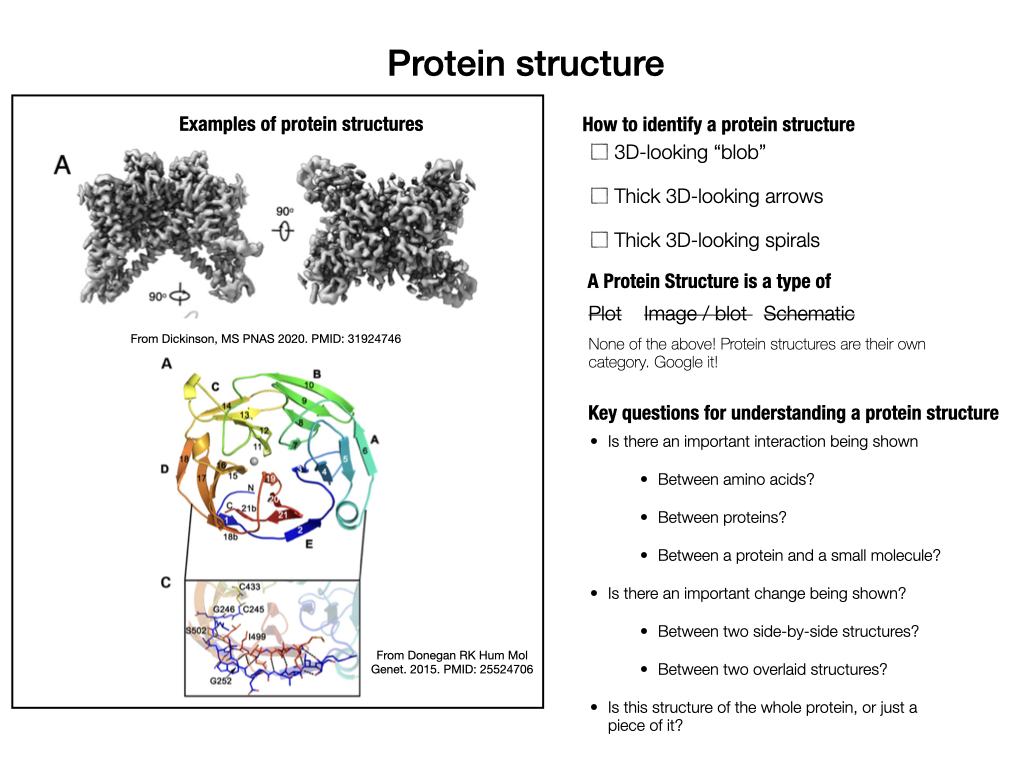
Figure 2.12: If your panel most resembles a protein structure, try answering the “Key questions for understanding a protein structure” above, and looking up more instructions online. We don’t have a guide for reading protein structures here.
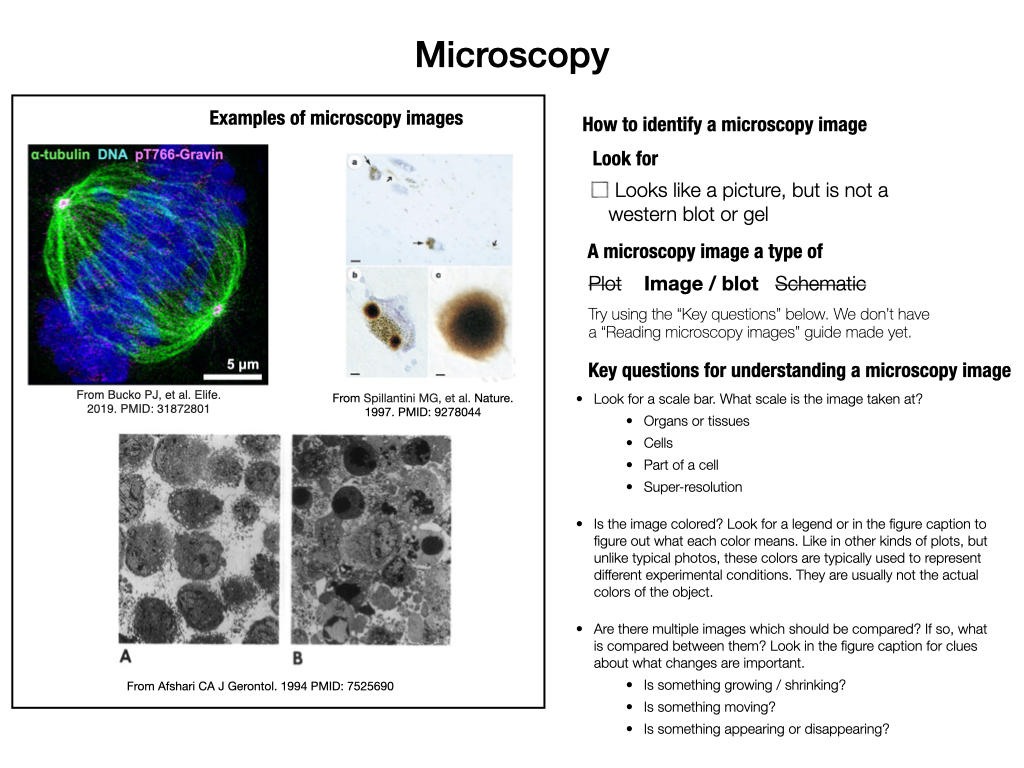
Figure 2.13: If your panel most resembles a microscopy image, try answering the “Key questions for understanding a microscopy image” above. We don’t have a guide for reading microscopy images here.
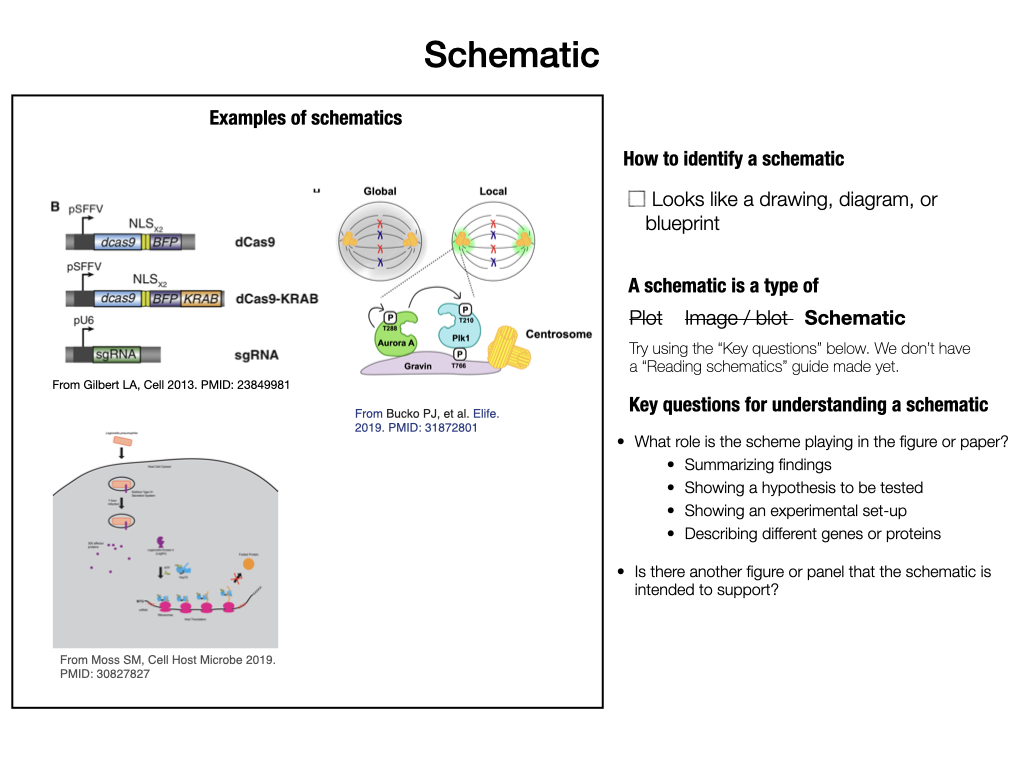
Figure 2.14: If your panel most resembles a schematic, try answering the “Key questions for understanding a schematic” above. We don’t have a guide for reading schematics yet.
2.2.2 Guides for figure reading
Use these step-by-step guides to break down the task of understanding a figure into managable pieces.
These steps are a lot more than a learning activity – don’t be fooled by the worksheet format! Forming and practicing consistent habits for reading figures is a life-long research skill. I have yet to meet a researcher who doesn’t use their own version of these steps almost every day.
You can access these figure-reading guides in worksheet form at this google slides link: https://docs.google.com/presentation/d/1ZtMzW7vDdM1CbzIniX6GwBcMoMLLUGrkbibH9K0J3O4/edit?usp=sharing
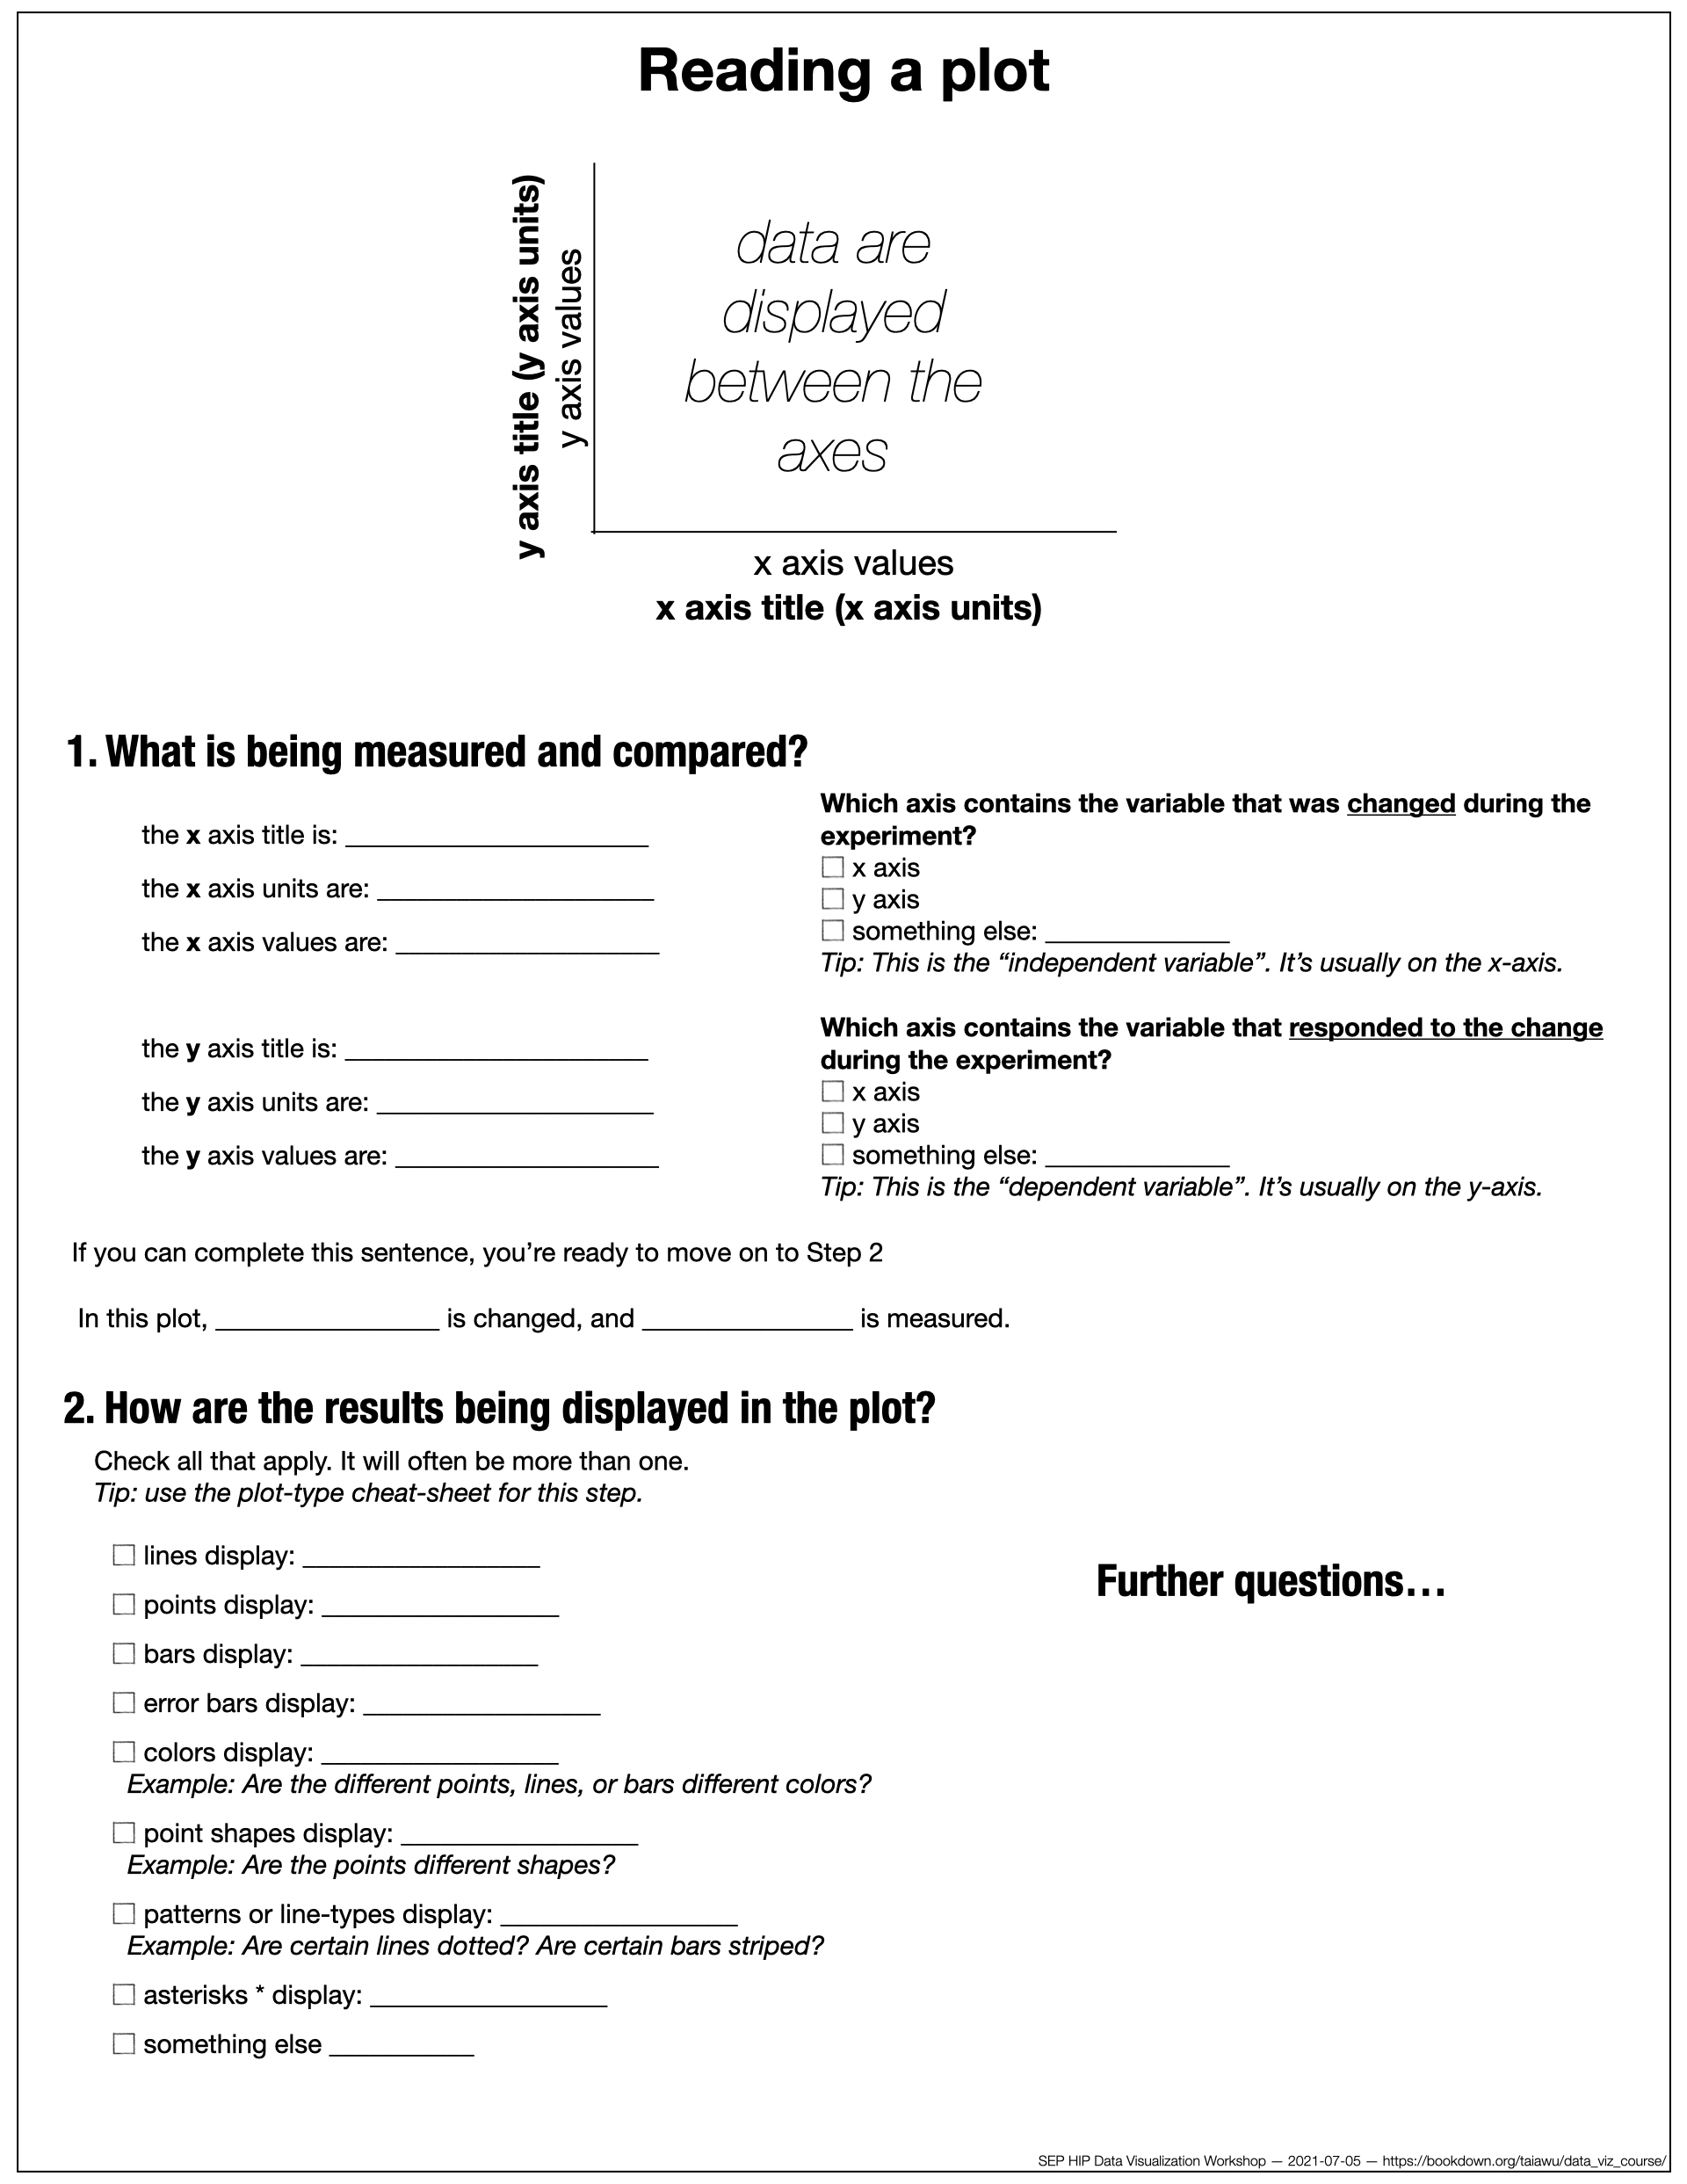
2.2.2.1 Reading plots
If the panel you chose is a plot (and not an image, blot, or scheme), use the “Reading a plot” cheat sheet below to get started. To figure out if a panel is a plot, check out the Types of figures cheat sheet.
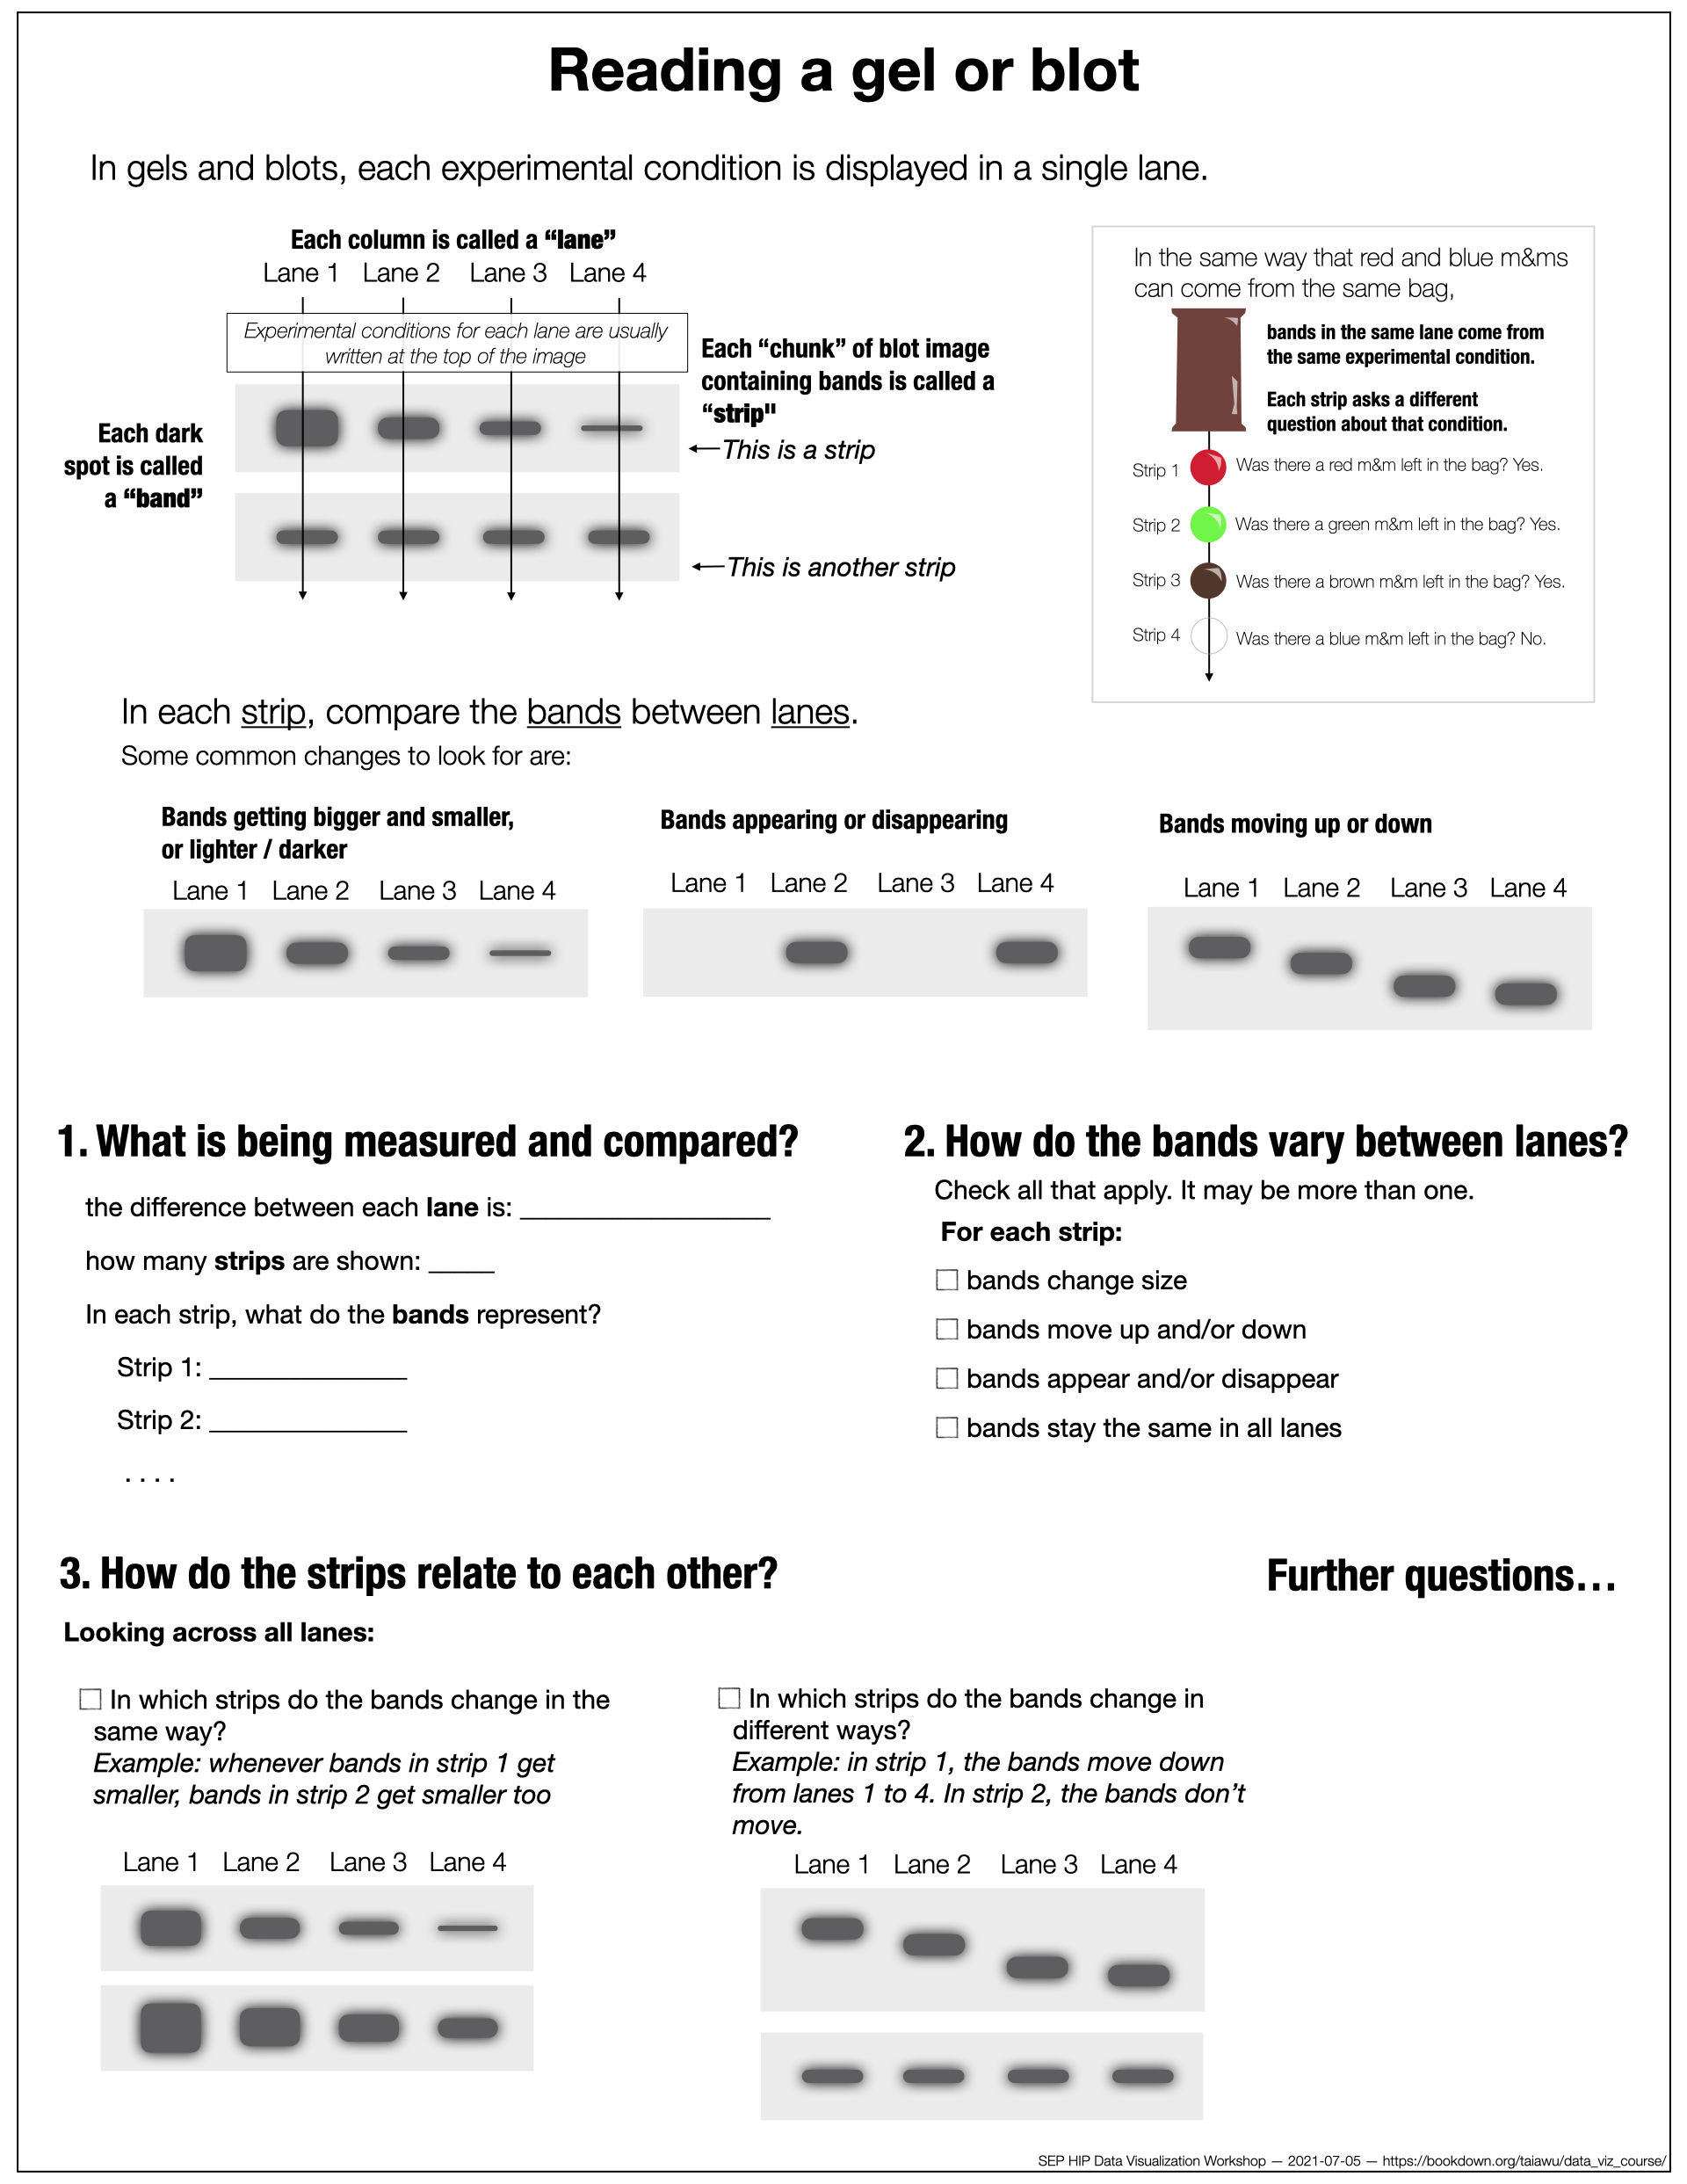
2.2.2.2 Reading blots and gels
If the panel you chose is a blot or gel (and not plot or scheme), use the “Reading a gel or blot” cheat sheet below to get started. To figure out if a panel is a gel or blot, check out the Types of figures cheat sheet.
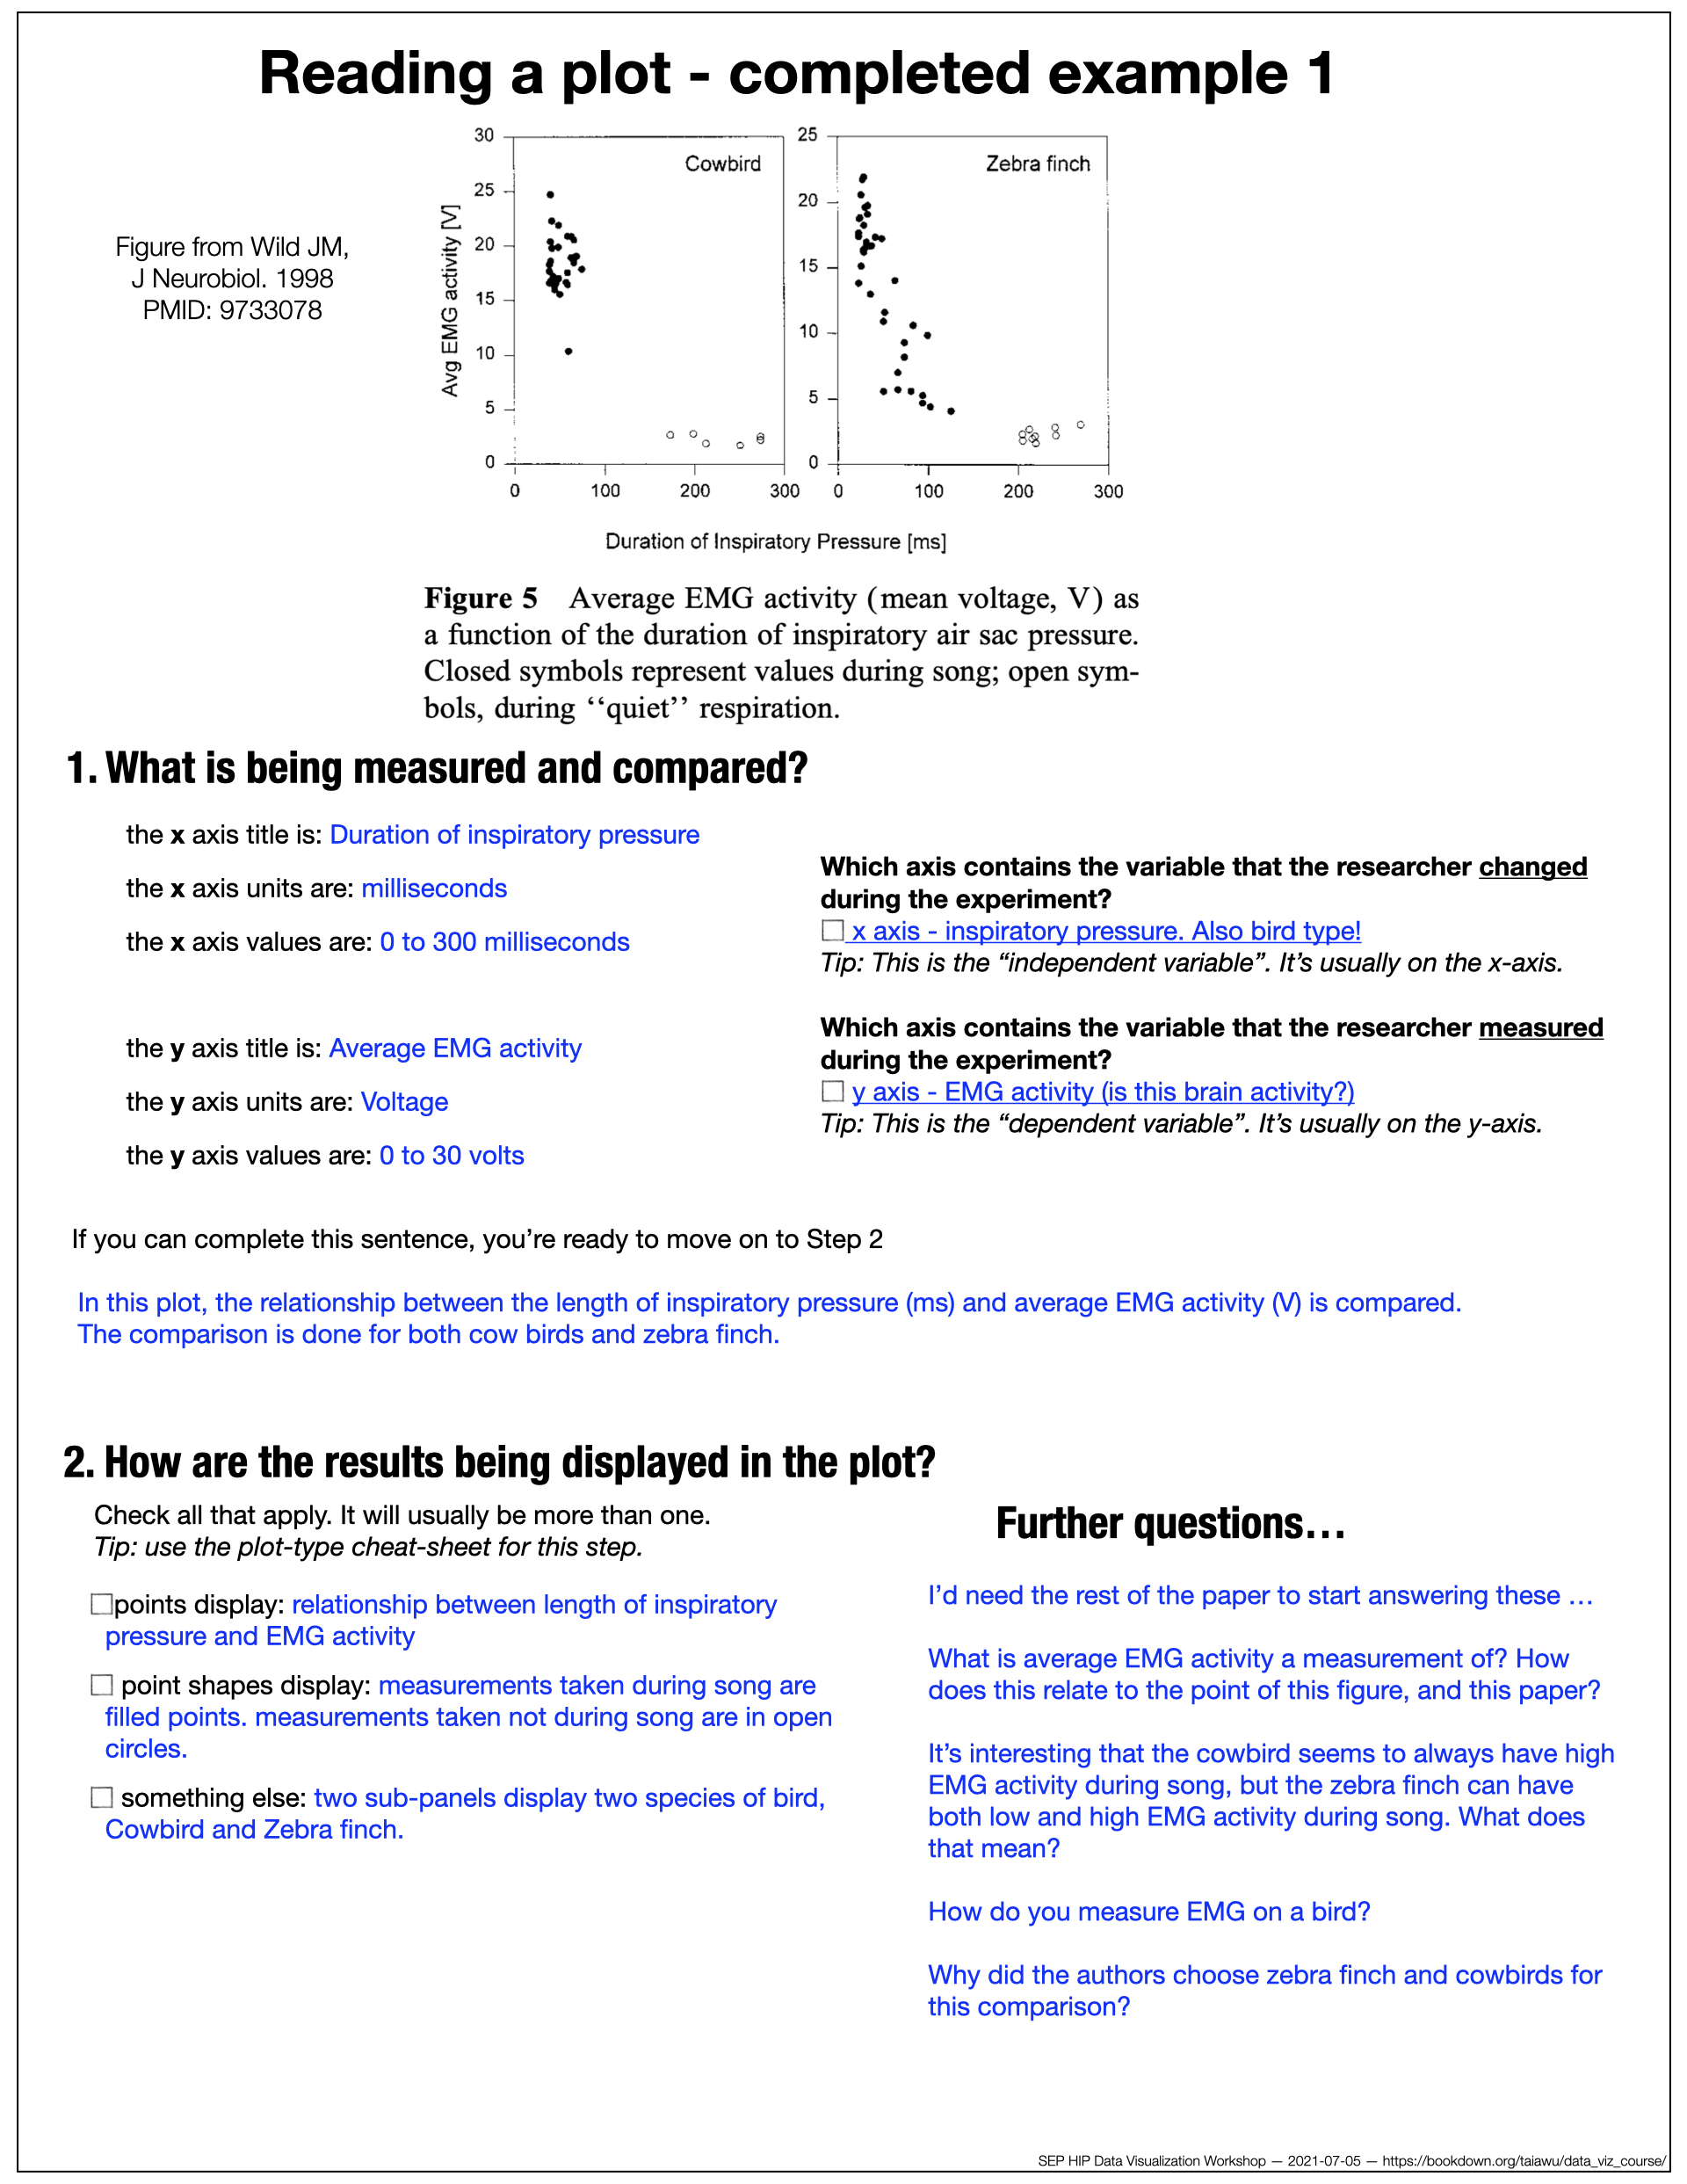
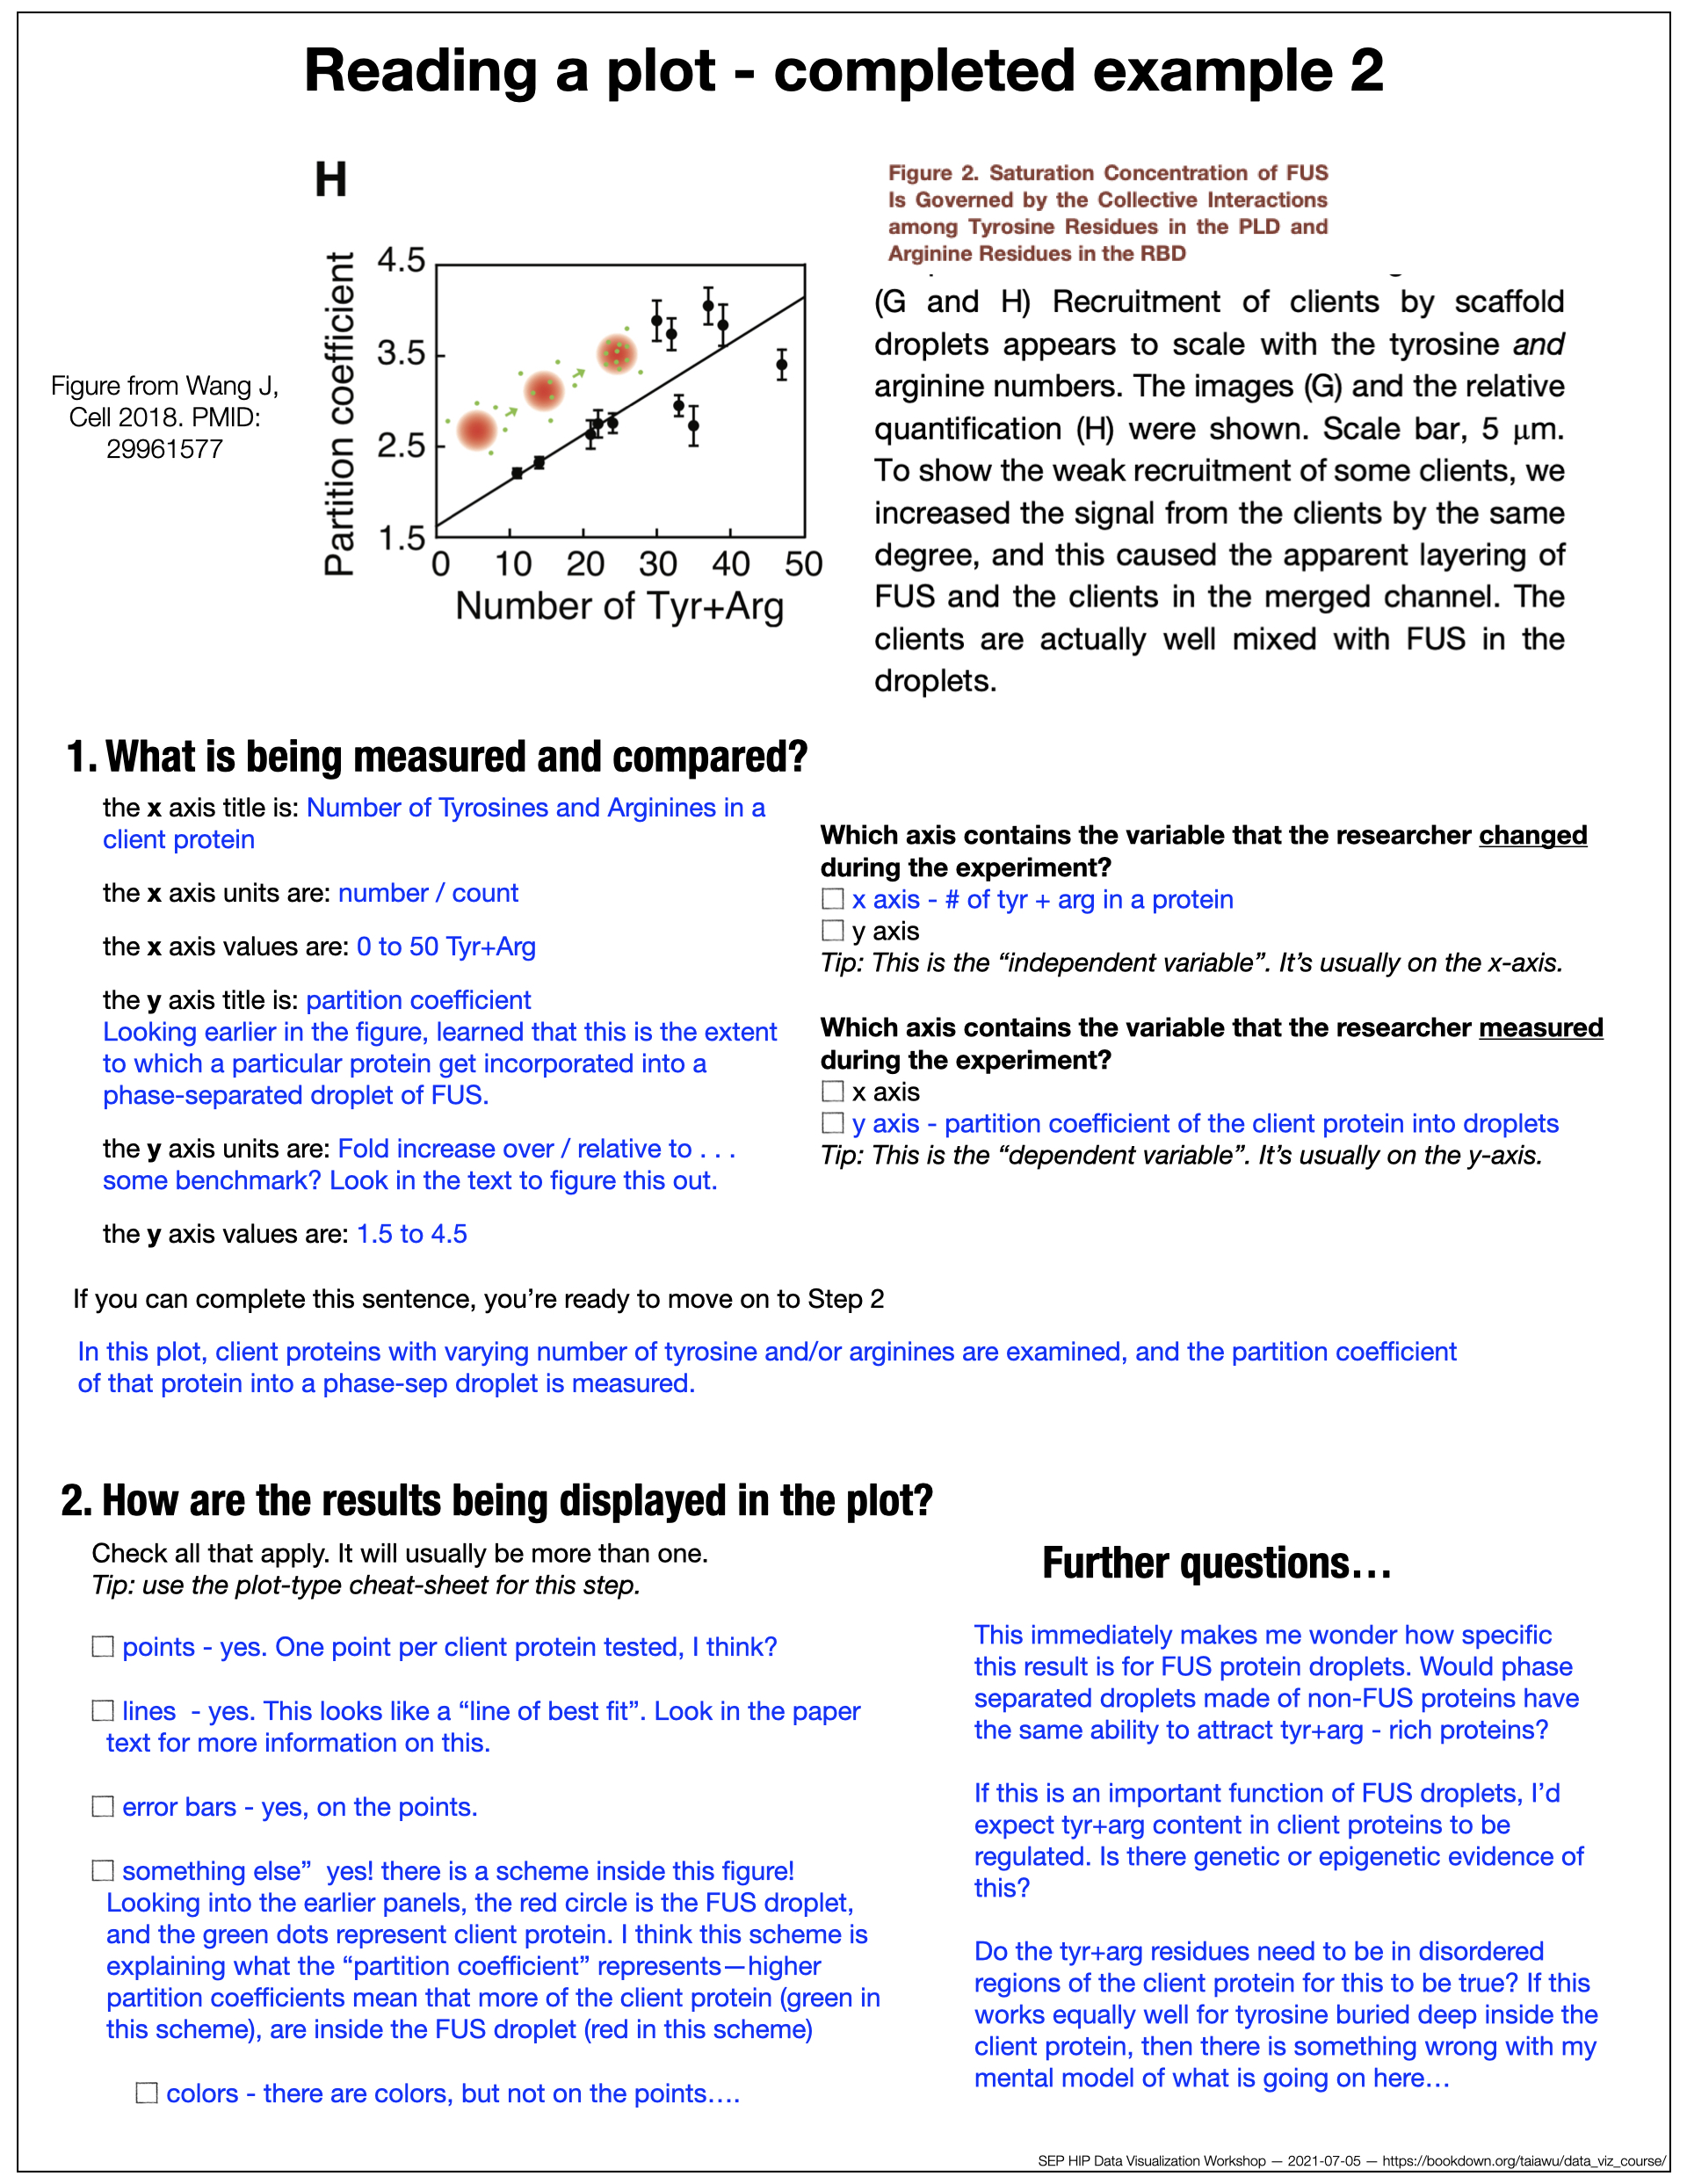
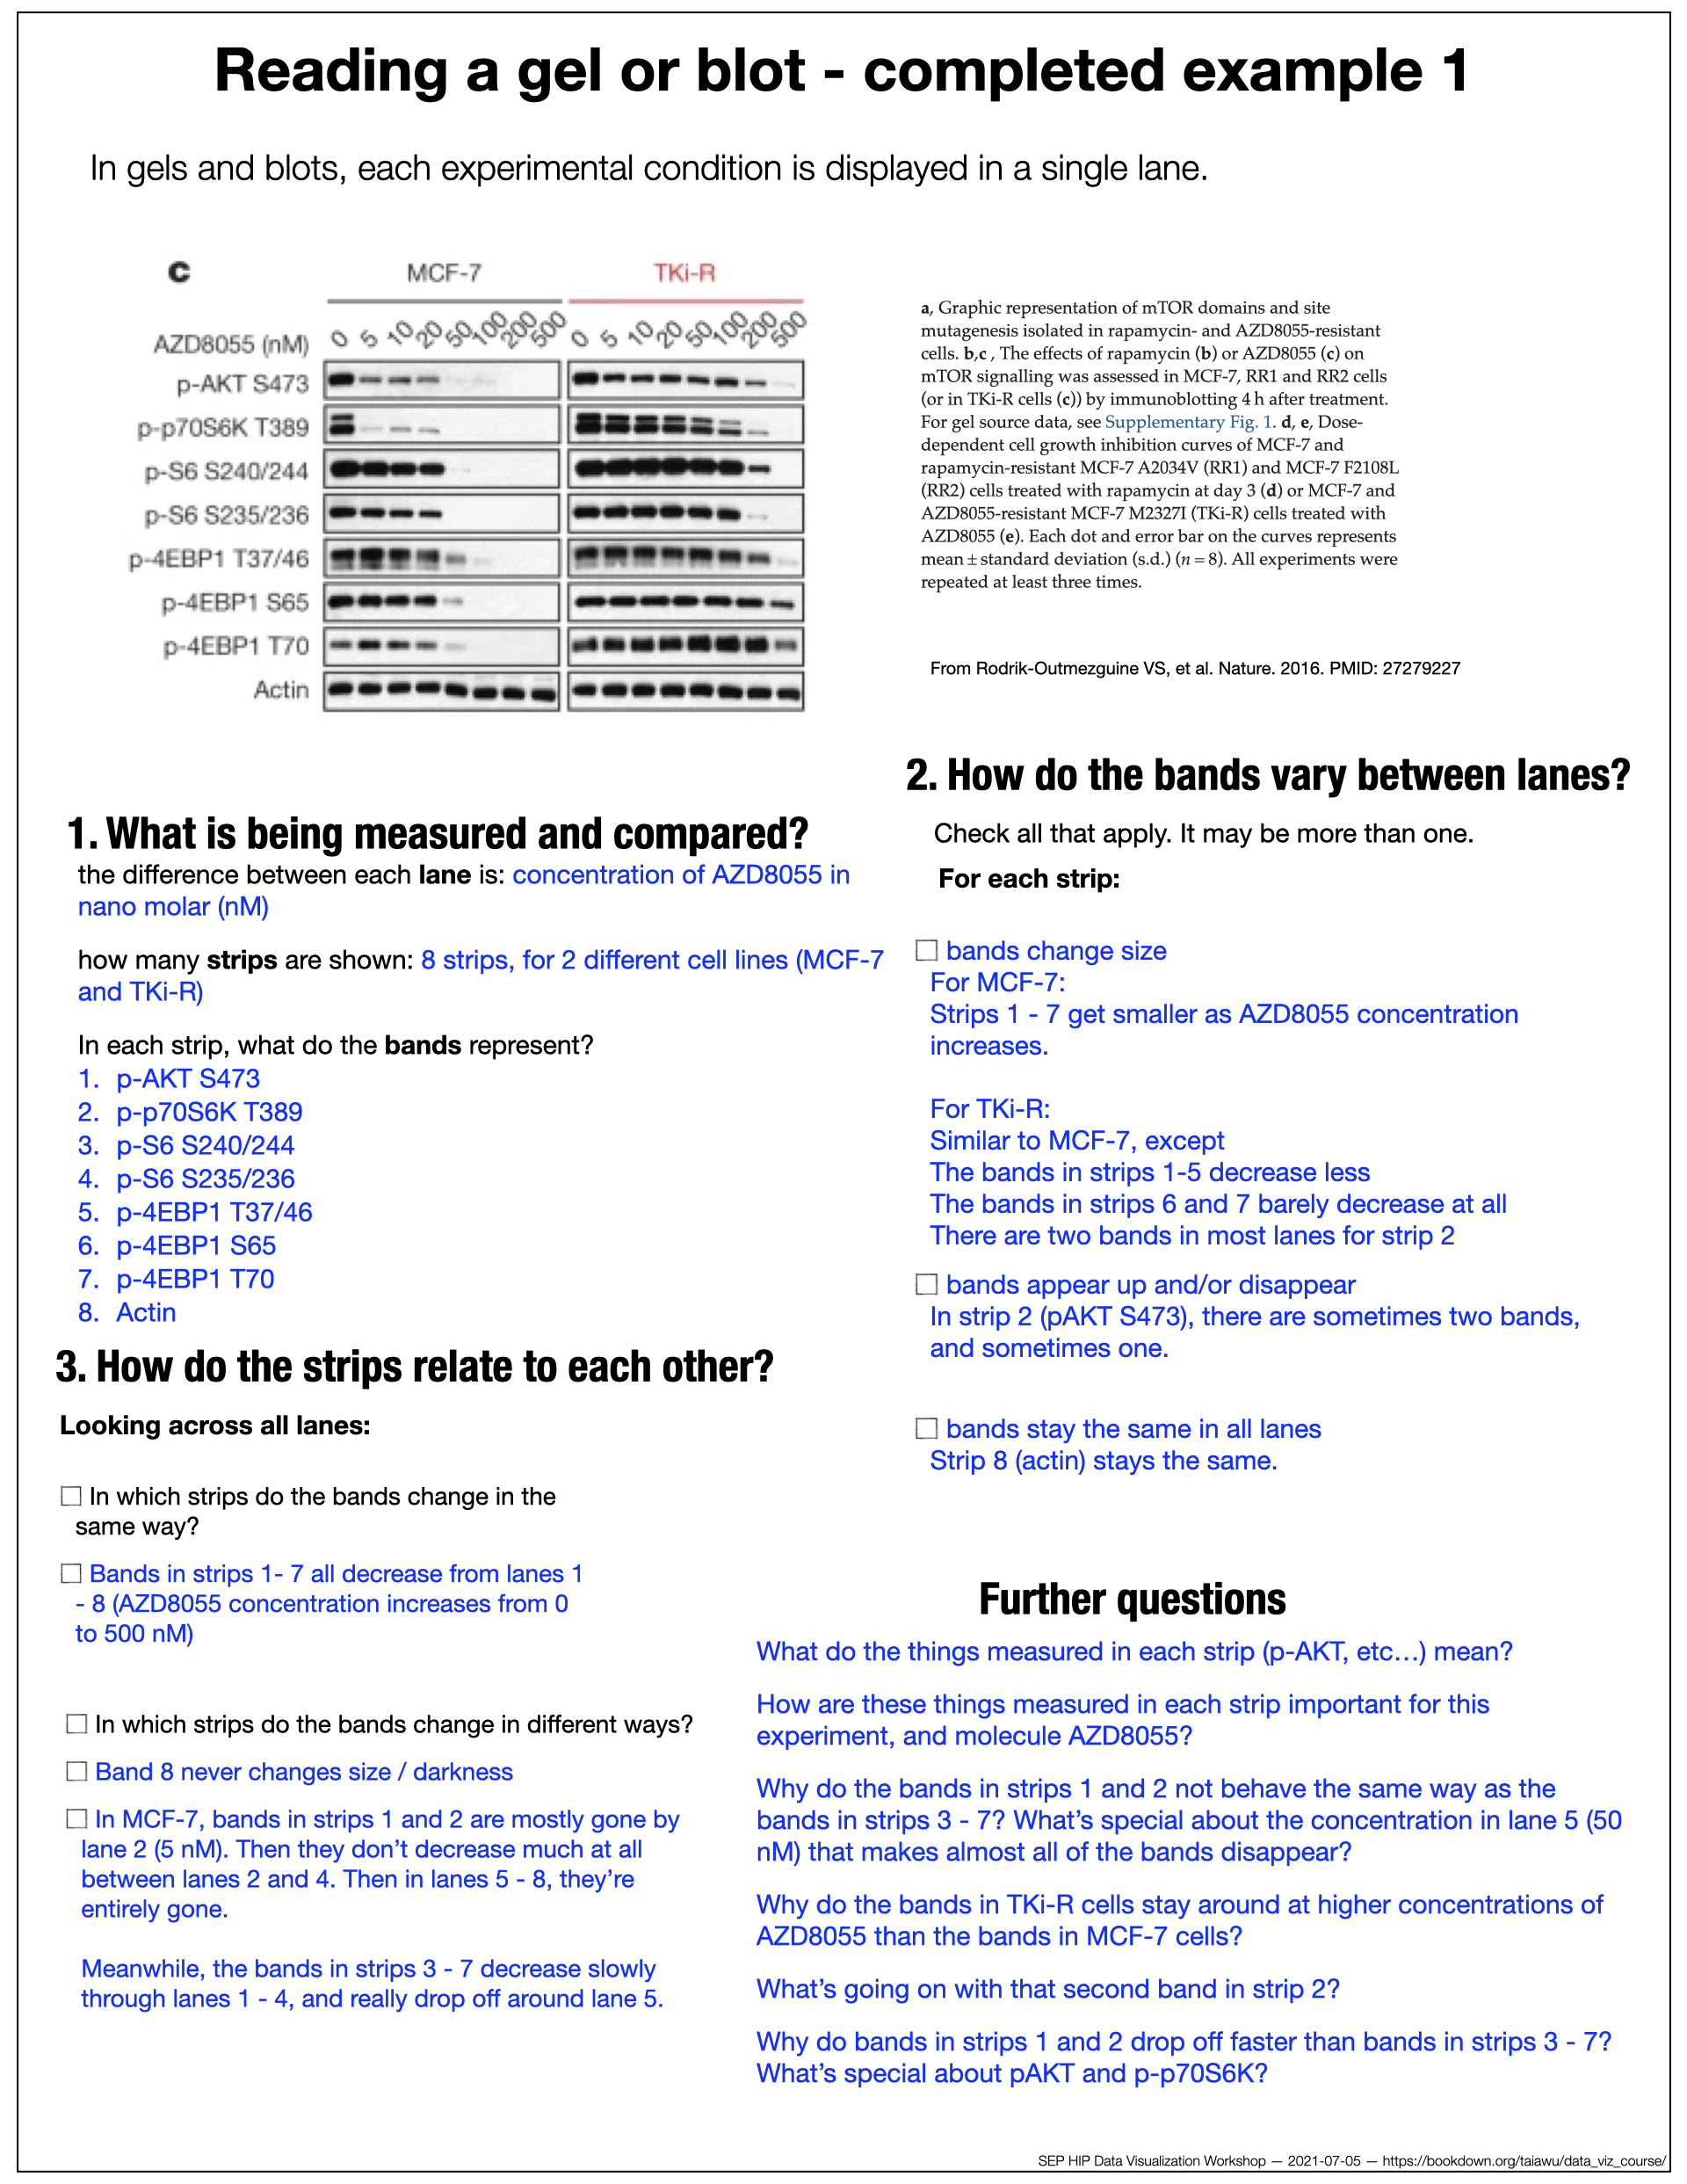
2.2.2.3 Completed examples
Here are three completed examples using the figure reading guides above.
2.3 Building habits
Figure reading gets easier with time and practice. Relecting periodically on the following two questions can help you build and personalize your habits to make figure reading as easy and enjoyable as possible!
What steps of the figure-reading process were most helpful for you? Why?
Would you add any other steps for yourself?