3 Coordinate systems
Every ggplot2 plot has a coordinate system. ggplot2’s default coordinate system is the Cartesian coordinate system.
To add a Cartesian coordinate system to a plot, you call the function coord_cartesian().
mpg %>%
  ggplot(mapping = aes(displ, hwy)) +
  geom_point() +
  coord_cartesian()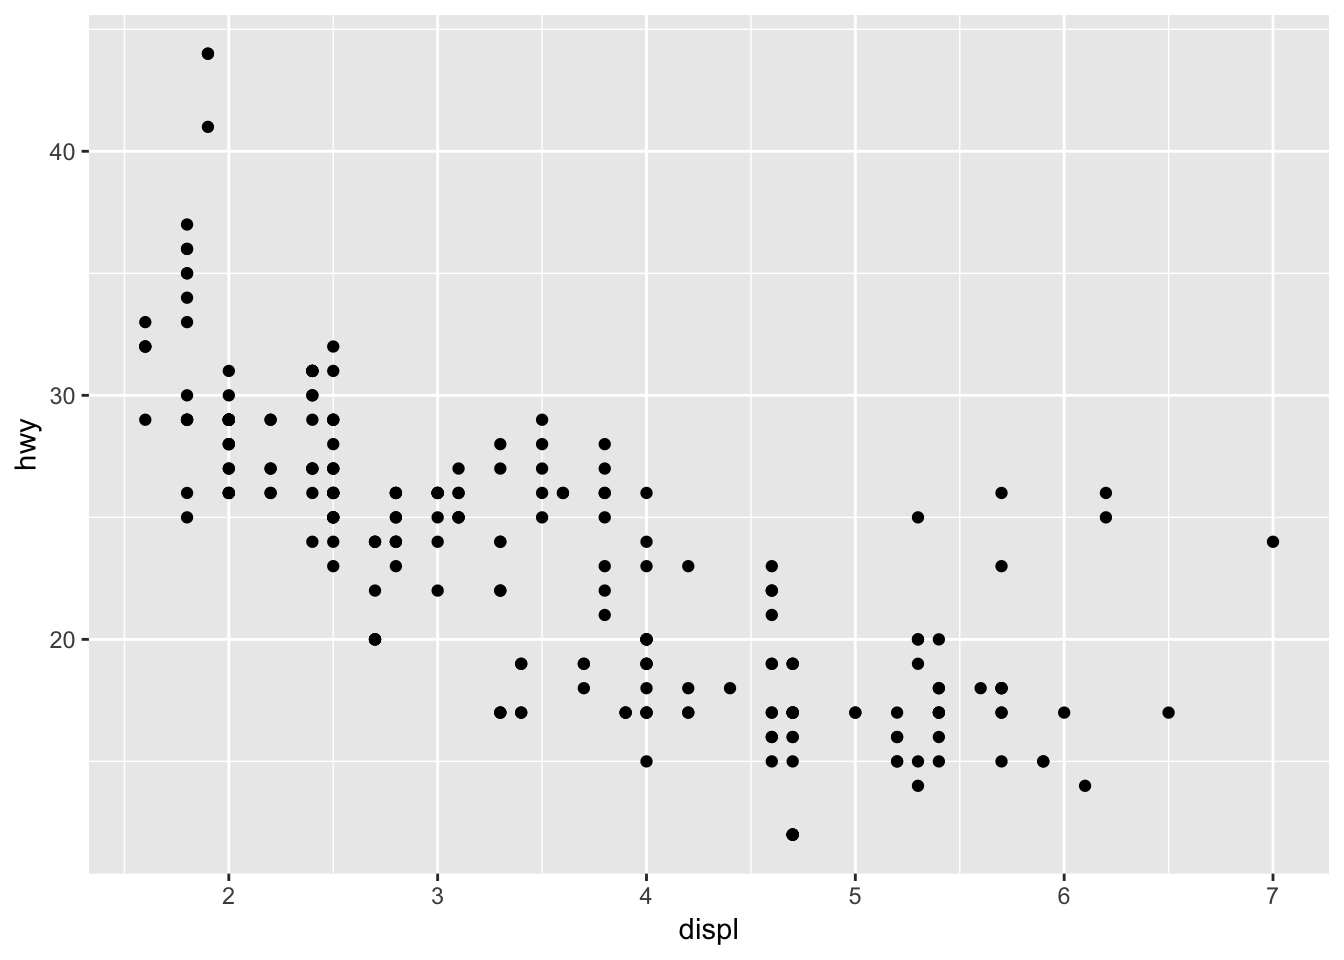
ggplot() actually calls coord_cartesian() for you. Notice that if we take away coord_cartesian() nothing changes.
mpg %>%
  ggplot(mapping = aes(displ, hwy)) +
geom_point() 
Much of the time, you won’t need to think about coord_cartesian(). However, as you’ll see in the next section, you’ll sometimes want to change coord_cartesian()’s default settings.
3.1 Zooming
coord_cartesian() contains the arguments xlim and ylim. These arguments control the limits for the x- and y-axes and allow you to zoom in or out of your plot.
For example, say we want to change the above plot to zoom in on just the cars with an engine displacement value of between 3 and 5 liters. xlim and ylim each take a vector with two values: a lower bound and an upper bound. To zoom in on 3-5 liters, we’ll set xlim = c(3, 5).
mpg %>%
  ggplot(mapping = aes(displ, hwy)) +
  geom_point() +
  coord_cartesian(xlim = c(3, 5))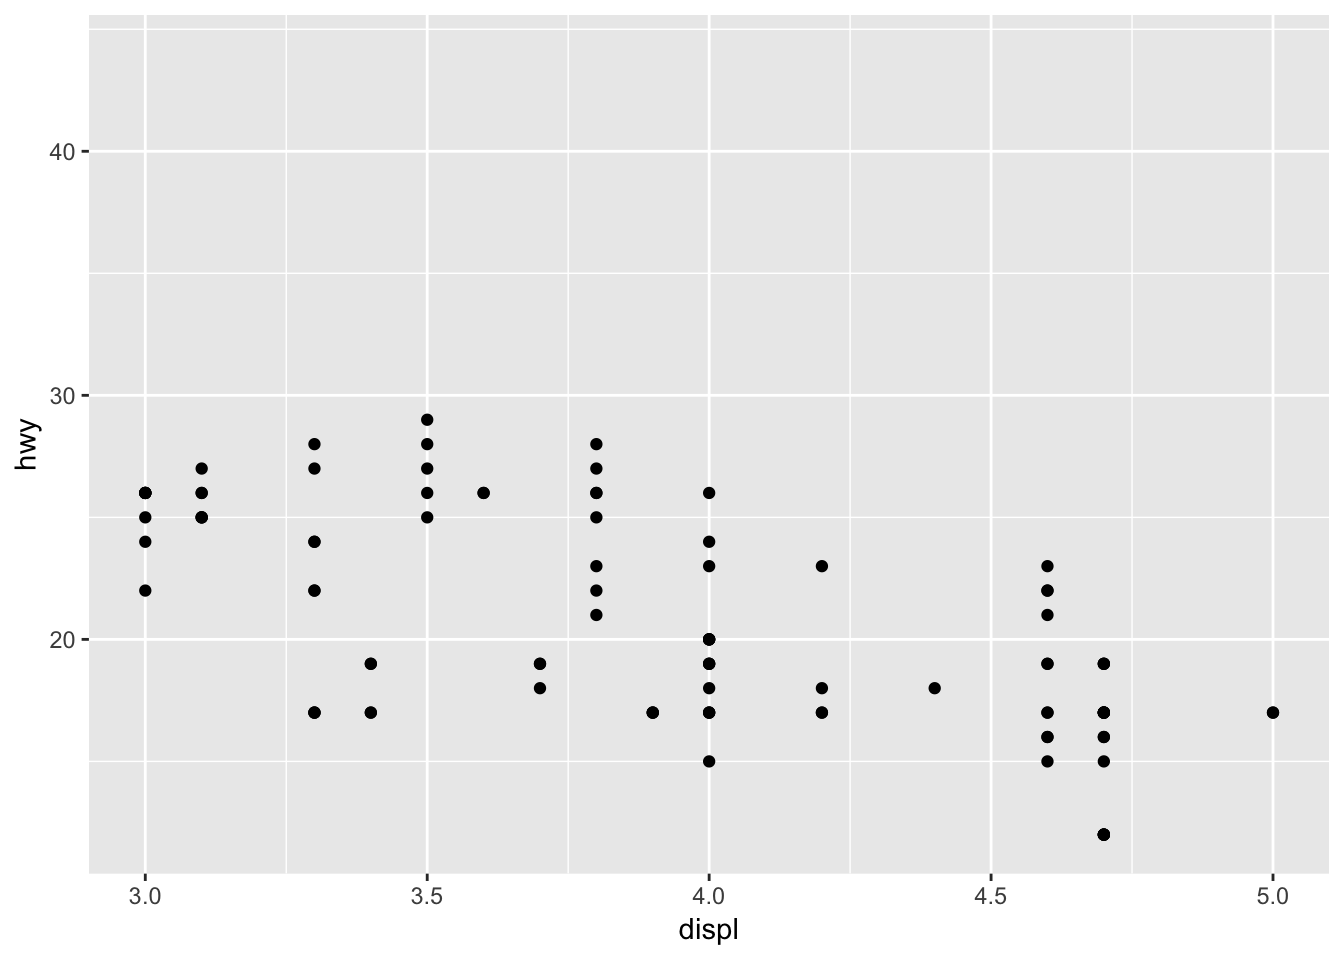
Note that zooming is not the same as removing values and then plotting. The following plot is the result of first removing all values outside our bounds, and then plotting.
mpg %>%
  filter(displ >= 3, displ <= 5) %>%
  ggplot(mapping = aes(displ, hwy)) +
  geom_point()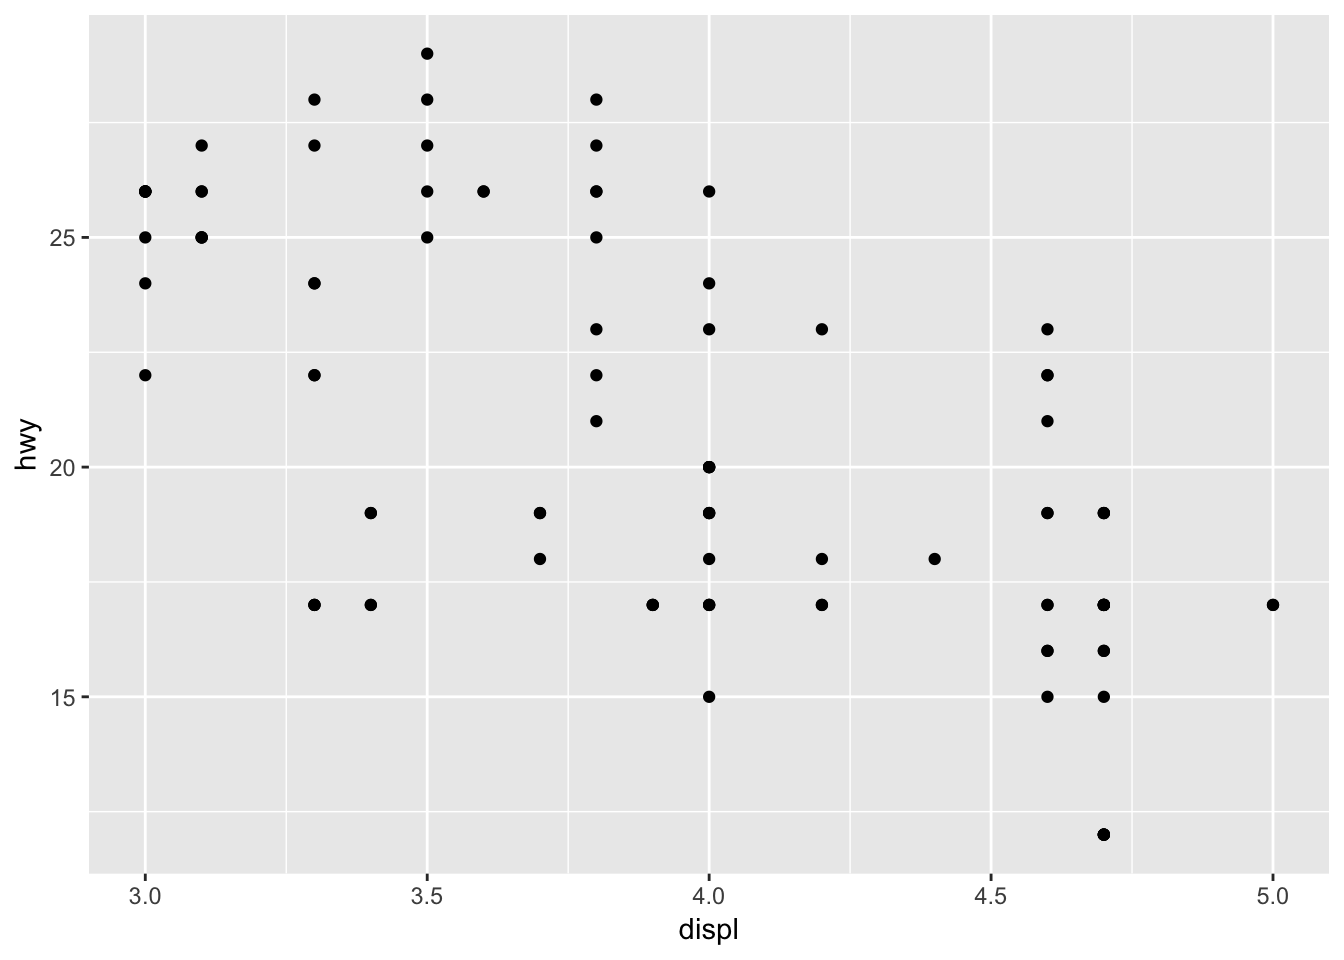
3.2 coord_flip()
coord_flip() flips Cartesian coordinates, so that the variable mapped to x is used for the y-coordinates and the variable mapped to y is used for the x-coordinates.
Compare the following plot with the default coordinate system to one with coord_flip()
mpg %>%
  ggplot(mapping = aes(x = manufacturer)) +
  geom_bar()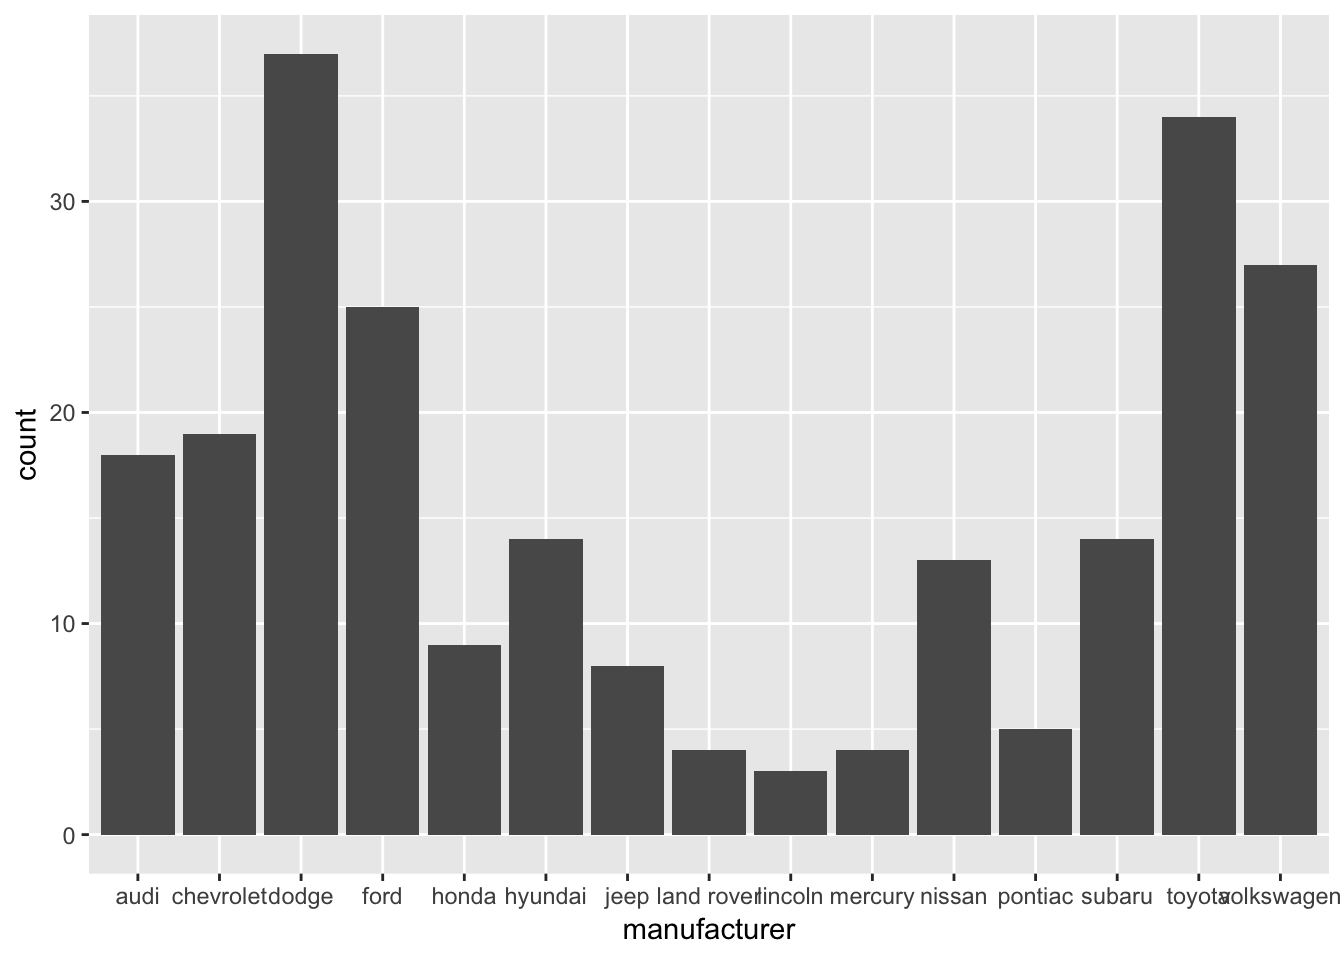
mpg %>%
  ggplot(mapping = aes(x = manufacturer)) +
  geom_bar() +
  coord_flip()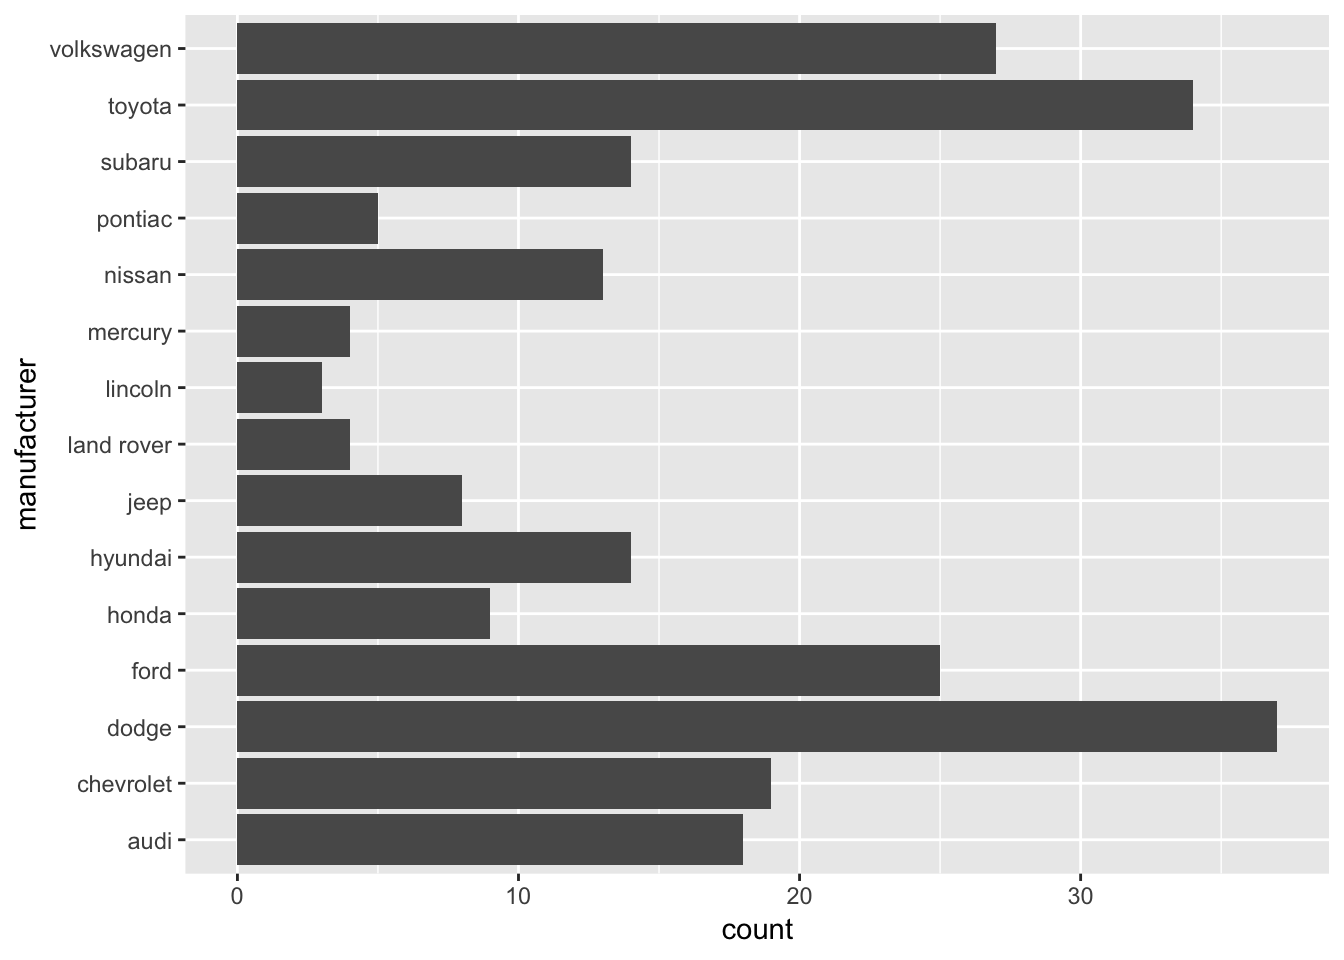
As you’ll see later, coord_flip() is useful when visualizing discrete-continuous relationships.
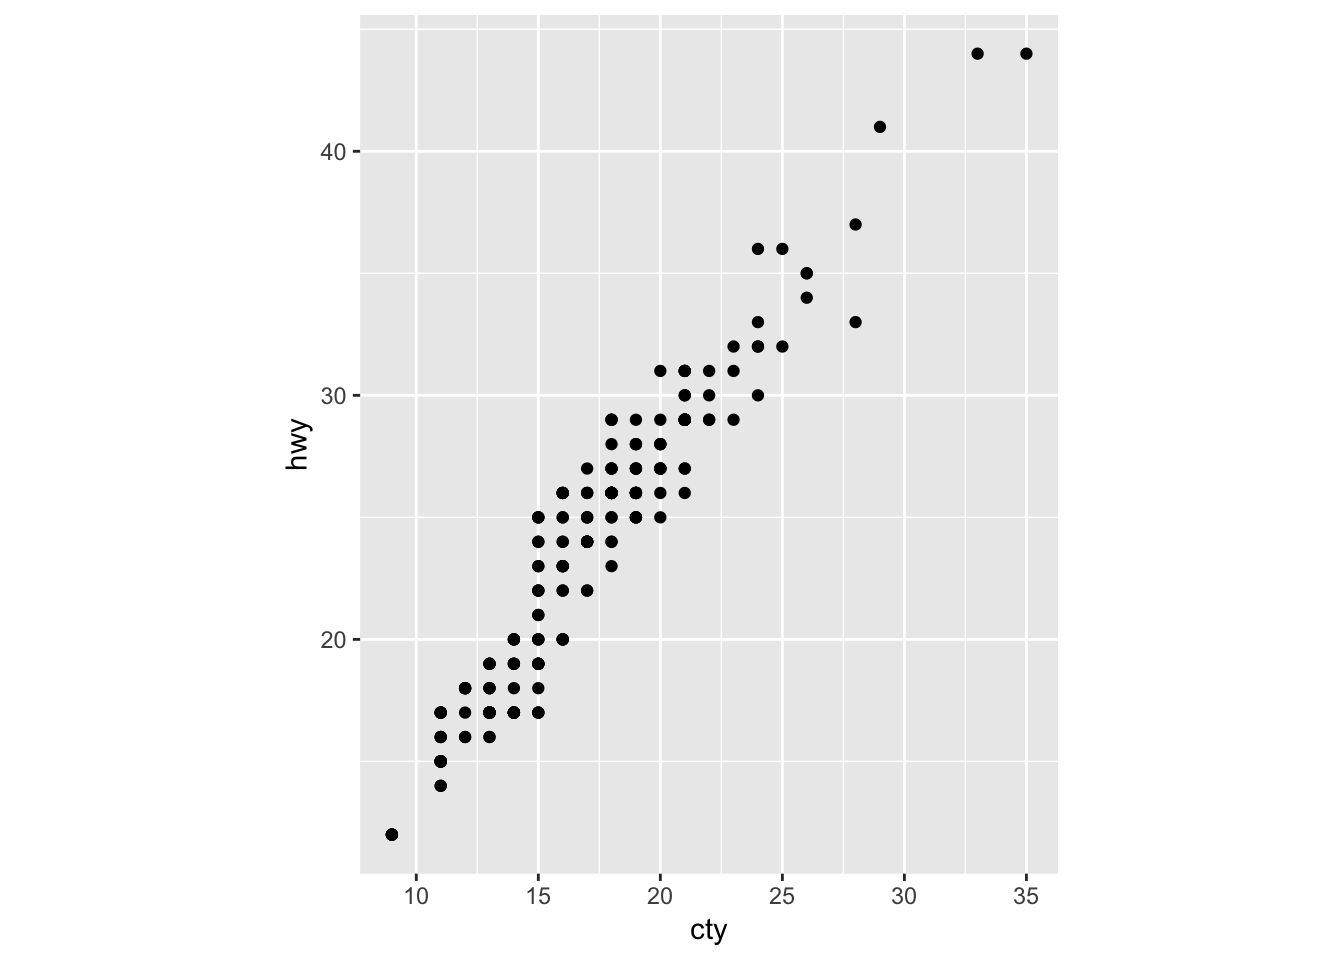
3.3 coord_fixed()
coord_fixed() creates a coordinate system with a specified aspect ratio. Most of the time, you’ll use coord_fixed() to ensure that one unit on the x-axis is the same length as one unit on the y-axis, which is important if both your axes use the same units.
mpg %>%
  ggplot(aes(cty, hwy)) +
  geom_point() +
  coord_fixed(ratio = 1)