Chapter 2 Literature
2.1 Networks Literature Review
Since arms trading data takes the form of network data, it’s important to have a comprehensive overview of the literature and format of network data in order to understand how this data may be compromised. The notation and assumptions made in this section will stand for the rest of the paper. Social network models take the form of various actors (nodes) connected through a specific relationship (edges). For example, let us denote \(Y\) as an \(n_{x}n\) matrix where each entry in the matrix represents an interaction between nations. If we examined whether two nations participated in diplomatic cooperation with each other, then our Y, also known as a socio-matrix, might look something like:
| Brazil | Canada | China | France | Germany | India | Lebanon | Mexico | |
|---|---|---|---|---|---|---|---|---|
| Brazil | 0 | 1 | 1 | 1 | 1 | 1 | 1 | 1 |
| Canada | 1 | 0 | 1 | 1 | 1 | 1 | 1 | 1 |
| China | 1 | 1 | 0 | 1 | 1 | 1 | 1 | 1 |
| France | 1 | 1 | 1 | 0 | 1 | 1 | 1 | 1 |
| Germany | 1 | 1 | 1 | 1 | 0 | 1 | 1 | 1 |
| India | 1 | 1 | 1 | 1 | 1 | 0 | 1 | 1 |
| Lebanon | 1 | 1 | 1 | 1 | 1 | 1 | 0 | 1 |
| Mexico | 1 | 1 | 1 | 1 | 1 | 1 | 1 | 0 |
This socio-matrix above displays a sample of nations and whether they engaged in diplomatic cooperation, 1, or not, 0, in 2002. Notice that along the diagonal all the values are zero, this is because nations cannot engage in diplomatic cooperation with themselves. Below is another representation of a socio-matrix, where light blue represents that the nations engaged in diplomatic cooperation and dark blue means that they did not.
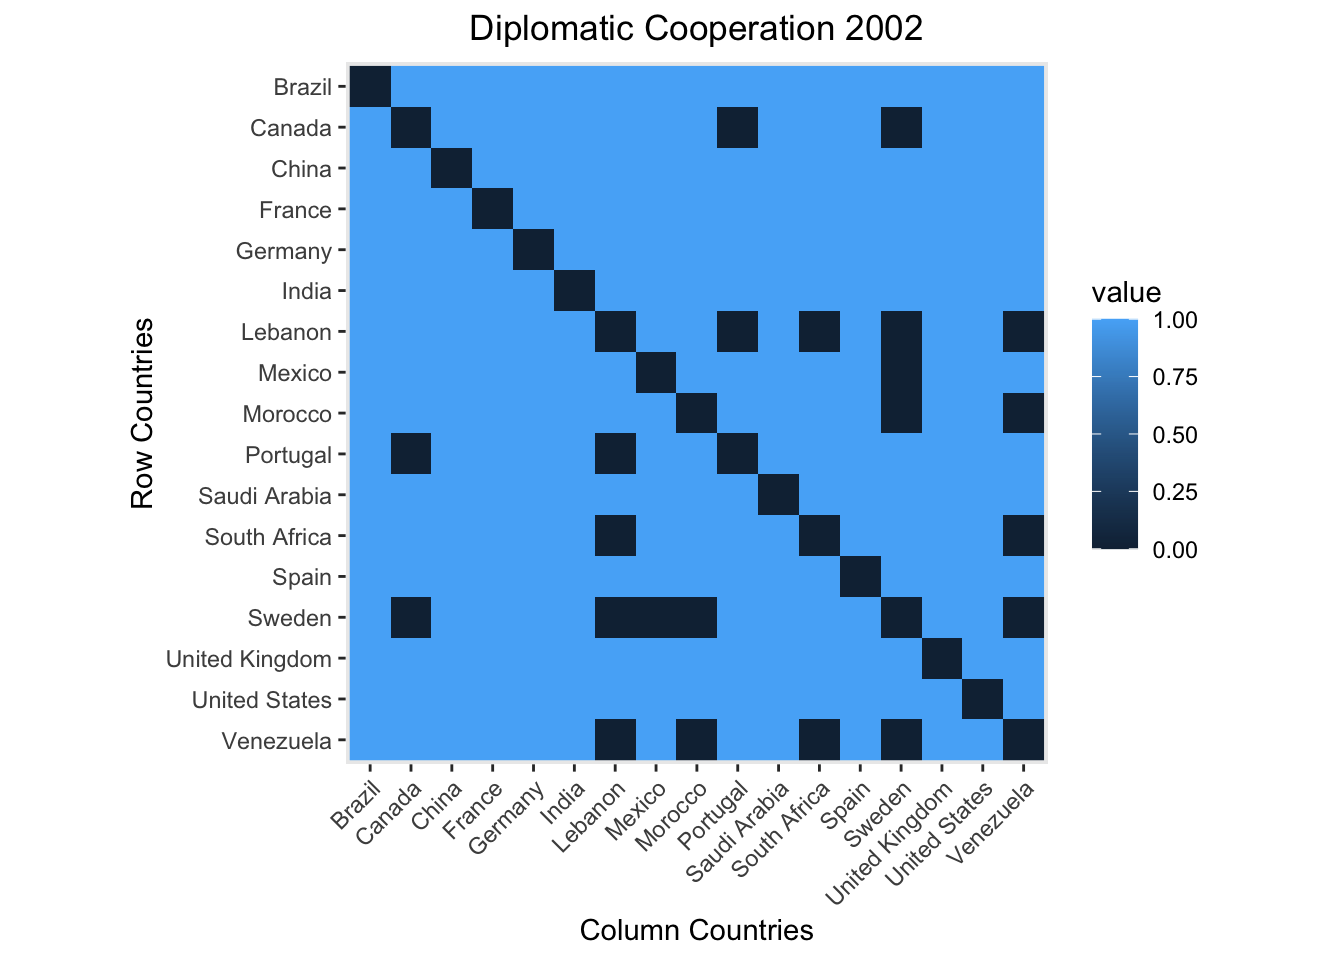
Here an entry of 1 represents that there is a relationship present. In this case, that the two nations engaged in diplomatic cooperation with each other. An entry of 0 represents a lack of a relationship. This is an example of a symmetric matrix, where \(Y_{Germany, France} = Y_{France,Germany}\). This implies that if Germany participated in diplomatic cooperation with France, then France participated in diplomatic cooperation with Germany, and thus we get a symmetric matrix, where \(Y^{T} = Y\).
In the case of most trade data, the relations are not reciprocated, hence the socio-matrices are not symmetric. For example if Germany sent arms to France, \(Y_{Germany, France}\) = 1, then it is not necessarily true that France sent weapons to Germany, and \(Y_{France, Germany}\) could take the value of either 1 or 0. Networks of this type are labeled as directed, and in this case our socio-matrix may take the form of:
| Brazil | Canada | China | France | Germany | India | Lebanon | Mexico | |
|---|---|---|---|---|---|---|---|---|
| Brazil | 0 | 1 | 0 | 1 | 1 | 1 | 1 | 1 |
| Canada | 1 | 0 | 1 | 1 | 1 | 1 | 0 | 0 |
| China | 0 | 1 | 0 | 1 | 1 | 0 | 1 | 1 |
| France | 1 | 1 | 0 | 0 | 1 | 1 | 1 | 1 |
| Germany | 1 | 1 | 1 | 1 | 0 | 1 | 1 | 1 |
| India | 0 | 1 | 1 | 0 | 0 | 0 | 1 | 0 |
| Lebanon | 0 | 0 | 0 | 0 | 0 | 0 | 0 | 0 |
| Mexico | 0 | 1 | 0 | 1 | 1 | 0 | 0 | 0 |
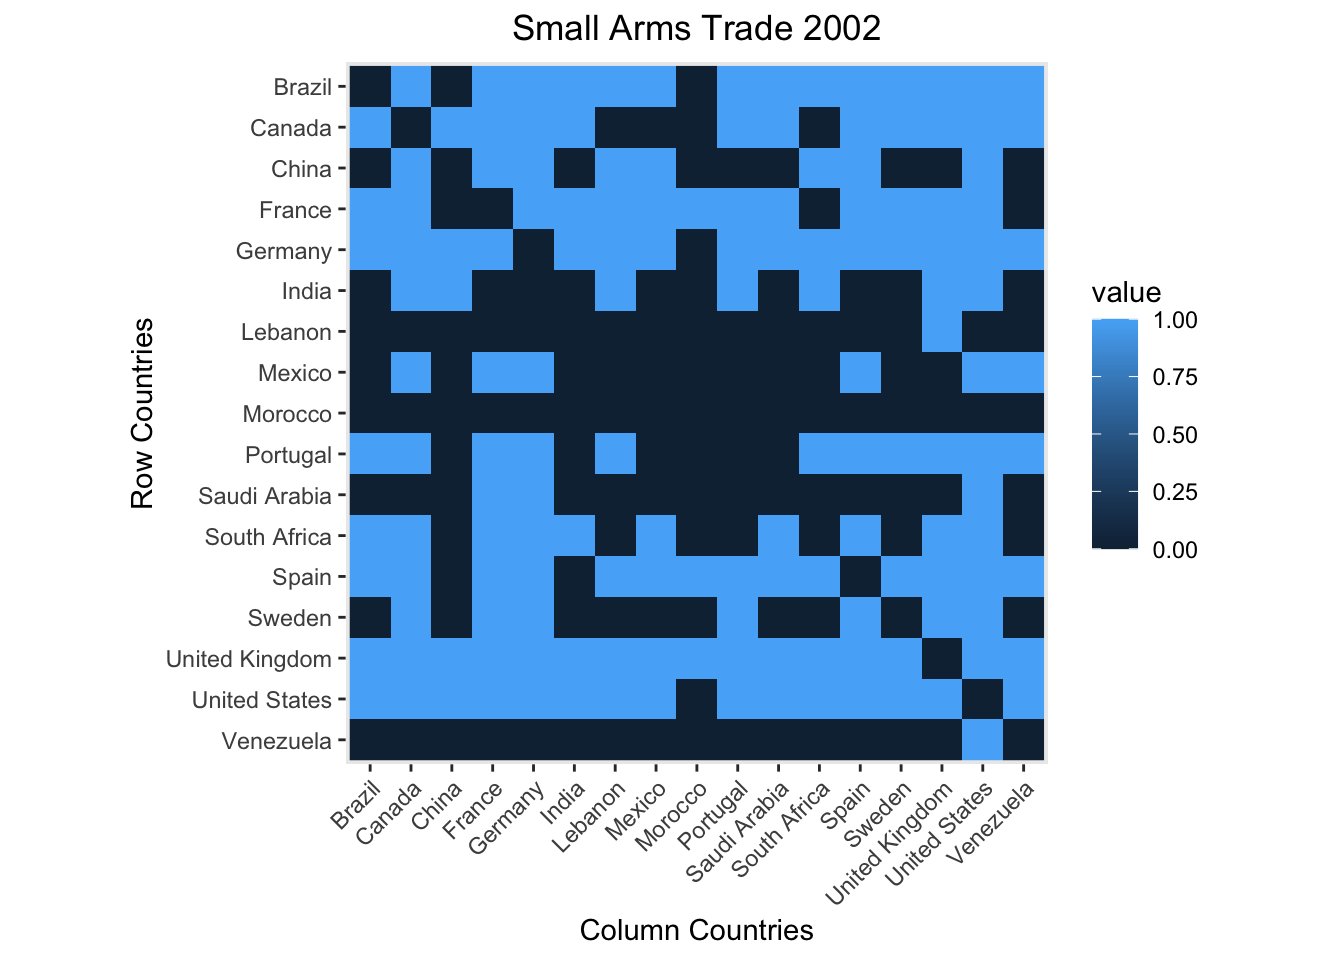
This socio-matrix above contains a sample of nations and whether or not they sold arms, 1, or not, 0, and whether they bought arms, 1, or not,0, in 2002. Below is another visual representation of the socio-matrix.
These relationships, \(y_{i,j}\), denote the relationship from actor i to j and can be visualized in the form of a network graph where each node represents an actor, and each edge represents a relationship (directed or non-directed, weighted or non-weighted) between the actors. Below is an example of a network graph, where the nodes are a sample of nations, and the edges represent that an arms trade occurred in the year 2002. This contains the same information as the previous socio-matrix but is a different visual representation.
In the network graph above, the nodes represent the nations, and the edge between nodes represents that arms trading occurred between them. You can interact with the graph.
When outcomes are continuous, relationships and data of this type can be modeled with a similar approach to linear regression:
\(y_{i,j} = \beta^{T}x_{i,j} + \epsilon_{i,j}\)
Here, \(x\) represents an array of covariates, and \(\epsilon\) is the error, which is potentially non-independent. The co-variates can be on a nodal or dyadic level. For example, on the nodal level this can be information about actors such as GDP for a country. Dyadic covariates, however, take the form of a socio-matrix.
In the case of binary data, we represent this type of data in the following form.
\(z_{i,j} = \beta^{T}x_{i,j} + \epsilon_{i,j}\)
Where \(z\) represents some continuous latent variable, and implementation of an indicator function will determine which entries of \(z\) will be represented as 1s and which ones will be 0s: \(y_{i,j} = 1(z_{i,j}>0)\)
Thus in this case, the entries of \(z_{i,j}\) that are greater than 0, will become 1.
However, there were growing concerns over the applicability of these linear models, given that they fail to take into account dependencies present in dyadic data. Since the \(\epsilon\) is not necessarily independent, we can’t simply vectorize the data as there is structure and dependency we want to account for. If data is sufficiently structured, then it can give us insight into how one can better estimate parameters.
If we consider the heterogeneity present in the rows and columns of the dyadic variables, then if the rows represent the countries who are exporting goods and the columns represent the importers, we would expect there to be difference among how much each nation sells and how much nations are purchasing. These are considered second order dependencies, which capture reciprocity and within-actor correlation (Hoff & Ward, 2004). These row, column, and dyadic effects take the following form.
\(\epsilon_{i,j} = a_{i} + b_{j} + \gamma\)
Where,
\[\begin{pmatrix} a \\ b \end{pmatrix} {\sim Normal} \begin{pmatrix}0 & , & \sigma^{2}_{a} & \sigma^{2}_{ab} \\ 0 & & \sigma^{2}_{ba} & \sigma^{2}_{b} \end{pmatrix}\]
\[\begin{pmatrix}\gamma_{i,j} \\ \gamma_{j,i} \end{pmatrix} {\sim Normal} \begin{pmatrix}0 & , & \sigma^{2}_{\gamma} & \rho\sigma^{2}_{\gamma} \\ 0 & & \rho\sigma^{2}_{\gamma} & \sigma^{2}_{\gamma} \end{pmatrix}\]
Hoff (2002) took a latent space approach to social network analysis expanding upon the Stochastic Block Models (SBM) method of clustering. Hoff discusses the concept of a social space consisting of latent characteristics representing transitive tendencies within the network. Incorporating a third order dependence allows for the ability to differentiate between ingroup and outgroup ties, by using transitive tendencies to represent latent characteristics of nodes and edges (Hoff, 2002). An example of transivity in context of arms trading can be shown if we consider three nations, A, B and C. Provided that A and B are trading together, then if B and C are trading together this impacts the probability that A and C are trading together.
Within international relations there are dependency structures that should be accounted for. One approach considers multiplicative effects which uses inner products of latent unobserved characteristic variables, and hence is able to incorporate third-order dependencies into the model (Hoff & Ward, 2004). These third order dependencies let us observe clustering properties such as transitivity and balance. This social relations regression model takes the form of:
\(\epsilon_{i,j} = a_{i} + b_{j} + \gamma_{i,j} + z^{`}_{i}z_{j}\)
where \(\gamma_{i,j}\) is the dyadic error and remains independent of the bilinear and random effects, and \(z^{T}_{i}z_{j}\) are the third-order dependencies.
The goal is to explore if we can detect misreported information, and in the cases where data had been misreported, understand how we can leverage the structure to better estimate parameters; therefore, it is important to consider various summary statistics and parameters that we think may be altered by corrupt data and how they may be impacted by corrupted data.
Degree Distribution
The degree of a node refers to the number of relationships that node has to other nodes. The degree distribution is the distribution of the degrees of all the nodes in the network. When considering directed networks, we can differentiate between in and out degrees. In degrees are the number of relations that point towards that node, while out-degree is the number of relations that originate at that node and point outward. This introduces the concepts of sociability and popularity. Considering the arms trade, a country would be considered sociable if it exported weapons to a large number of nations, and thus have a high out-degree. A country would be considered popular if it imported weapons from a large number of nations, and therefore possess a high in-degree.
We predict when nations underreport the number of weapons transferred then nations will appear to have less connections to other nations, and thus the number of degrees within that distribution will decrease, making the network seem scarcer than it truly is.
Triangle Count
A triangle, in the context of networks, refers to a cluster of three nodes that all have a relationship to one another. Counting triangles is a clustering algorithm and refers to the number of triangles that a node is a part of. Underreporting of arms may cause the network to appear less connected and change the structures of clusters in the network.
Betweenness
Betweenness measures how often a node lies the shortest on the path between other nodes. Nodes with high betweenness may have higher control over the network as more information, or goods, passes through it. If nations are underreporting their arms transfers then we would expect their betweenness to decrease, and thus it would seem as though they have less control over the network than they truly do.
Eigen Vector Centrality
This type of centrality is based upon the idea that important nodes are connected to other important nodes. Hence, if a nation is underreporting their arms, then they might seem less influential or less central to the network than they actually are.
2.2 Arms Trade Literature Review
In the previous section we saw that arms trading data has a directed and weighted structure, and thus an effective method to capture this information is through social network models. There has been very limited work within the political science literature to understand when and what nations have been trading illegally and even less work within the statistical science literature to address these issues.
Much of the previous work that has been done in examining the illicit arms trade has been through explanatory data analysis, case studies, and policy recommendations. The nature of the illicit arms trade and the reasons why states engage in the illicit arms trade has altered over time. If we consider the period of the Cold War, illicit arms trading was motivated by ideological and policy fears (Phythian, 2000). It was used as a tool to undermine nations with opposing ideologies. However, after the fall of the Soviet Union, the arms trade became relatively depoliticized and became a source of profit for many nations, nonstate actors, and regions fueling regional, ethnic, and religious conflicts (Phythian, 2000). Arsovka (2008) further describes the various methods and motivations for engaging in illicit arms trading, specifically within the Balkan region, such as profit for criminal groups, arming of individuals for terrorist or criminal related activities, and state engaged illicit arms trading. They note the importance of considering the multiple motivations for nations engaging in the illicit arms trade such as economic, social, cultural, and political reasons. This trend of changing relations in the small arms trade following the end of major military interventions and de-escalation of conflicts is also observed in the Middle East upon the intervention of the United States and throughout the gradual removal of the United States presence in the region (Bichler & Malm, 2013). Changes in the out-degree distributions and transitivity in the Middle East during the period of 2003-2008 imply that fractions are forming with a few key actors.
Other work has been done by the United Nations and other governmental research agencies who have made policy recommendations as to how to address illicit arms trading. These include recommending states’ need to adhere to embargos and punish those who don’t and strengthen monitoring of legal sales, so they don’t get diverted to illegal or black markets (Stohl, 2004). There have also been acts by the United Nations and member nations to increase transparency of arms trading. The Arms Trade Treaty (ATT), which was put into place in 2014, has the goal of regulating arms transfers from small conventional weapons to large combat machinery. The United Nations acknowledges that the possession of weapons within a country’s security force is essential in maintaining the order and protecting the rights of its citizens. However, it is of the upmost importance that nations ensure that the transfer and storage of the weapons are done so with the highest security (UN Office for Disarmament Affairs). The ATT attempts to address these concerns by requiring countries to implement a variety of measures to increase the transparency of arms transfers. Nations, under the ATT, are expected to establish a system to control exports, regulate imports and trans-shipments, and regulate brokering (United Nations Office for Disarament Affairs). While this body of work greatly increases our understanding in the motivations of actors to engage in illicit arms trading and the conditions that promote illicit arms trading, they fail to show us how we can tell when illicit trading is occurring and how this impacts our inference. It’s difficult to make policy recommendations when it’s unclear where illicit arms trading is occurring, when it is occurring or to what extent it is occurring. How can we punish states who are breaking arms embargos if we can’t identify those who are breaking them? In order to efficiently allocate resources to addressing and stopping illicit arms trade we need to first understand the structure of the market.
Economic models have been used to see how fluctuations in stock prices may indicate possible illicit arms trading. By analyzing nations that were under arms embargos, it may provide insight as to who may have violated these sanctions by purchasing or selling arms. The assumption is that if a company is not partaking in illicit arms trading, then an increase in hostilities should either not affect the stock price or cause the stock price to decrease as it may lead to a prolonged embargo. However, if the company is engaging in the illegal arms trade then an increase in hostilities will increase the demand for weapons and in return may increase their stock price. Companies located in areas of high corruption and low transparency see an increase in their stock prices after an event that increases conflict intensity (DellaVigna, Stefano, & Ferrara, 2010). Looking at arms embargos provides a clearer method of hypothesizing what nations may be buying illicit arms. Arms embargos have the goal of decreasing the military activities of nations by cutting off a supply of power. Though reported arms trades typically decrease after the implementation of an embargo, illicit trading may occur and undermine the initial goals of the embargo (Brzoska & Lopez, 2009).
Arms embargos are typically placed upon nations where armed conflict or crimes against humanity are occurring or have occurred. These restrictions can create a large demand for arms, and for bordering nations this can provide an opportunity to engage in an illicit market with greater ease than nations who are geographically more distant. Radford (2013) finds that if nations that have at least one neighboring country with an embargo this leads to a 38% predicted increase in the number of small arms and light weapons imports. This provides evidence that neighboring nations may be importing a greater number of weapons to divert these weapons for resale in the embargoed nations.
As described above, international relations have a multitude of dependency structures and these are seen within the arms trade as well. Arms trade can capture latent features of relationships. Arms trading dyads have a very specific dynamic that goes beyond just similar membership in international organizations, political beliefs, and the trading of public goods. It represents a type of constrained hierarchy, where nations are contained within a cluster and have a place on the hierarchy of that cluster (Beardsley, in review). Stronger states and weaker states will engage in hierarchical relationships with each other, allowing stronger states to more easily control outcomes while weaker states may view the larger state as a form of protection and a measure of deterrence (Beardsley, in review). Thus, these dependencies indicate the importance of incorporating latent variables in our models when simulating datasets.