Chapter 4 Application to Arms Data
Norwegian Initiative on Small Arms Trade
The Norwegian Initiative on Small Arms Trade is a database containing dyadic information on small arms trades from 1962 to 2015. The data includes the seller, the buyer, the type of weapon transferred, the year of the transfer, the total value of the arms purchase, and the source of the information. This data is both directed and weighted, where the direction is from the seller to the buyer and the weight is the number of weapons sold. However, mimicking the analysis above, we transformed this data into a binary network where, \(Y_{i,j}\) = 1 ,represents a transfer of arms from country i to country j. Below is an adjacency matrix of arms trade from the year 1997:
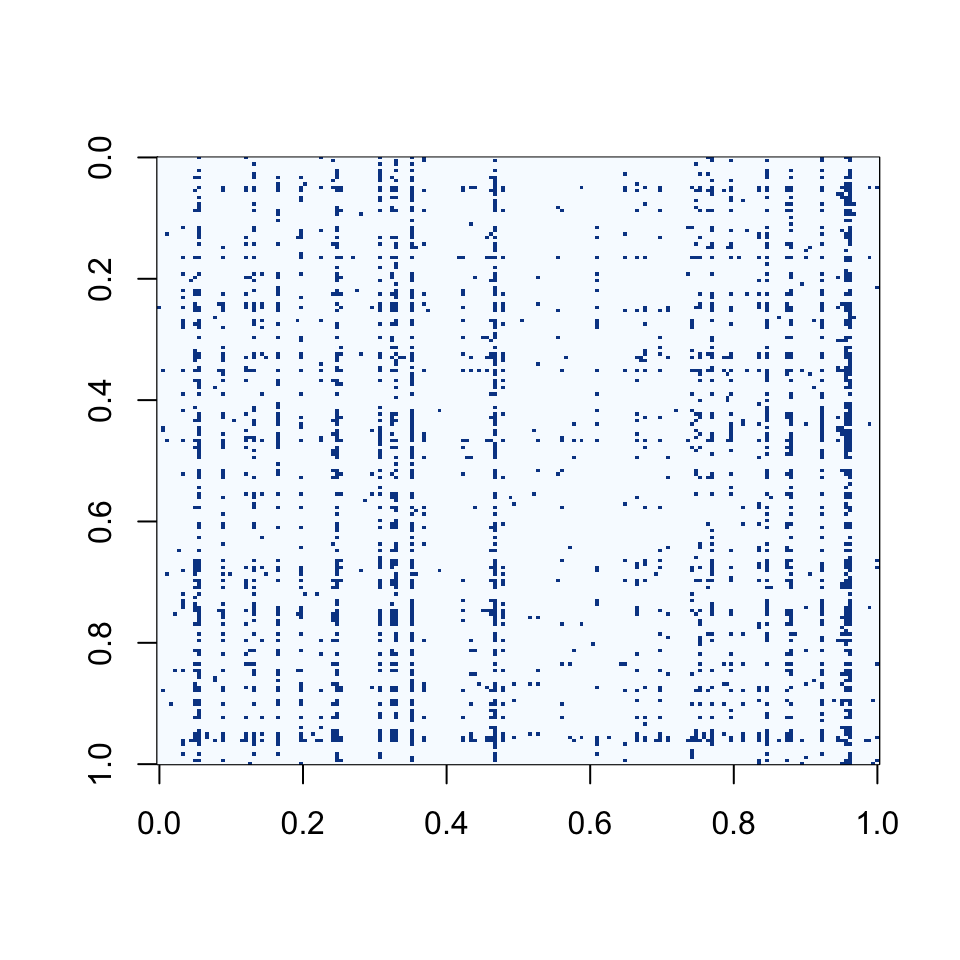
We can notice from this socio-matrix a few important aspects. First that there a few countries who seem very popular but not as many nations who sand out as being very sociable. Also there are around 10% of entries in the matrix are 1s.
Below is also an expert form the data from the year of 1997, showing the initial format of the data and the information provided. Note that prio_weapons_code refers to the type of weapons that we transferred. Weapons within the 100 range are light weapons, and increasing numbers represent an increase in destructive caliber of the weapon where in the 400s this includes arms such as landmines and explosives, while most of the transfers in the 500s represent ammunition and machine parts.
Below is also an expert form the data from the year of 1997, showing the initial format of the data and the information provided.
| seller | year | value | prio_weapons_code | buyer | data_source |
|---|---|---|---|---|---|
| Afghanistan | 1997 | 1979 | 210 | Czech Republic | 6 |
| Andorra | 1997 | 2780 | 223 | France | 6 |
| Andorra | 1997 | 8639 | 223 | Spain | 6 |
| Andorra | 1997 | 13668 | 227 | Spain | 6 |
| Argentina | 1997 | 995 | 227 | Austria | 6 |
| Argentina | 1997 | 39516 | 210 | Bolivia | 6 |
| Argentina | 1997 | 319133 | 210 | Brazil | 6 |
| Argentina | 1997 | 22533 | 417 | Brazil | 6 |
| Argentina | 1997 | 8054 | 210 | Canada | 6 |
| Argentina | 1997 | 30259 | 210 | Chile | 6 |
This data may be corrupted and thus as we saw in the previous section, doing analysis on this data without dealing the corruption could greatly impact any statistical inference we perform. If there is an underlying generative model then by replacing the values of the countries that are under reporting their arms trade with NAs, we would be able to impute these values from the true generative model. If the countries chosen are indeed engaging in illicit arms trading, then we would expect to see a difference in our inference if we ran the data as it is currently versus when we replace the possibly corrupted data with unknowns.
We identified just under 30 nations that we thought may have been engaging in illicit arms trading during the time period of the 1990s to 2005. These nations were chosen based on previous account of illicit arms trading (Chile, Niger, Afghanistan), were engaged in conflict or had been embargoed (Bosnia and Herzegovina, Israel, Pakistan, India), countries that are boarding an embargoed nation (Somalia, Ethiopia), and countries we believe may not reporting their arms trade due to political or profit based motivations (Russia, China, India, Venezuela). Below is a map where the countries we think are trading legally are in blue and the countries that we think may be engaging in illicit arms trading are in red.
After identifying these countries, we then made copies of the adjacency matrixes and for a trade that occurred between two nations that we identified as possibly under reporting, an NA was placed in that entry of the matrix.
In order to test our hypothesis, we ran the same analysis as above but the original arms data. The model was set up in the following way:
\(z_{i,j} = \beta^{T}x_{i,j} + a_{i} + b_{j} + \gamma_{i,j}\)
\(y_{i,j} = 1(z_{i,j}>0)\)
Where Y is s binary matrix, where \(y_{j,j} = 1\) represents that country i sold arms to country j. This analysis was also divided up by year where each \(Y\) socio-matrix represented a all the reported small arms trade from year t, for \(t \in (1995, 2005)\).
Two covariates were included in the model. The nodal covariate was the previous year’s standardized log(GDP) (at time t-1). This was used as both a row and column covariate. The other covariate was a dyadic covariate and was the previous year’s arms trade, arms trade at (t-1).
Below is a map where the countries we think are trading legally are in blue and the countries that we think may be engaging in illicit arms trading are in orange.
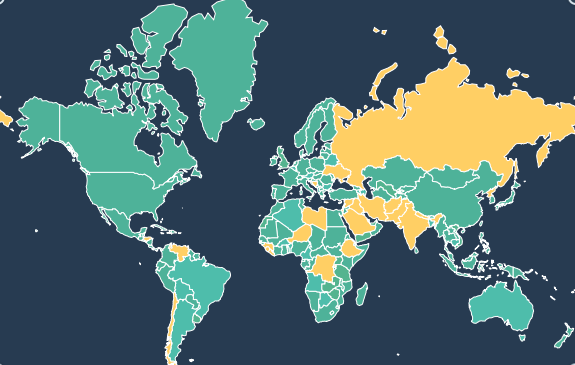
World Map
4.1 Findings
4.1.1 Beta (intercept)
When observing the intercept, the row and column coefficients for the nodal variable, and the observed data and the data with NAs inserted in appears very similar across all years.
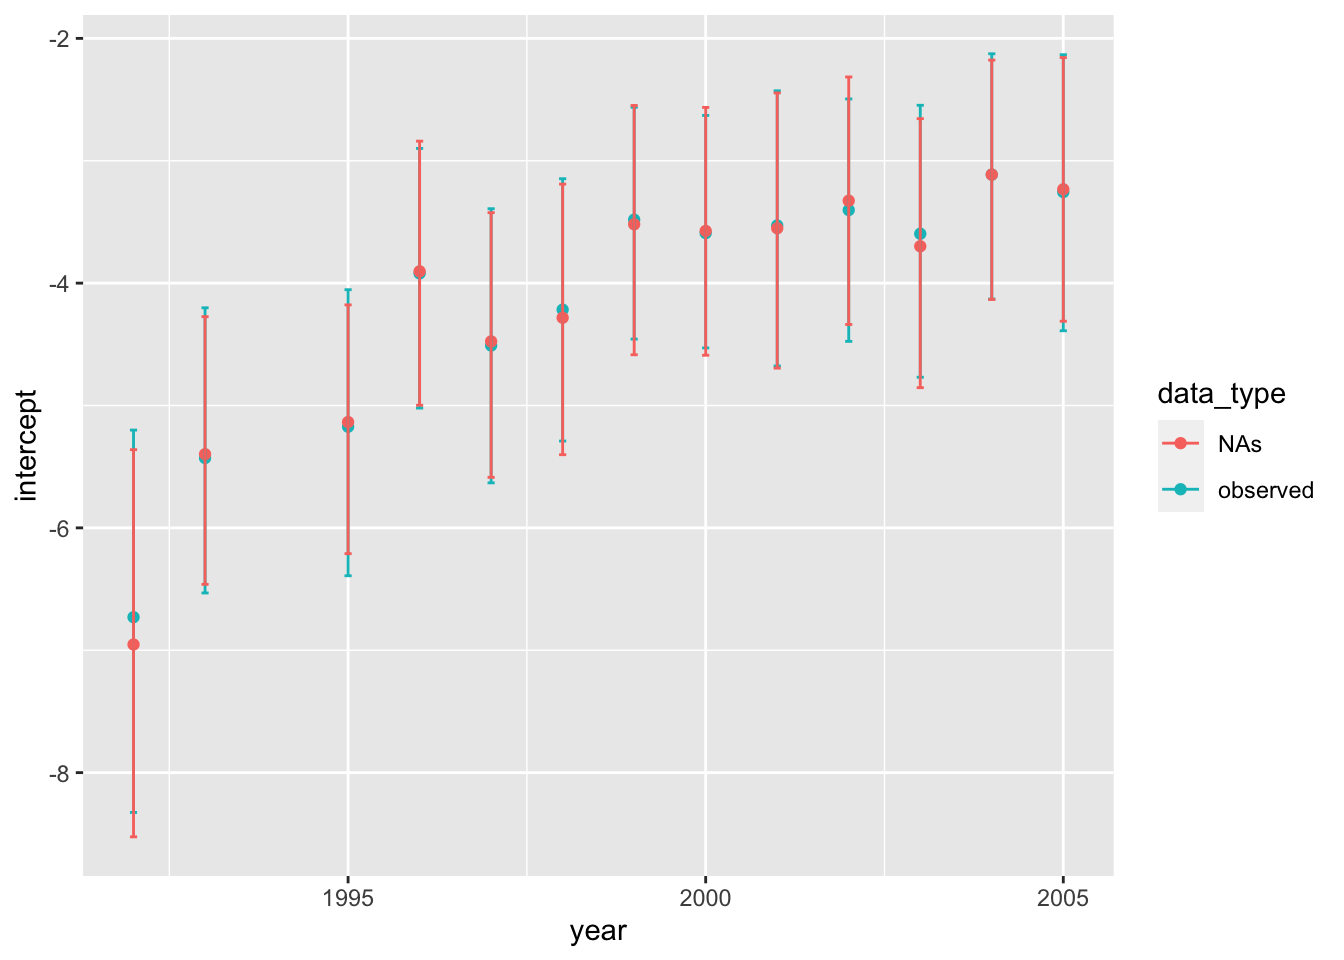
| data_type | Mean Beta | sd Beta | Median beta |
|---|---|---|---|
| NAs | -4.166469 | 1.097381 | -3.698587 |
| observed | -4.150008 | 1.057090 | -3.596627 |
4.1.2 Beta (row)
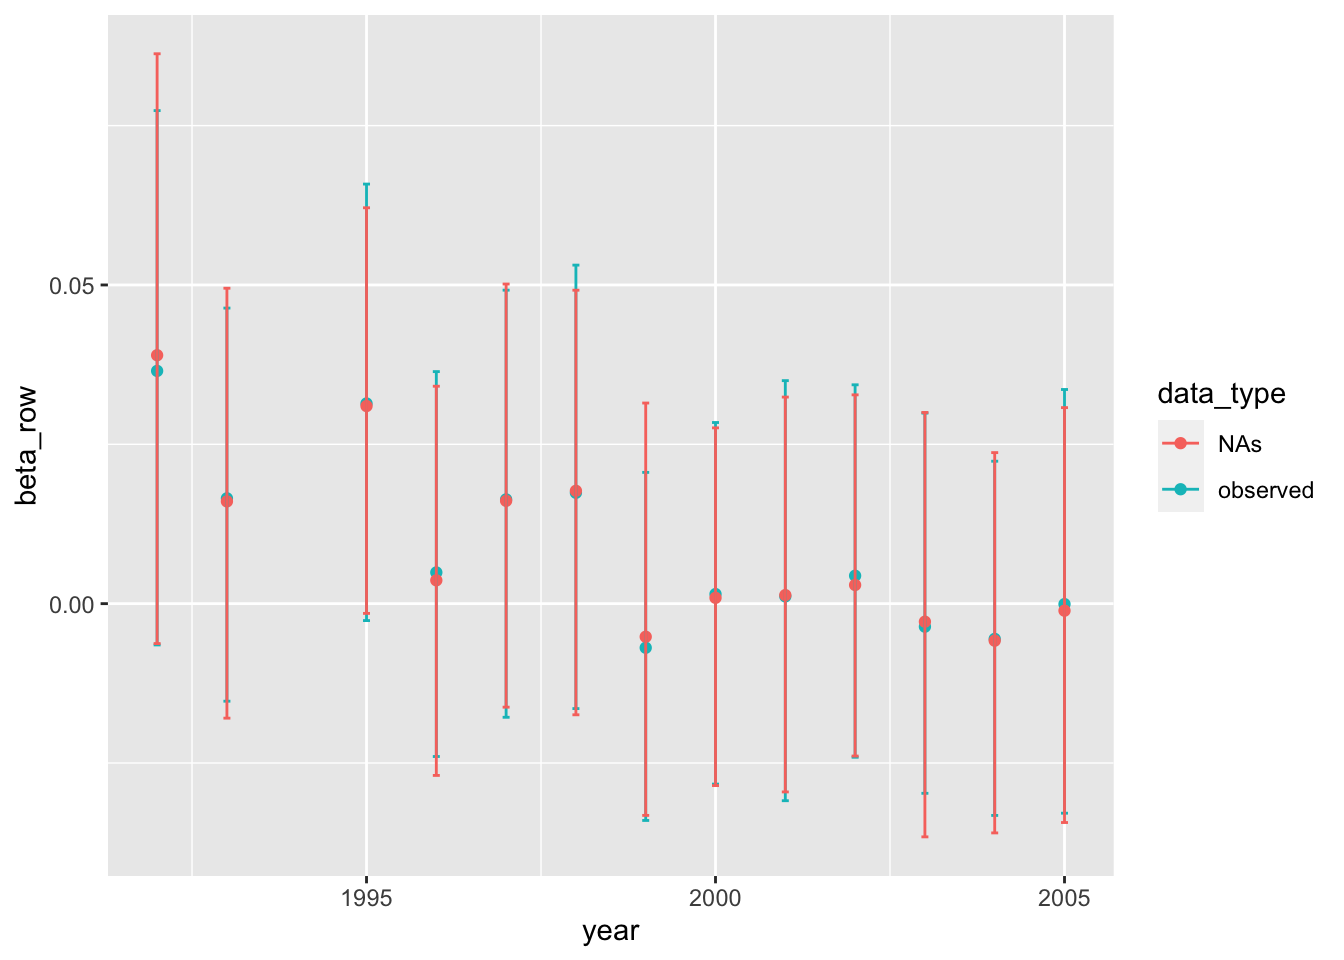
| data_type | Mean Beta | sd Beta | Median beta |
|---|---|---|---|
| NAs | 0.0087514 | 0.0141731 | 0.0029268 |
| observed | 0.0087686 | 0.0138486 | 0.0043808 |
4.1.3 Beta (column)
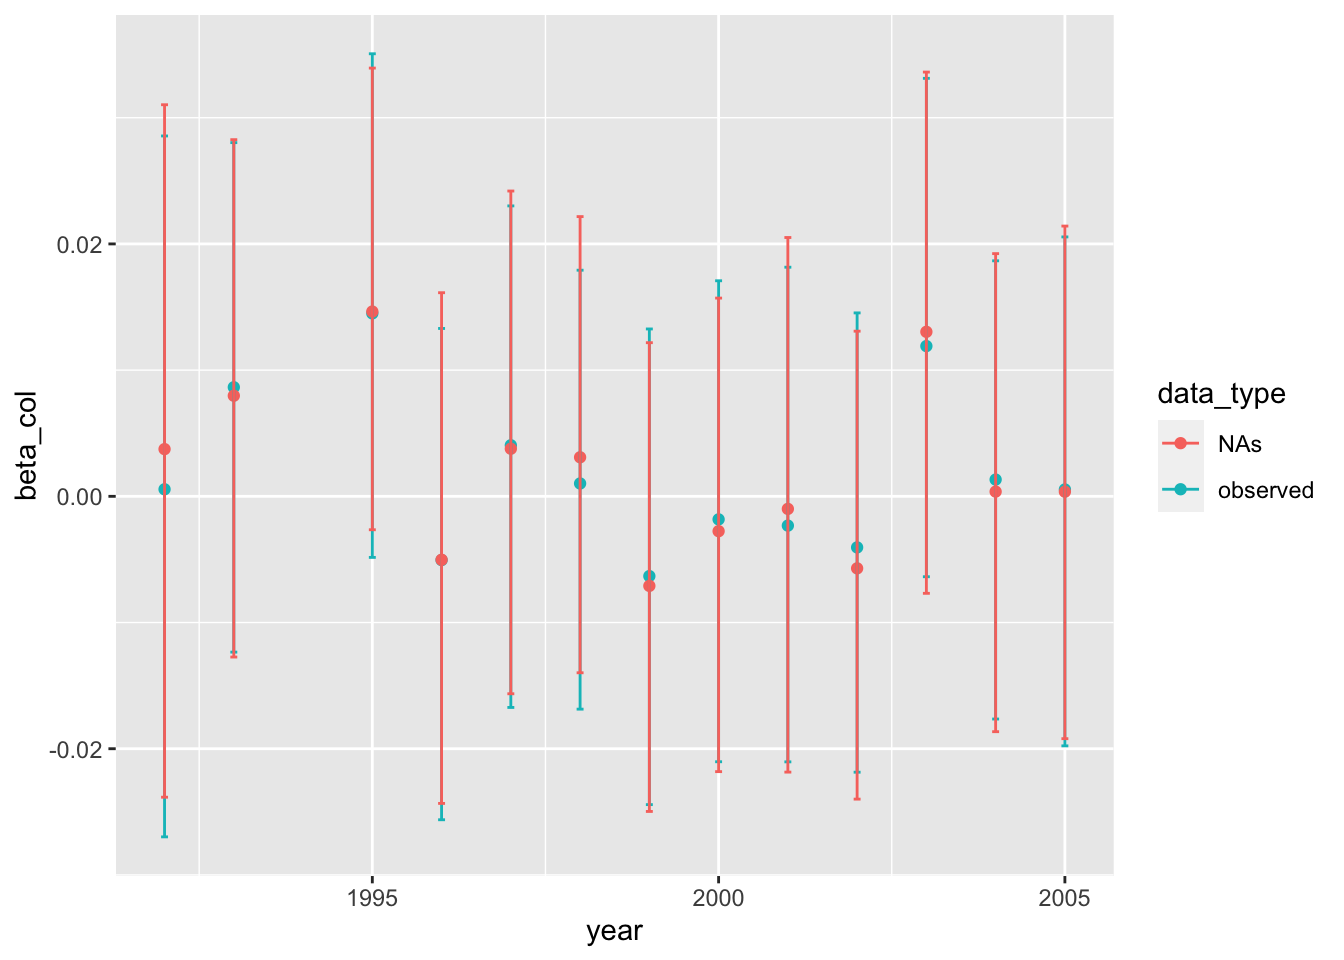
| data_type | Mean Beta | sd Beta | Median beta |
|---|---|---|---|
| NAs | 0.0019543 | 0.0067890 | 0.0003718 |
| observed | 0.0017676 | 0.0064314 | 0.0005590 |
4.1.4 Dyadic Coefficient
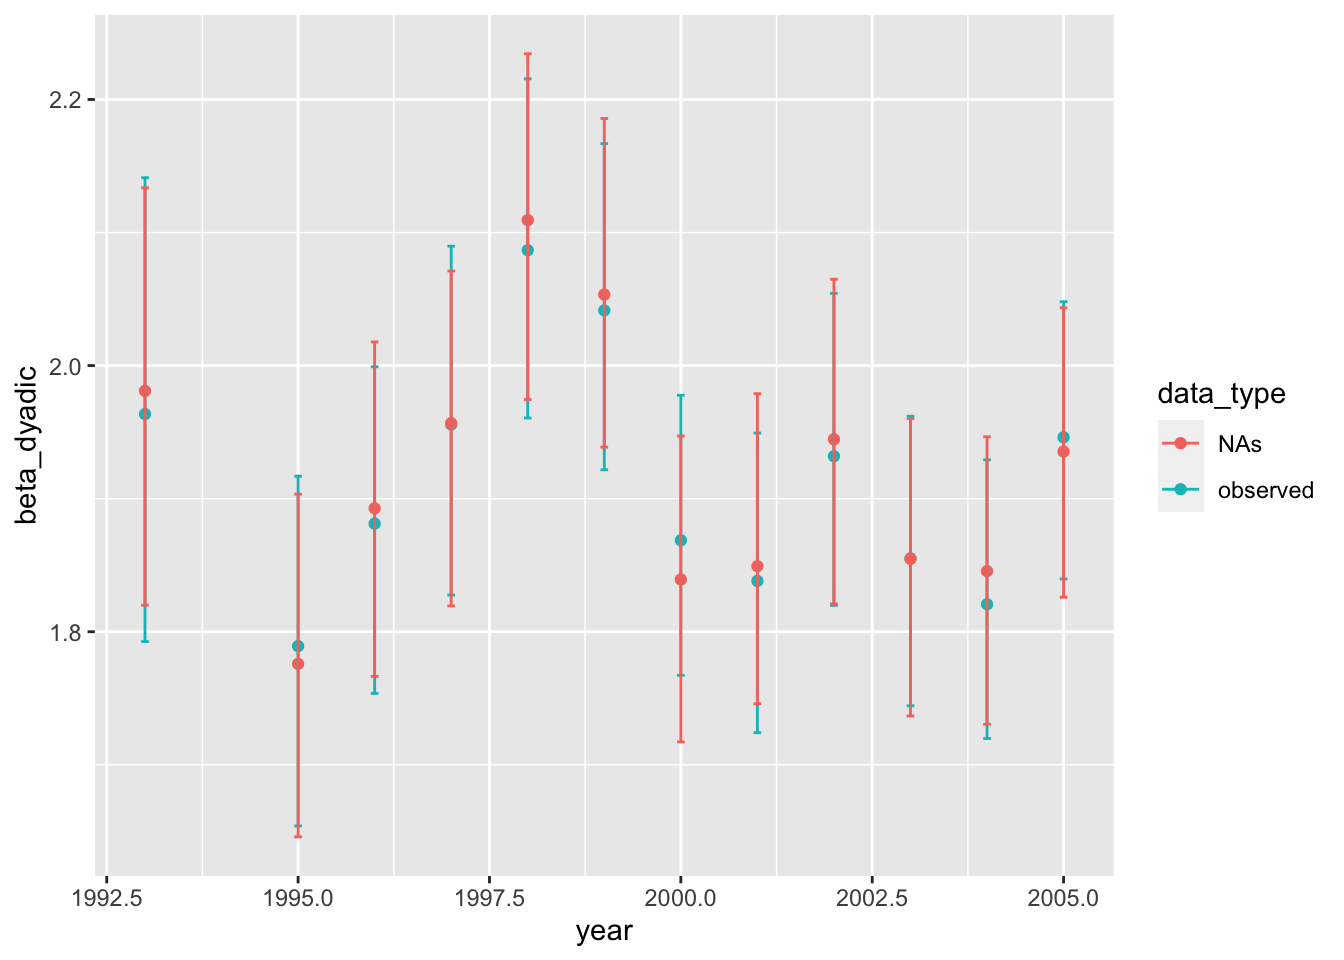
| data_type | Mean_Beta | sd_Beta | Median_beta |
|---|---|---|---|
| NAs | 1.919837 | 0.0964773 | 1.914063 |
| observed | 1.914881 | 0.0895733 | 1.906568 |
4.1.5 Total Degrees
For the total, in and out degrees the distribution from the original data and the data replaced with NAs look very similar. While the original data has an ever so smaller number of the number of actors with
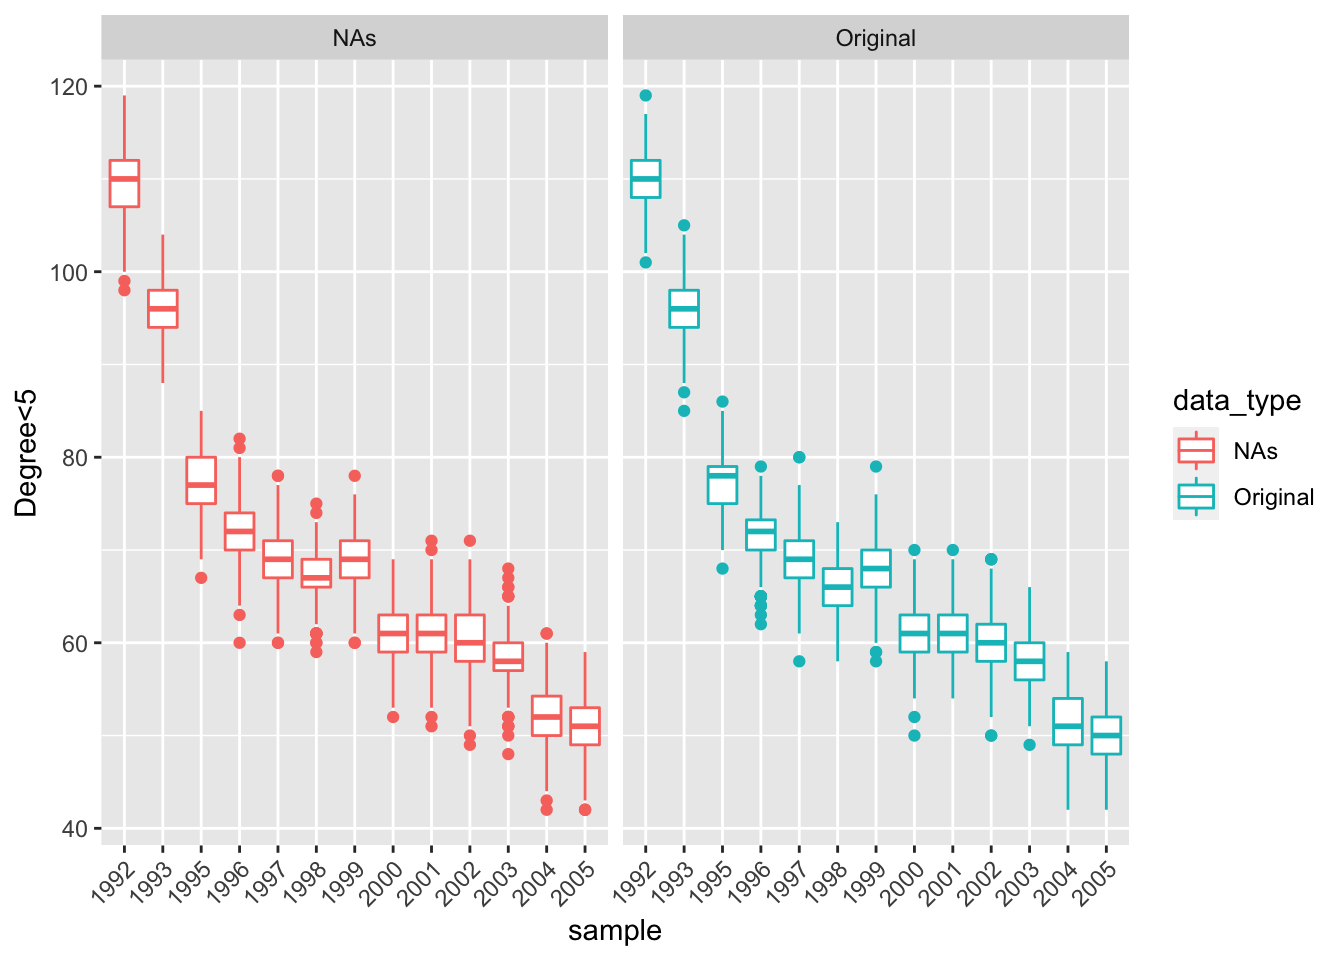
| data_type | degree all mean | degree all median | degree all sd |
|---|---|---|---|
| NAs | 69.49500 | 66 | 16.49296 |
| Original | 69.17038 | 65 | 16.68179 |
4.1.6 Triangle Count
The number of actors with triangles that are less than 50 is again very similar across both groups.
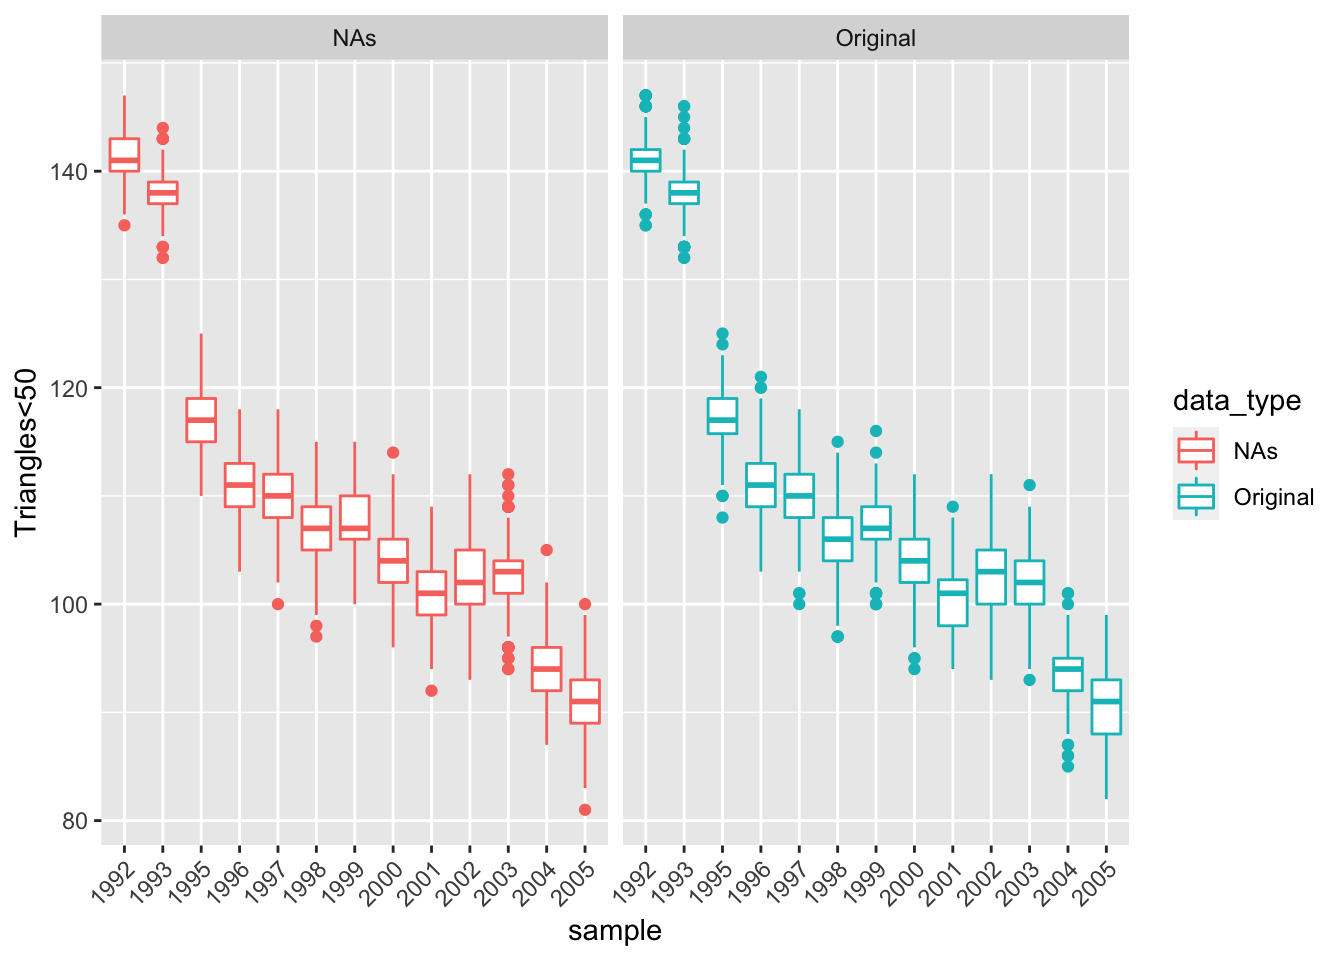
| data_type | triangle_mean | triangles_median | triangles_sd |
|---|---|---|---|
| NAs | 109.6958 | 106 | 14.62488 |
| Original | 109.5444 | 106 | 14.71470 |
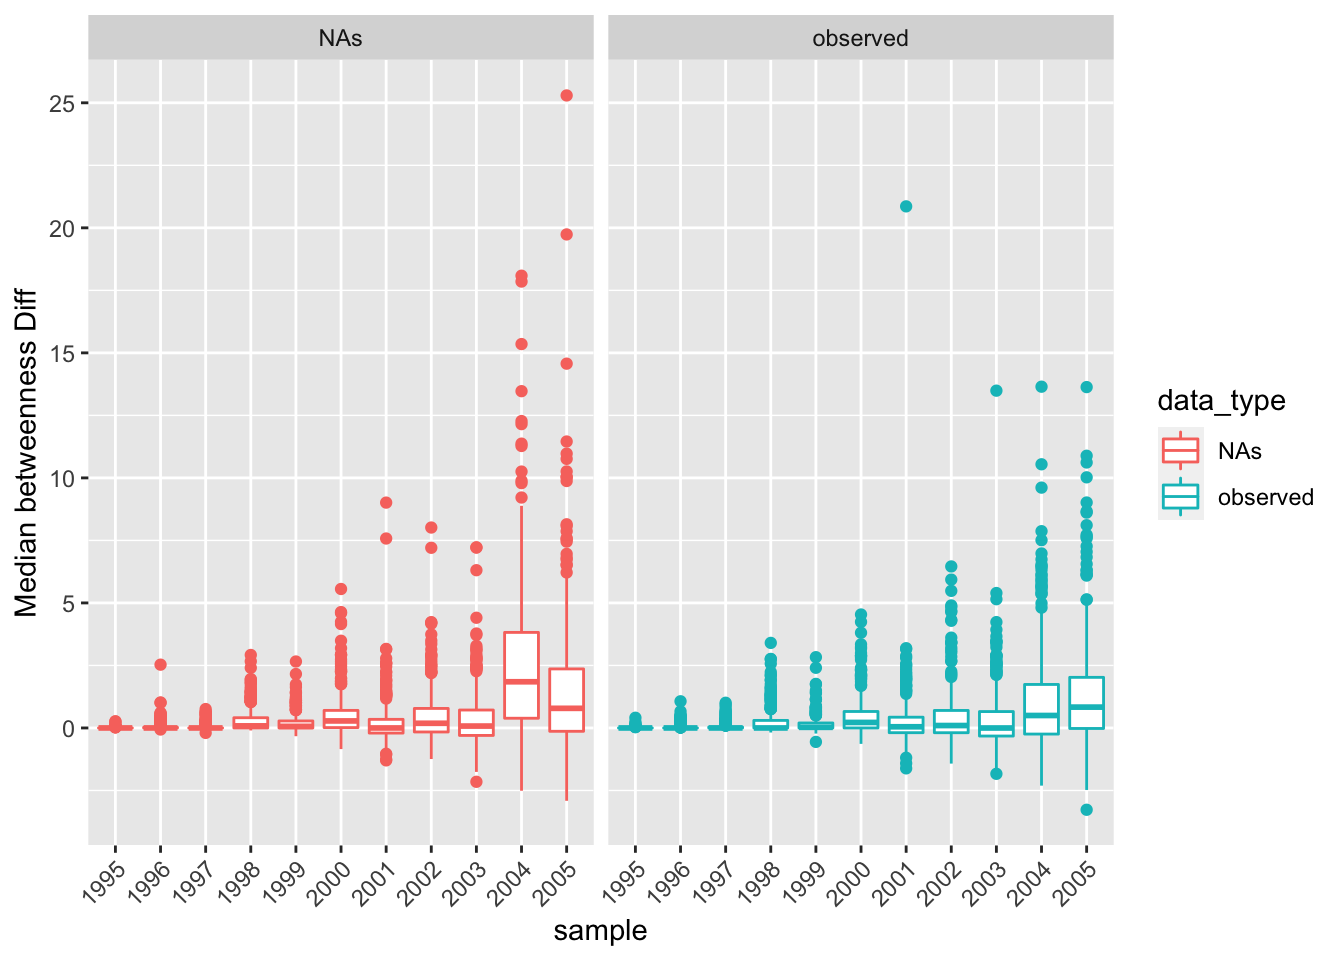
4.1.7 Betweeness
There appears to be a greater variance around the estimates for the data where NAs were inserted. This is what we would expect as though this data is coming from the generative model there is less certiently around the estimates. We also can observed that there appear to be a greater number of outliers for the data with NAs. While the uncertainty has increased and some more extreme outliers for some of the years, the actual estimates appear to be very similar.
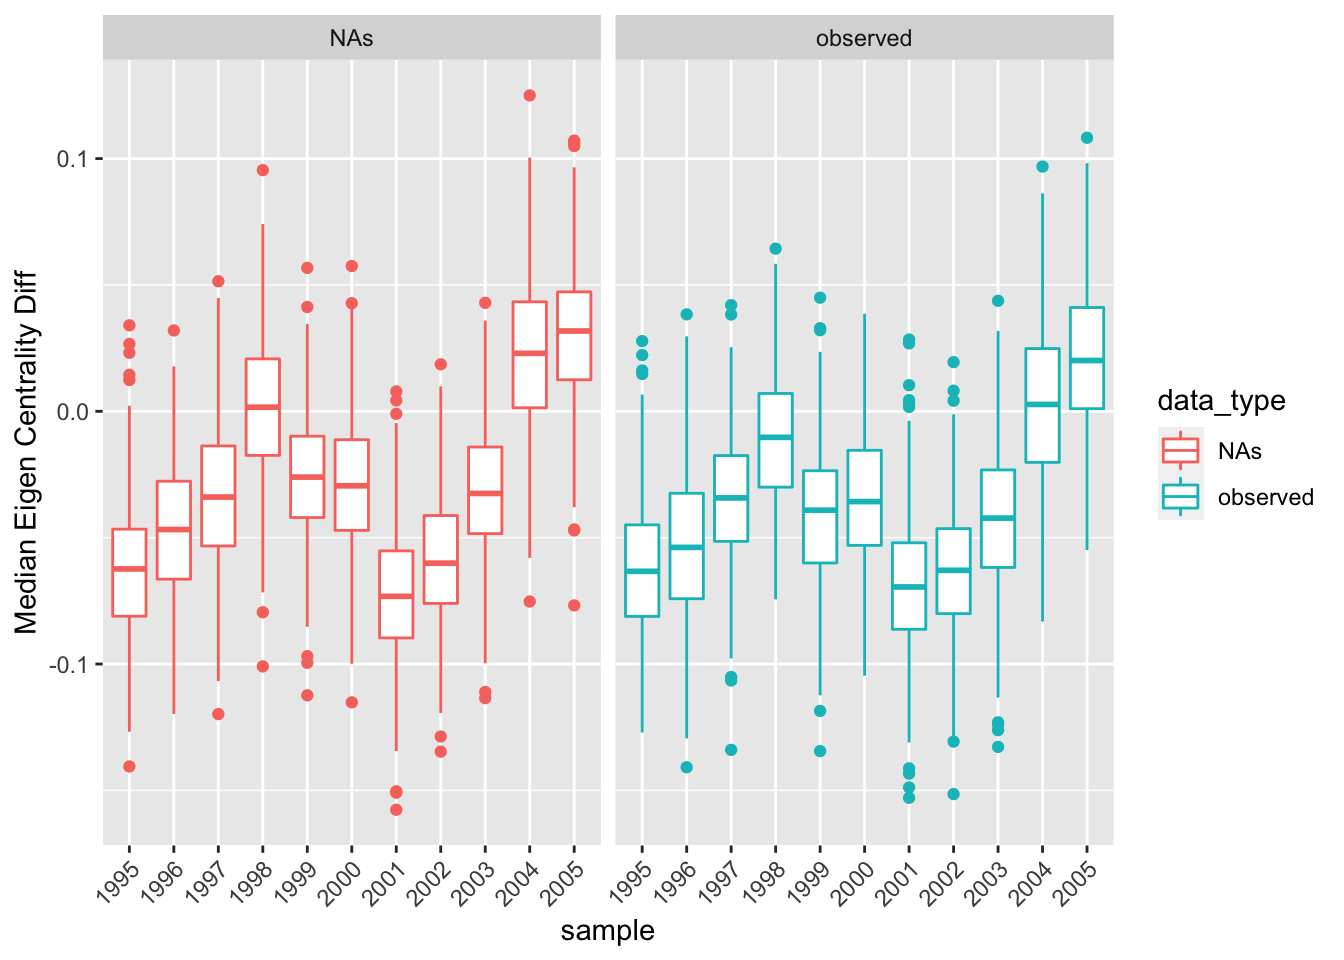
4.1.8 Eigen Vector Centrality
We can see from difference in the medians of eigen vector centrality of the countries we belive may be illicitly trading small arms and countries we think are reporting the acurate levels, we see that for some years there is some difference in the eigen vector centrality between the groups. This may idicate some alteration in the centrality due to illicit trading.
#Discussion and Conclusion
The presence of corrupted or underreported data can drastically impact our inference, especially as the proportion of corrupted data increases. Networks can appear less connected, nodes can appear to be less influential, and predictors can appear to be less important. The goals of this project were to set up a method for researchers to notice when the arms trade data they have may be corrupt. Our methods section indicates that signs of corruption may include things such as the nations suspected of illicitly trading may have a less betweenness and less centrality in the network than nations who are not illicitly trading. Data that is corrupted may also report a greater proportion of actors with degree and triangles under a certain threshold than the true data or the data with the corrupt values replaced with NAs. This is due to the fact that when nations fail to report the true number of arms they are trading, this decreases their number of degrees (in, out and total) and their connectedness to the rest of the network. This is particularly concerning when we are studying what nations are most influential and important to the arms trade and international relations as a whole, as our initial conclusions may not be based on correct data. This analysis also indicates that an augmentation of the proportion of countries who are illicitly trading leads to greater discrepancies in our inference. However, it may be more difficult to definitively say if nations are illicitly trading arms if that proportion lies around 10-15 percent.
The application to real data demonstrates that these countries may not be engaging in illicit arms trade or not all of them are engaging in illicit arms trade. While many of the posterior predictive statistics such as the number of actors with triangles less than 50 and the number of actors with total and in degrees less than 5 are similar across the reported data and the data we replaced with NAs for some years; However, many years these values have some discrepancies and thus many indicate that some illicit trading occurred. This difference is too small to draw any definitive conclusion that the thirty countries choses may be engaging in illicit arms trading but provides us with a note of caution when using this data. We also see that for the eigen vector centrality and the betweenness scores, the countries we believe to be trading illicitly appear to be less central and have less betweenness than when we observe the data replaced with NAs. Thus, when using this data for future analyses it is important to proceed with caution or consider using the data with countries we think are illicitly trading replaced with NAs.
There is a lot of future work to be done within this area of research. In particular dealing with circumstances of when nations are illegally trading to other nations but legally trading to other nations that my also illegally trading. Thus, this analysis assumes that if a country is trading illicitly then it is trading illicitly with all other countries that are trading illicitly. Further work would need to be done to see the extent of data of this context.
A more daunting project to take on when dealing with data of this sort if the possibility that this data would not be missing at random. There is a systematic relationship between whether a nation is not reporting how much arms they trade and the number of arms they trade. This analysis assumes that data would be missing at random, which allows these values to be imputed form the generative model.
Arms trade data is used to make important policy and military decisions, and the use of incorrect data can have detrimental impacts for populations and nations. Being able to identify when information may be misleading is essential for international security. Using the methods outlined above one can see where these discrepancies may occur, and if policies such as arms embargos are being effective or being undermined. Failing to account for illicitly traded arms is hindering our ability to understand the effectiveness of arms embargos, threats to international security, and international relations dynamics as a whole. The hope is that this work opens up other opportunities and ideas to predict and determine with whom and when is illicit arms trading occurring.