Chapter 2 Introduction
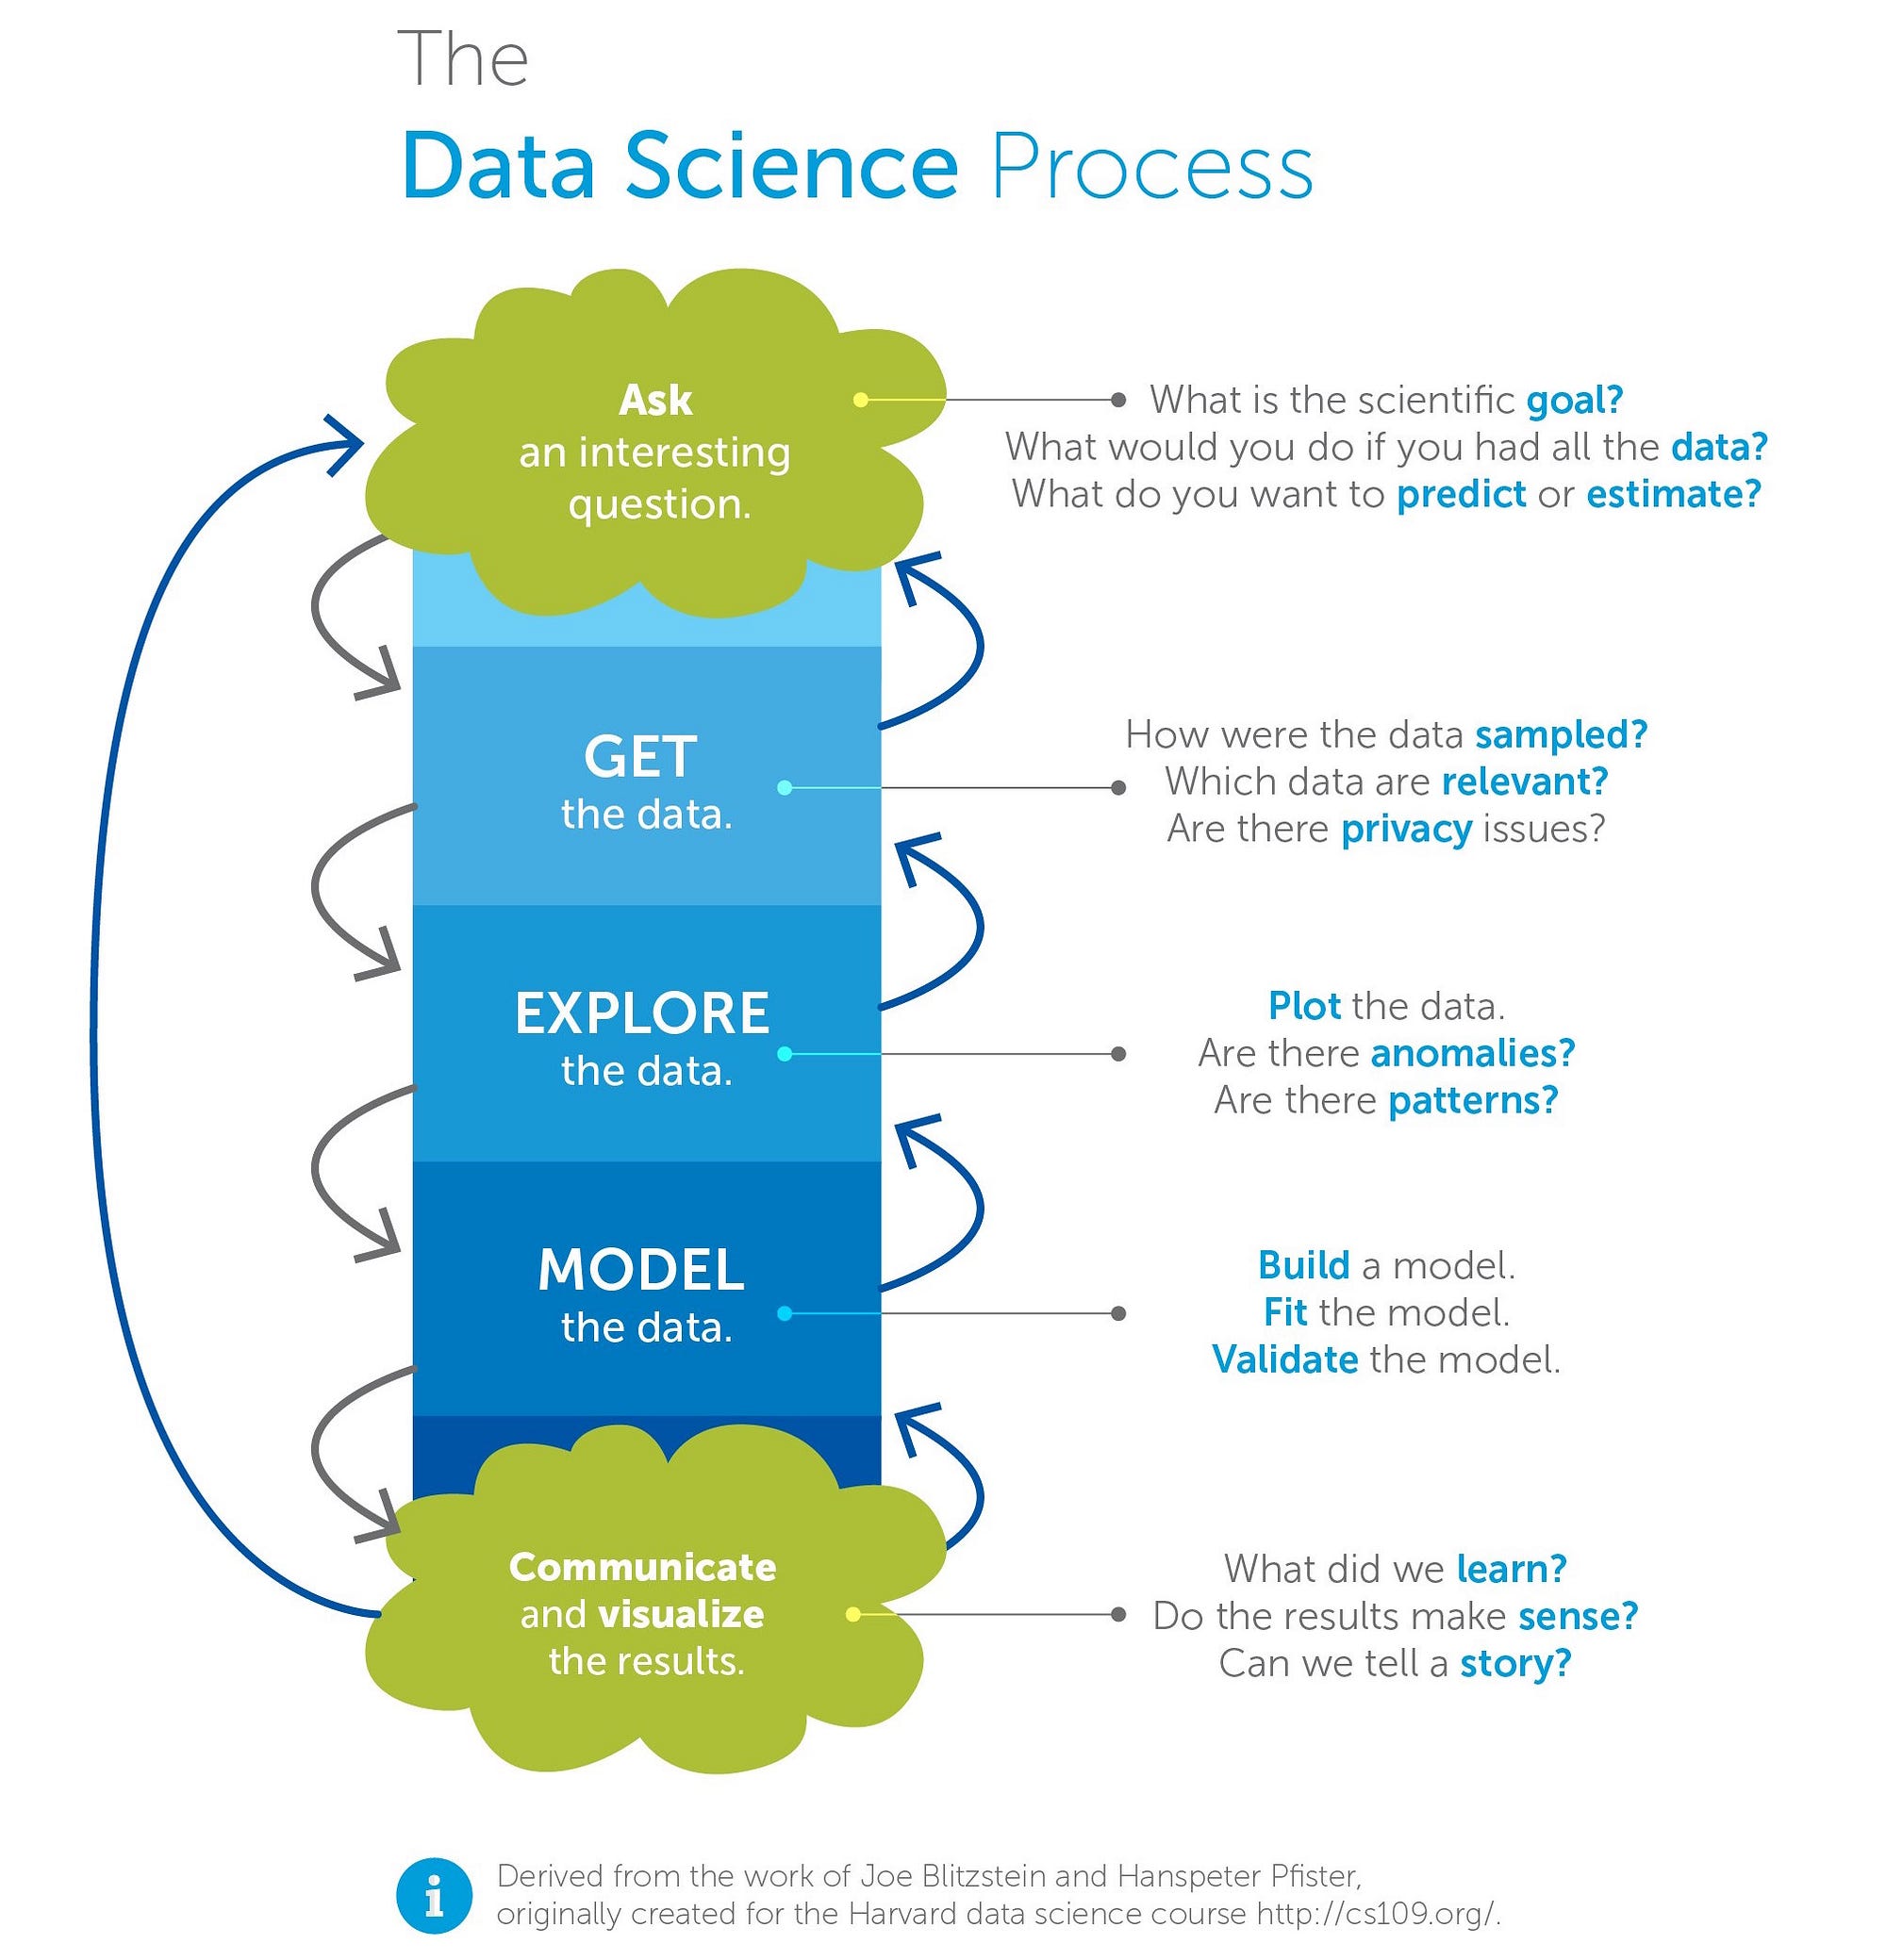
2.1 What is Data Science?
According to Wikipedia:
Data science is an interdisciplinary field that uses scientific methods, processes, algorithms and systems to extract knowledge and insights from data in various forms, both structured and unstructured, similar to data mining.
Data science is a “concept to unify statistics, data analysis, machine learning and their related methods” in order to “understand and analyze actual phenomena” with data. It employs techniques and theories drawn from many fields within the context of mathematics, statistics, information science, and computer science.
2.1.1 Examples of data science projects
The following are some recent kaggle competitions. I have added examples of arbitrary notebooks, where people show how they coped with the challenge.
2.1.1.1 Predict survival on the Titanic
Analyze data about passengers and crew that were on the Titanic, use statistical and machine learning tools to predict which passengers survived the tragedy. see this notebook.

2.1.1.2 House price prediction
With 79 explanatory variables describing (almost) every aspect of residential homes in Ames, Iowa, predict the final price of each home. see this notebook.
2.1.1.3 Humpback Whale Identification
Analyze database of over 25,000 whales images, gathered from research institutions and public contributors, and build an algorithm to identify individual whales in images. ($25,000 prize). see this notebook

2.1.1.4 Earthquake Prediction
Predict the time remaining before laboratory earthquakes occur from real-time seismic data. ($50,000 prize). see this notebook

2.1.1.5 Using News to Predict Stock Movements
Analyze information about news articles/alerts published about assets, and predict stock prices. ($100,000 prize). see this notebook
2.2 What will you learn in this course
The tools you’ll need throughout the entire data science pipeline. i.e.:
- Basic R programming
- Data managing, merging, and preprocessing
- Exploratory data analysis
- Data visualization
- Regression models: linear models, generalized models, hirarchical models.
- Machine Learning tools for supervised learning
- Machine Learning tools for unsupervised learning
- Developing data products and reports
For deeper understanding of data science and machine learning, some time and sufficient mathematical background are required. Since restrictions are not met, this course should not be expected to provide a deep understanding. We will not present the mathematical theory of the machine learning models. Instead, we will provide an abstractive, high-level description, using many hand waving. The structure of this course is therefore intended to expose students to some concepts in data science and to a subset of machine learning tools, with the aim of stimulate appetite. Students who want to expand their theoretical background are referred to books like The Elements of Statistical Learning, Machine Learning: a Probabilistic Perspective and Deep Learning
2.2.1 More self-learning platforms
See the links here
2.3 Course Logistics
Grade will be combined from the following:
- Home exercise (30%)
- Final assignment (20%)
- Exam (50%)
Home exercise will be submitted in pairs in R Markdown format (see 12). They will include tasks that can be solved based on what you saw in class, but will also require “self-learning” - that is, searching for answers (especially when it comes to code) to questions and solving problems by yourself. This ability is essential for anyone who will work with data, and it is part of what the course teaches. Exercises will be submitted trough the cours’s Moodle. Any questions about the exercises will be asked in a designated forum in the course Moodle site.
Assignment will be in kaggle’s style. That is - you will get some data from which you can learn something about the relationship between some predictors and a target, and will be ask to predict the target with new predictors which you have never seen before. Your grade will be simply your success rate (with some trnsformation).
The exam will be an American test (no open book). It will evaluate your ability to read and write code and your understanding of concepts in data-science.
2.3.1 Class exercises
During the course we will have 4 class exercises, were you can practice ``with your hands’’ the topics we have learned. Class exercises dates are: 1/11 ; 15/11 ; 6/12; 27/12 at 19:00 - 20:30.
2.4 Why R?
Some points raised by Hadley Wickham:
- Its free, open source, and available on every major platform.
- R has a diverse and welcoming online community.
- A massive set of packages for statistical modelling, machine learning, visualization, and importing and manipulating data are available in R.
- There are powerful tools for communicating your results in R (RMarkdown, Shiny).
- RStudio, the IDE, provides an integrated development environment, tailored to the needs of data science, interactive data analysis, and statistical programming.
2.5 The R Ecosystem
A large part of R’s success is due to the ease in which a user, or a firm, can augment it. This led to a large community of users, developers, and protagonists. Some of the most important parts of R’s ecosystem include:
CRAN: a repository for R packages, mirrored worldwide.
R-help: an immensely active mailing list. Noways being replaced by StackExchange meta-site. Look for the R tags in the StackOverflow and CrossValidated sites.
Task Views: part of CRAN that collects packages per topic.
Books: An insane amount of books written on the language. Some are free, some are not.
The Israeli-R-user-group: just like the name suggests.
Commercial R: being open source and lacking support may seem like a problem that would prohibit R from being adopted for commercial applications. This void is filled by several very successful commercial versions such as Microsoft R, with its accompanying CRAN equivalent called MRAN, Tibco’s Spotfire, and others.
RStudio: since its earliest days R came equipped with a minimal text editor. It later received plugins for major integrated development environments (IDEs) such as Eclipse, WinEdit and even VisualStudio. None of these, however, had the impact of the RStudio IDE. Written completely in JavaScript, the RStudio IDE allows the seamless integration of cutting edge web-design technologies, remote access, and other killer features, making it today’s most popular IDE for R.
R education platforms: There are several good platforms for learning data science and machine learning (not just R) in the internet. Some of them are free. check the courses given in DataCamp, Coursera or Udemy for example.
Blogs (not just R): here is a good list of data-science blogs
2.6 Notation Conventions
In this text we use the following conventions: Lower case \(x\) may be a vector or a scalar, random or fixed, as implied by the context. Upper case \(A\) will stand for matrices. Equality \(=\) is an equality, and \(:=\) is a definition. Norm functions are denoted with \(\Vert x \Vert\) for vector norms, and \(\Vert A \Vert\) for matrix norms. The type of norm is indicated in the subscript; e.g. \(\Vert x \Vert_2\) for the Euclidean (\(l_2\)) norm. Tag, \(x'\) is a transpose. The distribution of a random vector is \(\sim\).
2.7 Bibliographic Notes
For more on the history of R see AT&T’s site, John Chamber’s talk at UserR! 2014 or the Nick Thieme’s recent report in Significance.
You can also consult the Introduction chapter of the MASS book (Venables and Ripley 2013).
2.8 Practice Yourself
References
Venables, William N, and Brian D Ripley. 2013. Modern Applied Statistics with S-Plus. Springer Science & Business Media.