第 2 章 口语
2019-04-01
2.1 personal introduction
- 不算分,但会被与分数报告一同送往你所递交往的机构。
- 25秒时间阅读要求,30秒时间回答。
- 不可重录。
- 建议可以谈论的内容:
- interests
- plans for future study
- why to study abroad
- why English
- why this test
- 目的是为了留下正面印象。
- 做好准备,应当「出口成章」。自信加持。
- 对镜练习,流利连贯自然。
- 最好能说到30秒结束。
2.1.1 personal introduction 示例
My name is ¯_(ツ)/¯. I’m ¯_(ツ)/¯ years old. I’m from ¯_(ツ)/¯ and I’m in my final/first/… year of ¯_(ツ)/¯. I plan to study ¯_(ツ)/¯ in college, because ¯_(ツ)/¯. One of my interests is to ¯_(ツ)_/¯…
2.2 read aloud
- 6-7题内容。
- 朗读之前:
- 30-40秒的时间通读全文理解句意。
- 利用标点和语法中的意群找到需要停顿的地方。
- 找出读音不那么确定的单词,尝试拼读。
- 开麦之前大声朗读第一句话,有助于找到自己的语音语调。
- 朗读时:
- 提示音之后立即开读,不用太关注进度条,但是也要心里有数。
- 着重朗读关键信息词。
- 意群停顿。
- 声调表突出,降调表完结。
- 其它注意:
- 不用着急,语速适中。
- 音量不要变化过大,音量适中。
- 读错了,可以修正,但不要停顿,继续读。千万不要没事重新开始读。
- 如何准备:
- 试着在阅读的材料中寻找停顿、重音。
- 阅读材料选择面广,任何的文本都可以用来练习。60词上下。40秒计时练习。
- 连读。不用太追求连续的效果,但一定要学习到连读的「感觉」。
- 节奏越自然,流利度越高,分数自然越高。节奏如何体现?重度轻度对比明显。这里不是说声音忽然大忽然小。
- Kevin Spacey
- 现在开始,碰到生词怎么办?查字典,音节和读音都得掌握。积累。
2.2.1 read aloud 例题
Market research is a vital part of the planning of any business. However experienced you or your staff may be in a particular field, if you are thinking of introducing a service to a new area, it is important to find out what the local population thinks about it first.
According to recent research. sunshine and warm weather have a positive effect on our moods. The British Journal of Psychology has published a report in which it claims that anxiety levels fall when temperatures rise, while increased exposure to sunshine makes us think more positively about our lives.
History rubs shoulders and often overlaps with many other areas of research, from myths and epics to the social sciences, including economics, politics, biography, demography, and much else besides. Some histories are almost pure narratives, while others go in for detailed, tightly-focused analyses of, for example, the parish records of a Cornish village in the 16th century.
Before the time of Alexander the Great, the only eastern people who could be compared with the Greeks in the fields of science and philosophy were from the Indian sub-continent. However, because so little is known about Indian chronology, il is difficult to tell how much of their science was original and how much was the result of Greek influence.
In the Middle Ages, the design and use of flags were considered a means of identifying social status. Flags were, therefore, the symbols not of nations, but of the nobility. The design of each flag resembled the “devices” on the noble’s Coat of Arms, and the size of the flag was an indication of how high the owner stood in the nobility.
2.3 repeat sentence
- 10-12项,每道题时间短(3-9秒时间),应接不暇。
- 机器读完之后有3秒的准备时间,不用手写(除非你会速记)。
- 重点在于听懂所表达的内容,不能听一个词记一个词,容易捡了芝麻丢了西瓜。
- 尽量复述,如果有单词不太确定就读一个你听到的大概的词。
- 不用尽力模仿朗读者的语音语调,就用自己的方式发音。
- 但是,必须熟悉各种口音。
- 练习方式0: 从复述3-4个单词开始练习,听podcast。
- 练习方式1:自己录音,自己练习。同样的方法write from dictation也可以这么练习。
- 联系方式2:复述一切能听到的单词、句子,甚至不论长短。
- Shadow reading.
- 练习材料的局限
- 有native speaker朗读的,不是机经。
- 是机经的,没有native speaker朗读。
2.3.1 repeat sentence 例句
audio
2.4 describe image
- 25秒准备时间。
- 识别图中最主要的内容,非「细枝末节」。
- 什么是主要内容?
- 名称,类别,趋势,开始,结束,极值,步骤。
- What is the image mainly showing?
- 内容细节再多,我们争取完成4+1的回答内容。
- 4点主要内容。
- 1点引申(例如,总体趋势,表达出什么结论等等)。
- 虽然可以,但不推荐笔记。(用熟练度代替笔记的功能)
- 保持输出。这题不会存在时间太多的情况,一般来说反而会出现时间不够。
- 如果说错了,立即纠正。
- 应对方式:
- 大量练习,见多识广,套用模板。
- 常见题型有:
- 折线图、饼图(
¯\_(ツ)_/¯)、柱状图,或者它们的混合:increase, decrease, about the same, equal, decline, spike, peak, etc. - 表格
- 地图:on the left/right, next to, above, below, etc.
- 流程图
- 对比图
- 「图」(一张图)
- 折线图、饼图(
- 卡住了,说不出来怎么办?
- 不要停!用口语化的词「插科打诨」例如:um, uh, let me see, basically, you know, like.
2.4.1 DI练习题
2.4.1.1 DI 模版
This XXXXX shows the information about XXXXX. In general, there are XXXXX different categories in this image, including XXXXX. To be more specific, the highest figure in this diagram is about XXXXX, which is XXXXX. In addition, the lowest number is around XXXXX, which is for XXXXX. In conclusion, there is an overall XXXXX.
2.4.1.2 Electricity generation
img
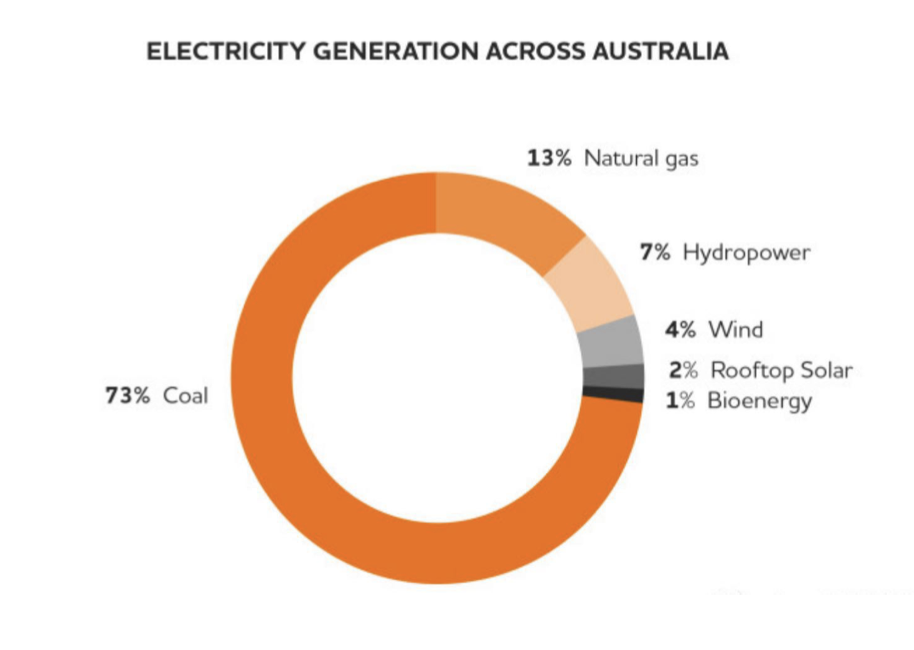
The following pie chart gives information about electricity generation methods within Australia. The methods include coal, natural gas, hydropower, wind, rooftop solar and bio energy. According to the graph, coal is the most common electricity generation method, takes about 73% of the total portion. Natural gas is the second highest, which is only 13%. Among all methods, bioenergy has the lowest percentage, only 1%. To conclude, the coal is the most important electricity generation source in Australia, contributing around three-fourths.
2.4.1.3 Gariep Basin
img
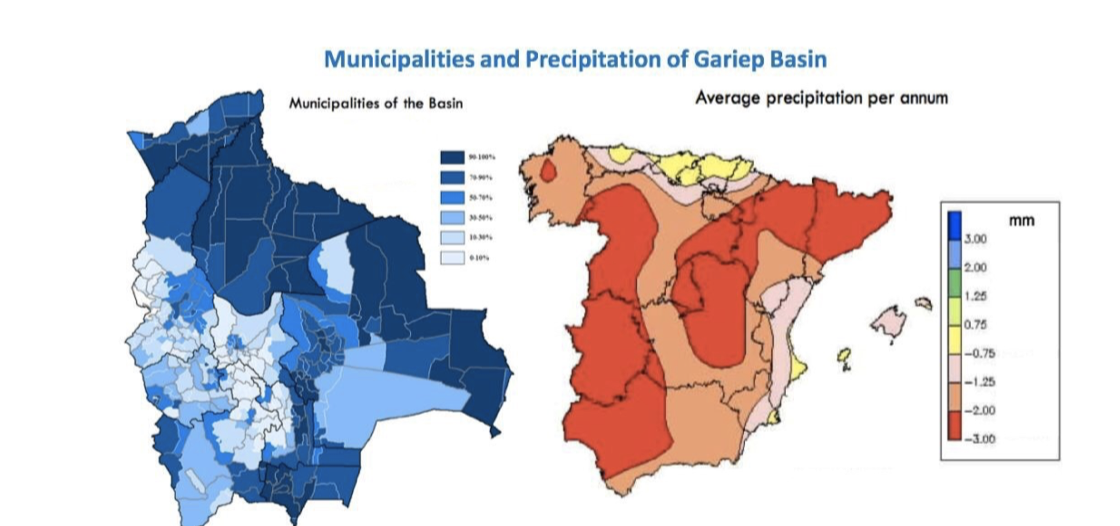
The two heatmaps of Gariep Basin give information about municipalities and precipitation respectively. The map on the left hand side demonstrates the municipalities distribution in the Basin. We can see that the northeast and south side of the basin have rather large municipalities, while the southwest corner has comparatively lower. On the right hand side we have a map showing the annual precipitation within the basin. The southwest and northeast parts have very low precipitation. To conclude, there might be some positive correlation between the municipalities and precipitation within the basin. And these information are very informative.
2.4.1.4 Input and Output
img
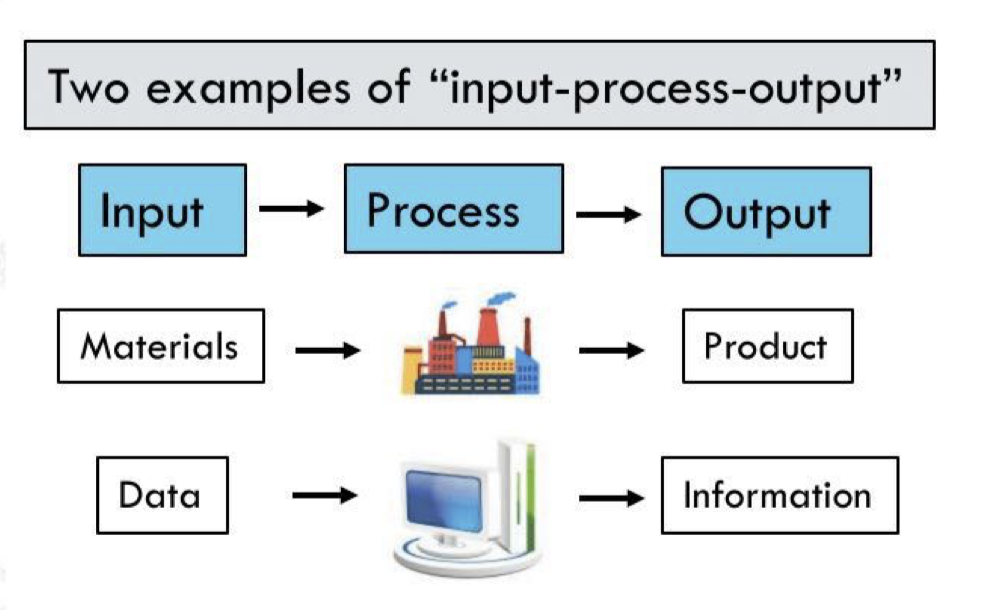
The flowchart below gives two examples of “input-process-output” iterations. Generally speaking, each example can be divided into 3 different steps, input, process and output. In the first example, the input is materials. Followed by that, the second step is factory, and the third step generates the output, which is the product. In the second example, the input is data. The second step which processes data is computer, and the last step has information as the output. To conclude, the flowchart is very informative.
2.4.1.5 Food&oil price
img
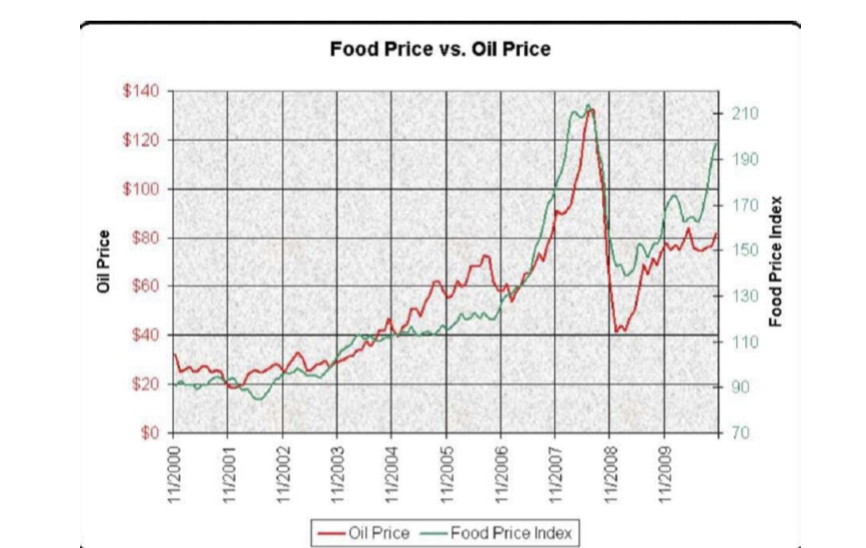
The line graph gives info about the comparison between food price and oil price. The items include oil price and food price index. The horizontal axis is time ranging from November 2000 to November 2009. According to the graph, both oil price and food price index reached the highest value between November 2007 and November 2008. The highest oil price is around 130 dollars, and the highest food price index is around 210. You can see from this graph that both prices are increasing most of the time, except for some time before November 2008, there was a huge drop in the prices. in conclusion, the trend of oil price and that of food price index are highly correlated. And both prices are the highest in year 2008 before the drop.
2.4.1.6 Teaching career
img
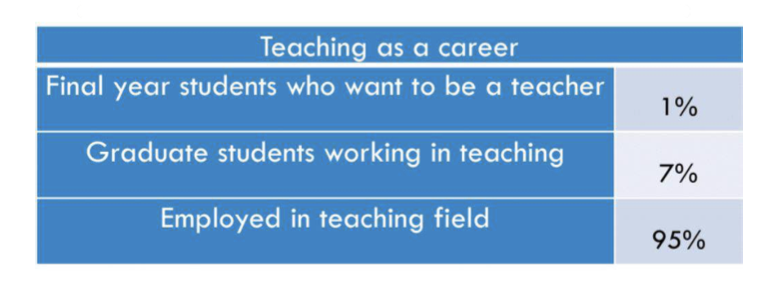
The chart gives info about teaching career. The items include the identities of different people who are now teaching as a career. According to the graph, the final year students who are teachers-to-be are only 1%, which is the lowest. Graduate students working in teaching are 7%, higher than the first group. At last, employed in teaching field have 95%, which is the highest among all three groups. To conclude, people who are employed in teaching filed have the largest percentage.
2.4.1.7 Number of dwellings
img
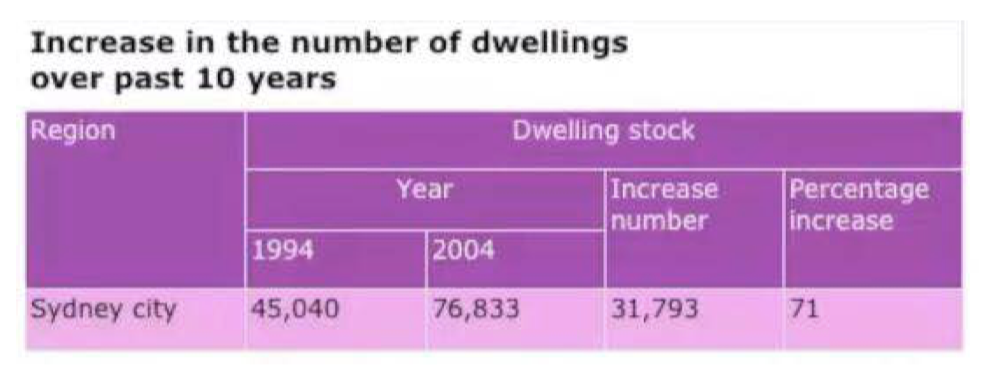
Info about dwellings increase in the past 10 years. Include dwelling stock in 1994 and 2004. In 1994, the number is 45040, while the number increases by 31793, so that the number in 2004 is 76833. Increased by 71 in percentage. To conclude, the number of dwelling stock increases a lot in the past 10 years.
2.4.1.8 Athletics participation
img
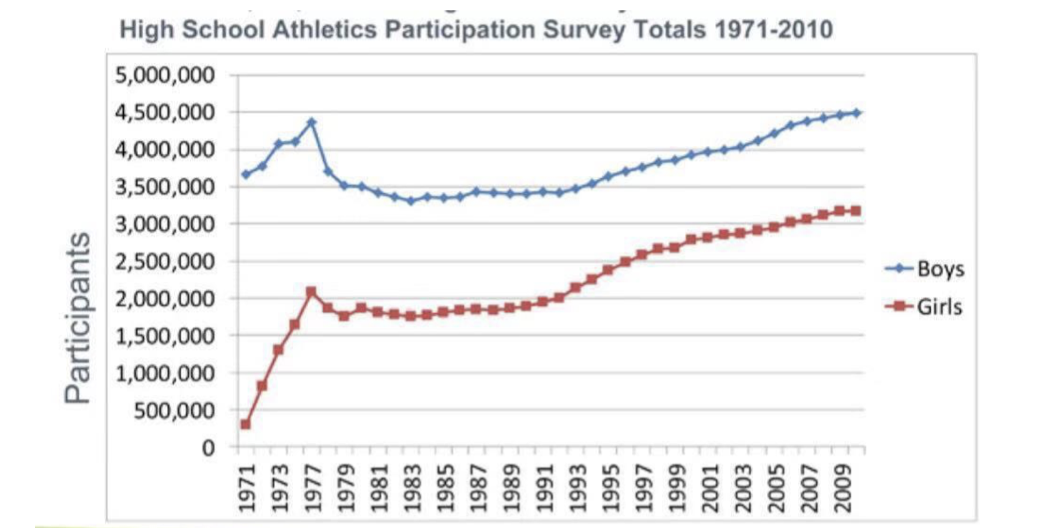
About …. boys and girls Horizontal axis years from 1971 to 2009 In 1977, boys 4,500,000, girls 2,000,000 boys > girls. The graph also shows a trend in increasing from 1979 to 2009. Both reach highest point in 2009. To conclude, the boys participation number is always greater than the participation number of girls.
2.4.1.9 Corruption perceptions
img
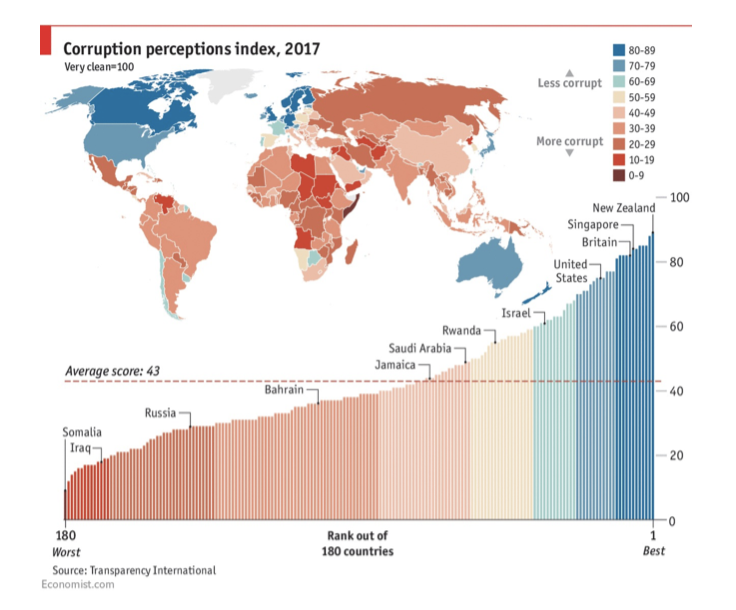
The info is about the corruption perception index among the world. The graph specifies each country in the world and its corresponding index. The graph shows that the least corrupt areas are North America, Western Europe and Oceania. In particular, New Zealand has the highest index which is around 90. Also shows that South America, Africa and Asia have rather low index, indicating they might be corrupt comparatively. Somalia has the lowest index, ranking as the most corrupt country in the world. To conclude, developed countries are less corrupt than developing countries.
2.4.1.10 Article adding
img
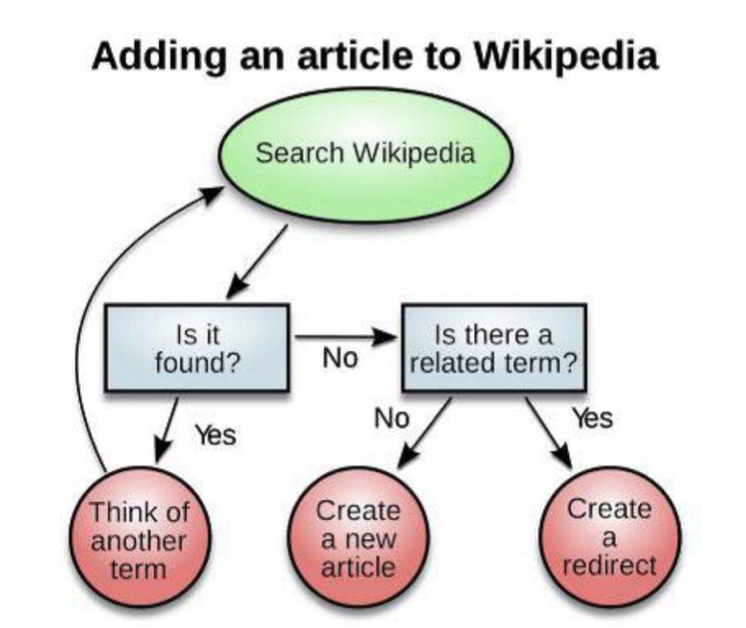
How to add an article to Wikipedia The first step is to search wiki, if the term is found, then we are all good, we can go back to step one and search for another term. If the answer is no, here comes step two , we can try to find if there is a related term. If the answer is no, the next action to take is to create a new article. If the answer is yes, then we can simple create a redirect to the term we searched. To conclude, the flowchart is very informative about adding an article to wiki.
2.4.1.11 Rain forest distribution
img
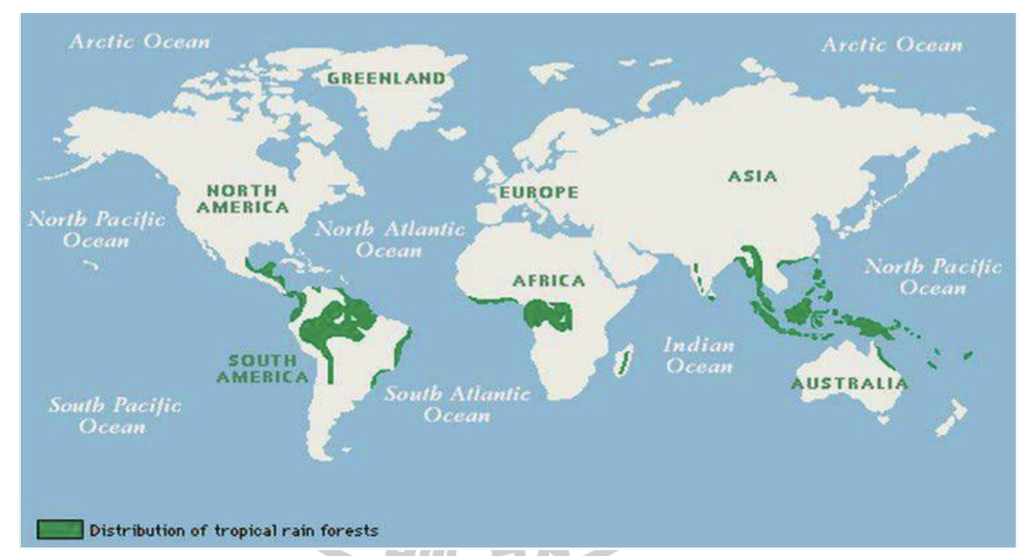
Central America and South America, central Africa and South Asia. Africa has the least tropical rain forest distributions. Informative, …
2.5 re-tell lecture
- 听录音,记笔记,直接上手记1-9,然后整合关键词 (to conclude, personally I believe, …) 、连接词、数据-年份-数值、事件、国家、地区、example
- 如果题目中含有一张图片,可以花几秒钟简略看一下图片大略;某些情况下会有一张幻灯片截图,那么信息量就会比较大(且有用)。
- 笔记记什么?
- 关键词(不要试图尝试记所有听到的内容,没有必要)
- 使用缩写,符号。找到最为适合自己的笔记法。
- 10秒口语表达开始之前根据笔记组织语言。
- 组织语言:
- 还是跟DI一样的,总-分-总。(具体来看几个模板)
- 同样,如果词穷了,使用之前提到的「插科打诨」法。
2.5.1 RL 模版A
主要对象A,A的关联对象B和C,A的动词D,A的肯定形容词A1. The main point of the lecture is about how A has become a debating issue in terms of both B & C. The speaker points out that it is B that could make A more A1. While there has been a new perspective of D-ing A among scholars, who believe that C is also a valuable contributing factor. Because C is argued to greatly affect how A can be D-ed in a critical point of view. Examples are given to demonstrate that it is vital for us to learn how to D A in a more A1 way with both B and C taken into consideration.
2.5.2 RL 模版B
The lecture talks about XXXXX. This lecture has provided a lot of useful information. According to the lecture, the speaker has talked about XXXXX. This is a very important issue, and we should all pay attention to it. Additionally, the speaker has also mentioned about XXXXX. It is also clear from this speaker that the example of XXXXX is also very important. In conclusion, this lecture is very informative.
2.5.3 RL 模版C
The lecture talks about XXXXX. This lecture has provided a lot of useful information. The speaker argues this with supporting details. According to the speaker, XXXXX. And the speaker has also mentioned that XXXXX. The speaker has also given an example of XXXXX. In addition, he also gives information about XXXXX. According to him, XXXXX. And XXXXX. In conclusion, this lecture is very informative.
- 不难看出,其实真正我们在一个lecture中想要说的关键内容很少,其他都是用填充时间的废话。
2.5.4 RL例题
audio
2.6 answer short question
- 智力问答。
- 没什么准备的策略, 就是去刷机经里的题型。
- 题目多,但也有相当的重复度。
- 有一些二选一或者三选一的题目,如果实在不会就从备选项里蒙一个。
- 集中注意力,快节奏。
- 回答尽量用一个词或者几个词解决,不需要「完整答案」。
- 如果意识到自己回答错了,赶紧纠正,因为分数只依照正确词汇的出现来判断。
audio