Chapter 2 Introduction
“The Grand Slam tournaments, also called majors, are the four most important annual tennis events. They offer the most ranking points, prize money, public and media attention, the greatest strength and size of field, and greater number of”best of" sets for men. The Grand Slam itinerary consists of the Australian Open in mid January, the French Open around late May through early June, Wimbledon in June-July, and the US Open in August-September. Each tournament is played over a two-week period. The Australian and United States tournaments are played on hard courts, the French on clay, and Wimbledon on grass." - Wikipedia
One of the significant benefits of Data visualizations is making big or small data easier for the human brain to understand, that makes it easier to detect patterns, trends, and outliers in groups of data. Good data visualizations always place meaning into complicated datasets so that their message is clear and concise.
Our application leverages some of the concrete analysis examples and provide efficient, effective, functional, and convenient model for users.
Domain Problem Characterization:
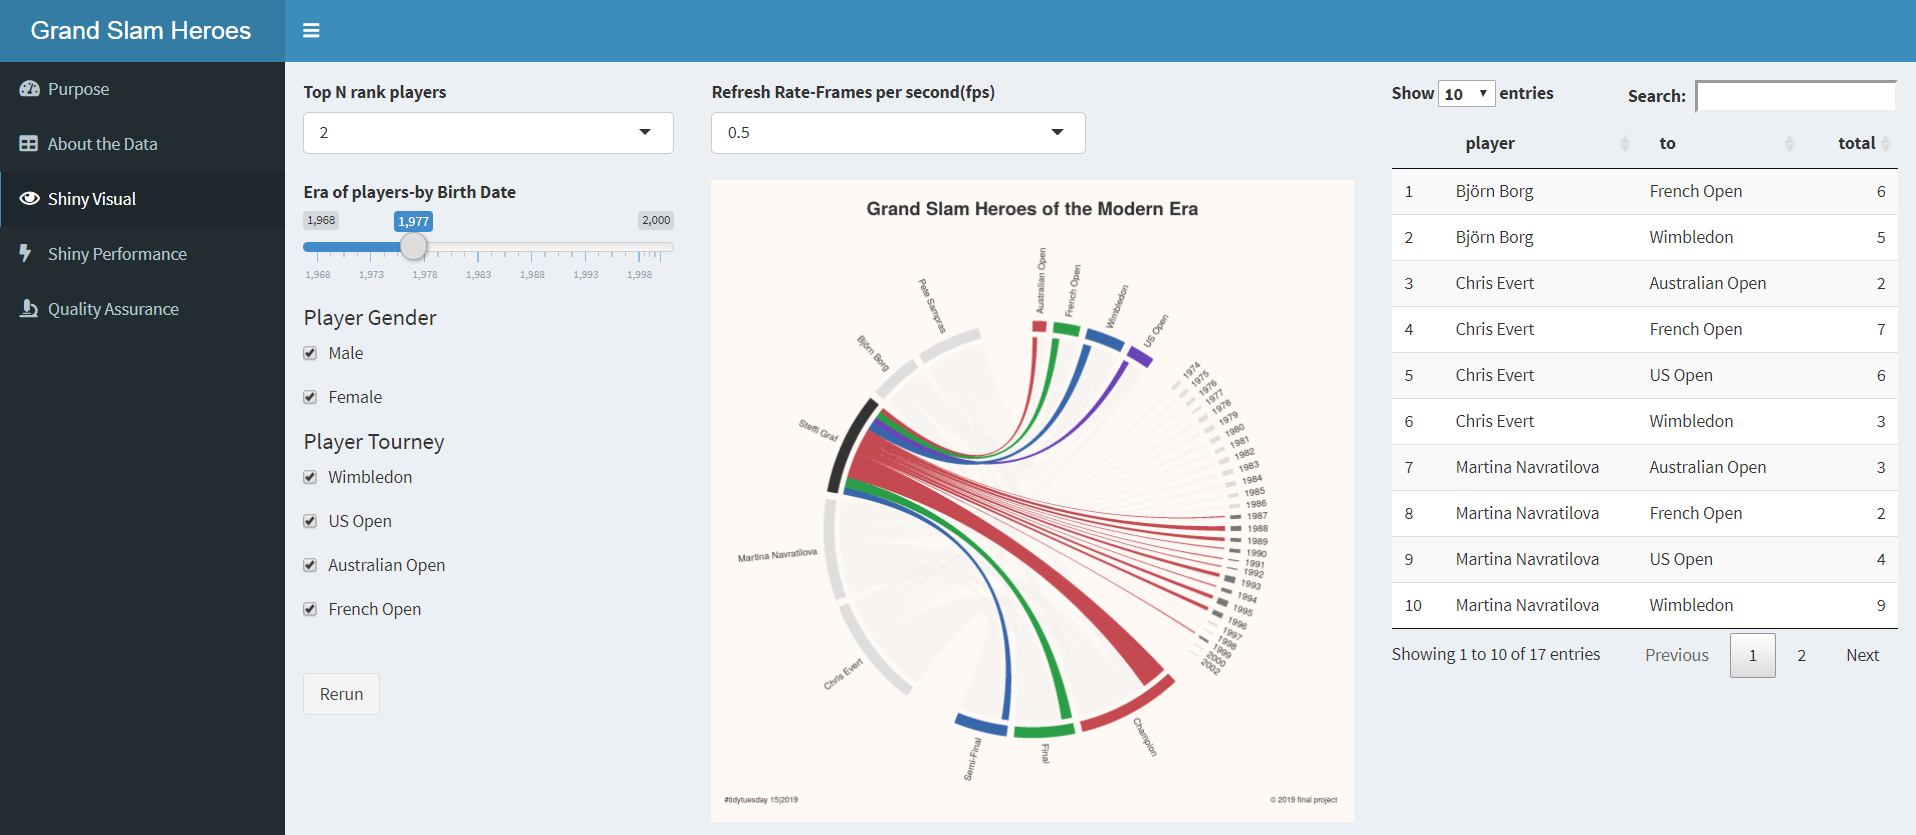
The purpose of our project is to find out the best player in any era of tennis by birth year, classify them according to courts further drill down into gender and by year of tournament. We then next look under the hood to ensure the visual works as designed with good performance and quality.
knitr::include_graphics('images/Capture_awesome.PNG')