Chapter 4 Theoretical Framework
This chapter presents theoretical basis of the models and the algorithms that we will use to model customer portfolios. As a customer’s lifetime in a portfolio is usually represented by the time to churn, duration models are adapted to the data we have at our disposal. Thus, it is decided to introduce standard survival techniques as well as machine learning algorithms suited to time-to-event data. Methods to estimate customer’s value are also introduced in this chapter.
4.1 Duration models
According to Cameron & Trivedi (Cameron and Trivedi 2005), duration models (also called survival models) aims at measuring the time spent in a certain state before transitioning to another state. In Econometrics,
- a state corresponds to the class in which an individual \(i\) is at time \(t\).
- a transition is movement from one state to another.
- a duration measures the time spent in a certain state and is also called a spell length.
Since measuring the time until the event is needed for multiple purposes, duration analysis is used in a variety of economic sectors as depicted by the following table.
| Economic sector | Purpose |
|---|---|
| Macroeconomics | Length of an unemployment spell |
| Insurance | Risk analysis to offer a segmented pricing |
| Engineering | Time until a device breaks down |
| Epidemiology | Survival time of a virus |
| Churn analysis | Time until a customer leave the portfolio |
4.1.1 Censoring and Truncation
When dealing with survival data, some observations are usually censored meaning they are related to spells which are not completely observed. Duration data can also suffer from a selection bias which is called truncation.
Censoring mechanisms
Left-censoring occurs when the event of interest occurs before the beginning of the observation period. For example, an individual is included in a study of duration of unemployment at \(t_0\). At that time he has already been unemployed for a period but he cannot recall exactly the duration of this period. If we observe that he finds a job again at \(t_1\), we can only deduce that the duration of unemployment is bigger than \(t_1-t_0\), this individual is left-censored. Observation 2 on figure 4.1 is associated with a left-censored spell (Liu 2019).
A spell is considered right-censored when it is observed from time \(t_0\) until a censoring time \(t_c\) as illustrated by observation 1 on figure 4.1. For instance, the lifetime related to a customer who has not churned at the end of the observation period is right-censored. Let us note \(X_i\) the duration of a complete spell and \(C_i\) the duration of a right-censored spell. We also note \(T_i\) the duration actually observed and \(\delta_i\) the censoring indicator such that \(\delta_i = 0\) if the spell is censored. Then, \((t_1, \delta_1),\dots,(t_N, \delta_N)\) are the realizations of the following random variables:
\[ \begin{align} T_i & = \min(X_i, C_i) \\ \delta_i & = \mathbb{1}_{X_i < C_i} \end{align} \]
Selection bias
Survival data suffers from a selection bias (or truncation) when only a sub-sample of the population of interest is studied. A customer entering the firm’s portfolio after the end of the study is said to be right-truncated, whereas a client who has left the portfolio before the beginning of the study is considered left-truncated. Mathematically, a random variable \(X\) is truncated by a subset \(A \in \mathbb{R}^+\) if instead of \(\Omega(X)\), we solely observe \(\Omega(X)\bigcap A\). On figure 4.1, the first and fifth observations suffers from a selection bias.
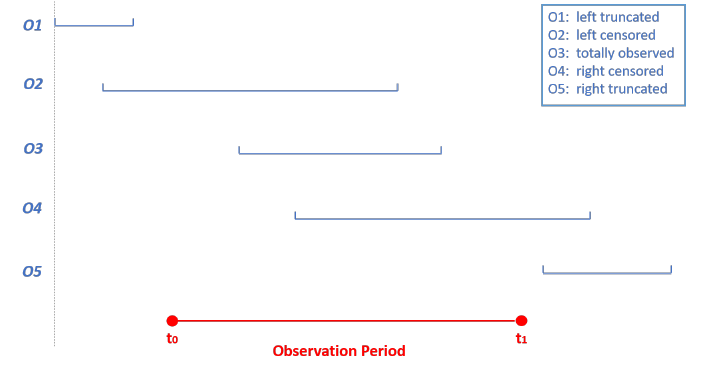
Figure 4.1: Censored and truncated data