Chapter 12 Technical
12.1 DATA
Data for CSVS SPC QA is sourced from Azara. Once each of the two reports is downloaded (in Excel format), it is read into R (on RSTUDIO platform) for Exploratory Data Analysis (EDA) and data munging.
12.1.1 Azara Reports.
Here’s the link to the Azara reports: https://app.azarahealthcare.com/Report/View/218
12.1.1.1 Configure and run Azara report

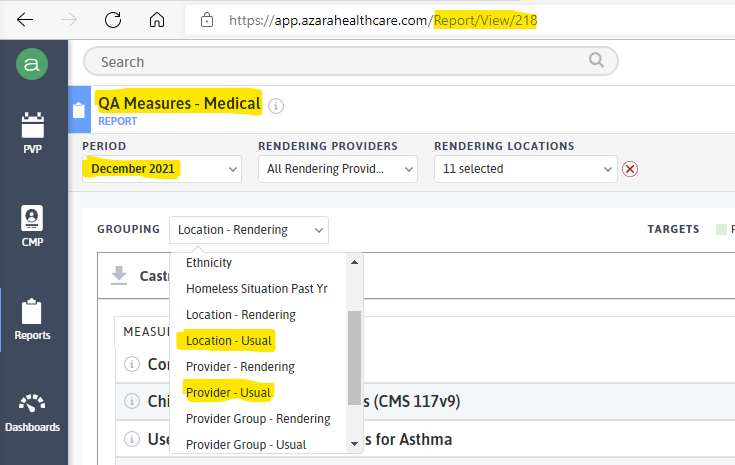
Figure 12.1: Report Screenshot
Note highlights above:
Azara-assigned View#.
Name of Report in Azara
Period: select Month-Year to include the latest full month results. Note: can only get one month at a time.
Report grouping:
by “Location - Usual” for clinic-based results
by “Providers-Usual” (closest thing to PCP) for provider-based results
Export reports to your desktop and Save in format / template:
“QA_Measures_Medical_clinics_dec21.xlsx”
“QA_Measures_Medical_pcp_dec21.xlsx”
Note grouping representation in the file names, as well as month-year
Save to appropriate SPC QA R/RSTUDIO Project root folder
12.1.2 R / RStudio
12.1.2.1 read-in and prepare new files
main.R
The base dataset was derived from codes from this r script file. It batch-combined all monthly reports from October 2020 to November 2021. After the batch execution, the individual files were archived in the Excel Files folder.
main_incrmnt.R
This is the template for adding new monthly data.
#QA Measures Report and Analysis
#Azara Source: https://app.azarahealthcare.com/Report/View/218
##base db Oct 2020- Nov 2021. Use 2 files grouped by 1. Clinics / Locations; 2) grouped by Providers-Usual
###Add months after Nov 2021 incrementally using same dataset manipulations.

setwd(getwd())
library(dplyr)
library(data.table)
library(ggplot2)
library(cusumcharter)
library(ggExtra)
library(anytime)
library(runcharter)
library(spccharter)

library(readxl)
library(dplyr)
library(tidyr)
library(DataExplorer)
library(gt)
library(tibble)
library(data.table)
library(anytime)
library(leaflet.providers)
library(leaflet)
library(leafletR)
library(htmlwidgets)
library(shiny)
library(shinythemes)
library(shinyWidgets)
library(rsconnect)
library(xlsx)
library(stringr)
library(rJava)
library(openxlsx)
library(stringr)
library(tigris)
library(tidyverse)
library(arsenal) #compare datasets
library(kableExtra)
library(ggplot2)
library(formattable)
library(xts)
library(dygraphs)
library(janitor)

#First time around, Batch read excel files https://stackoverflow.com/questions/61761144/r-batch-reading-xls-files-from-specific-sheet #s 1 & 2;
##row-bind multiple df (bind_rows) from above batch with https://dplyr.tidyverse.org/reference/bind.html

# library(readxl)
non_med.prvdr.lst<-c("Atani, Sobha", "Cardenas, Jose", "Chang, Stephen", "Cuevas, Maximiliano", "Gardezy, Najia",  "Hilton, Aldon", "Huerta, William", "Khamis, Wathiq","Ku, Tony Kong",
                     "Labs, Castroville", "Labs, Circle", "Labs, Gonzales","Labs, Greenfield", "Labs, King City", "Labs, N. Main", "Labs, Pajaro", "Labs, Sanborn", "Labs, Soledad",
                      "Nguyen DDS, Hoang Quynh", "Nguyen, Son", "Nunez, Saturnino", "Payne, Martha", "Perez, David", "Reyna, Maria", "Sethi, Anil", "Shadravan, Farnaz",
                      "Stoddard, James", "Takeuchi, Sawako",  "Unassigned Provider", "Williams, Bruce", "Woodel, Nicole", "Zhang, Ding", "Garcia, Anna", "Ly, Tony", "Magana, Maria",
                      "Mancias DDS, Ramiro", "Maurice, Shelby", "Akhimien, Patience", "Darby, Tammy", "Sinnhuber, Vicki", "Wright FNP, Ellen", "Lizarraga, Oskar")

# file.list <- list.files(pattern='*.xlsx')
# trlyrnov_21 <- bind_rows(map(file.list, read_excel, sheet = 'Results')) #rendering provider DB
# QA_msrs_med.db<-trlyrnov_21%>%
#   mutate(across(`Completed Referrals`: `Colorectal Cancer Screening (CMS 130v9)`, ~(round(.x*100,1))))%>% #https://dplyr.tidyverse.org/reference/across.html apply fun across cols (need to get back to %age w/o the sign)
#   arrange(Date)%>%
#   rename(provider= `Provider - Rendering`, cmpltd.Rfrls = `Completed Referrals`, chld.Iz.Status = `Childhood Immunization Status (CMS 117v9)`, asthmaRx = `Use of Appropriate Medications for Asthma`,
#          wcc.vsts_3_6=`Well-Child Care Visits (3-6 Yrs)`, wt.bmi.scr.cnsl = `Child Weight Screening / BMI / Nutritional /Physical Activity Counseling (CMS 155v9)`, dm.Ft.Exm =`Diabetes Foot Exam (NQF 0056)`,
#          dm.Eye.Exm= `Diabetes: Eye Exam (CMS 131v9)`, a1cGT9 = `Diabetes A1c >9 (CMS 122v9 Modified)`, htn.cntrld =`Hypertension Controlling High Blood Pressure (CMS 165v9)`, brCaSrn_40_69 = `Breast Cancer Screening Ages 40-69 (NQF 0031)`,
#          cxCaScrn= `Cervical Cancer Screening (CMS 124v9)`, clrctlCaScrn = `Colorectal Cancer Screening (CMS 130v9)`)%>%
#   filter(!provider %in% non_med.prvdr.lst)%>%
#   write_rds(., "QA Medical Measures- Azara.RDS")
#str(QA_msrs_med.db)

# > levels(factor(QA_msrs_med.db$provider))
# [1] "Ali, Asfia"             "Alvarado, Fabian"       "Araneta, Nicole"        "Baylis, Anne"           "Bekele, Metasebia"      "Bulleit, Erin"          "Carrillo, Cristian"     "Cordier, Jennifer"      "Cousineau, Mary"
# [10] "Dao, Huy"               "Erni, Guillermina"      "Garcia, Jocelyn"        "Hack, Terrence"         "Lao-Domingo, Felicidad" "Marchevsky, Sebastian"  "Marquez, Juana Oralia"  "Mendoza, Mirella"       "Morad MD, Rasha"
# [19] "Nkwocha, Oguchi"        "Peng, Bob"              "Pompan MD, Donald"      "Raymond MD, Rebecca"    "Recht MD, Brian"        "Rivas, Andrea"          "Schneider, Jessica"     "Shirrell, Aimee"        "Torres, Rosalicia"
# [28] "Tucker, Jalia"          "Villanueva, Ignacio"    "Yoshiyama, Jon"         "Zeolla, Luke


##############################################################
##############################################################

# ##PCP Database
#
# file.list <- list.files(pattern='*.xlsx')
# pcp.trlyrnov_21 <- bind_rows(map(file.list, read_excel, sheet = 'Results'))
# QA_msrs_med.db.pcp<-pcp.trlyrnov_21%>%
#   mutate(across(`Completed Referrals`: `Colorectal Cancer Screening (CMS 130v9)`, ~(round(.x*100,1))))%>% #https://dplyr.tidyverse.org/reference/across.html apply fun across cols (need to get back to %age w/o the sign)
#   arrange(Date)%>%
#   rename(provider= `Provider - Usual`, cmpltd.Rfrls = `Completed Referrals`, chld.Iz.Status = `Childhood Immunization Status (CMS 117v9)`, asthmaRx = `Use of Appropriate Medications for Asthma`,
#          wcc.vsts_3_6=`Well-Child Care Visits (3-6 Yrs)`, wt.bmi.scr.cnsl = `Child Weight Screening / BMI / Nutritional /Physical Activity Counseling (CMS 155v9)`, dm.Ft.Exm =`Diabetes Foot Exam (NQF 0056)`,
#          dm.Eye.Exm= `Diabetes: Eye Exam (CMS 131v9)`, a1cGT9 = `Diabetes A1c >9 (CMS 122v9 Modified)`, htn.cntrld =`Hypertension Controlling High Blood Pressure (CMS 165v9)`, brCaSrn_40_69 = `Breast Cancer Screening Ages 40-69 (NQF 0031)`,
#          cxCaScrn= `Cervical Cancer Screening (CMS 124v9)`, clrctlCaScrn = `Colorectal Cancer Screening (CMS 130v9)`)%>%
#   filter(!provider %in% non_med.prvdr.lst)%>%
#   write_rds(., "QA Medical Measures-Usual Provider Azara_mar22.RDS")

###
#Increments:
##Dec 2021
###Prepare Dec 2021 file
# QA_msrs_med.dec_21<-read_excel("QA_Measures_Medical_pcp_dec21.xlsx", sheet = 'Results')%>%
#   mutate(across(`Completed Referrals`: `Colorectal Cancer Screening (CMS 130v9)`, ~(round(.x*100,1))),
#          Date=as.Date("2021-12-01", "%Y-%m-%d"))%>% #https://stackoverflow.com/questions/37869057/creating-a-date-column-in-a-data-frame ; #https://dplyr.tidyverse.org/reference/across.html apply fun across cols (need to get back to %age w/o the sign)
#   #arrange(Date)%>%
#   rename(provider= `Provider - Usual`, cmpltd.Rfrls = `Completed Referrals`, chld.Iz.Status = `Childhood Immunization Status (CMS 117v9)`, asthmaRx = `Use of Appropriate Medications for Asthma`,
#            wcc.vsts_3_6=`Well-Child Care Visits (3-6 Yrs)`, wt.bmi.scr.cnsl = `Child Weight Screening / BMI / Nutritional /Physical Activity Counseling (CMS 155v9)`, dm.Ft.Exm =`Diabetes Foot Exam (NQF 0056)`,
#            dm.Eye.Exm= `Diabetes: Eye Exam (CMS 131v9)`, a1cGT9 = `Diabetes A1c >9 (CMS 122v9 Modified)`, htn.cntrld =`Hypertension Controlling High Blood Pressure (CMS 165v9)`, brCaSrn_40_69 = `Breast Cancer Screening Ages 40-69 (NQF 0031)`,
#             cxCaScrn= `Cervical Cancer Screening (CMS 124v9)`, clrctlCaScrn = `Colorectal Cancer Screening (CMS 130v9)`)%>%
#     filter(!provider %in% non_med.prvdr.lst)

#   ###Add main / basic DB saved as RDS file with rbind. Protect from re-running
# incr.db<-read_rds("QA Medical Measures-Usual Provider Azara_mar22.RDS")%>%
#   rbind(., QA_msrs_med.dec_21)%>%
#   arrange(Date)%>%
#   write_rds(., "QA Medical Measures-Usual Provider Azara_mar22.RDS")
#

##################################################################
##################################################################


##CLINICS database

# file.list <- list.files(pattern='*.xlsx')
# clinics.nov_21 <- bind_rows(map(file.list, read_excel, sheet = 'Results'))
# QA_msrs_med.db.clnc<-clinics.nov_21%>%
#   mutate(`Location - Rendering`=str_replace(`Location - Rendering`, " Medical Clinic", ""),
#          `Location - Rendering` =str_replace(`Location - Rendering`, " Medical", ""))%>%
#   mutate(across(`Completed Referrals`: `Colorectal Cancer Screening (CMS 130v9)`, ~(round(.x*100,1))))%>% #https://dplyr.tidyverse.org/reference/across.html apply fun across cols (need to get back to %age w/o the sign)
#   arrange(as.Date(Date))%>%
#   rename(clinic= `Location - Rendering`, cmpltd.Rfrls = `Completed Referrals`, chld.Iz.Status = `Childhood Immunization Status (CMS 117v9)`, asthmaRx = `Use of Appropriate Medications for Asthma`,
#          wcc.vsts_3_6=`Well-Child Care Visits (3-6 Yrs)`, wt.bmi.scr.cnsl = `Child Weight Screening / BMI / Nutritional /Physical Activity Counseling (CMS 155v9)`, dm.Ft.Exm =`Diabetes Foot Exam (NQF 0056)`,
#          dm.Eye.Exm= `Diabetes: Eye Exam (CMS 131v9)`, a1cGT9 = `Diabetes A1c >9 (CMS 122v9 Modified)`, htn.cntrld =`Hypertension Controlling High Blood Pressure (CMS 165v9)`, brCaSrn_40_69 = `Breast Cancer Screening Ages 40-69 (NQF 0031)`,
#          cxCaScrn= `Cervical Cancer Screening (CMS 124v9)`, clrctlCaScrn = `Colorectal Cancer Screening (CMS 130v9)`)%>%
#   mutate(date=as.Date(Date))%>%distinct()%>%
#   select(-Date2)%>%
#   write_rds(., "QA Medical Measures- Rendering clinics Azara_mar22.RDS")

###
#Increments:
##Dec 2021
###Prepare Dec 2021 file


# ###Prepare Dec 2021 file
# QA_msrs_med.db.clnc<-read_excel("QA_Measures_Medical_clinics_dec21.xlsx", sheet = 'Results')%>%
#    mutate(`Location - Rendering`=str_replace(`Location - Rendering`, " Medical Clinic", ""),
#   `Location - Rendering` =str_replace(`Location - Rendering`, " Medical", ""))%>%
#   mutate(across(`Completed Referrals`: `Colorectal Cancer Screening (CMS 130v9)`, ~(round(.x*100,1))), #https://dplyr.tidyverse.org/reference/across.html apply fun across cols (need to get back to %age w/o the sign)
#          Date=as.Date("2021-12-01", "%Y-%m-%d"))%>% #https://stackoverflow.com/questions/37869057/creating-a-date-column-in-a-data-frame)%>%
#   #   arrange(as.Date(Date))%>%
#   rename(clinic= `Location - Rendering`, cmpltd.Rfrls = `Completed Referrals`, chld.Iz.Status = `Childhood Immunization Status (CMS 117v9)`, asthmaRx = `Use of Appropriate Medications for Asthma`,
#        wcc.vsts_3_6=`Well-Child Care Visits (3-6 Yrs)`, wt.bmi.scr.cnsl = `Child Weight Screening / BMI / Nutritional /Physical Activity Counseling (CMS 155v9)`, dm.Ft.Exm =`Diabetes Foot Exam (NQF 0056)`,
#   dm.Eye.Exm= `Diabetes: Eye Exam (CMS 131v9)`, a1cGT9 = `Diabetes A1c >9 (CMS 122v9 Modified)`, htn.cntrld =`Hypertension Controlling High Blood Pressure (CMS 165v9)`, brCaSrn_40_69 = `Breast Cancer Screening Ages 40-69 (NQF 0031)`,
#   cxCaScrn= `Cervical Cancer Screening (CMS 124v9)`, clrctlCaScrn = `Colorectal Cancer Screening (CMS 130v9)`)

# ###Add main / basic DB saved as RDS file with rbind(prottect from repeat runs)
# incrmt.clnc.db<-read_rds("QA Medical Measures- Rendering clinics Azara_mar22.RDS")%>%
#   rbind(., QA_msrs_med.db.clnc)%>%
#   arrange(Date)%>%
#   write_rds(., "QA Medical Measures- Rendering clinics Azara_mar22.RDS")
12.2 January 2022 Update exercise
Data Source for Measures update: At the beginning of each month, we update the Measures Database to include the month ended. The source of the data is Azara reports; use this link to get there: https://app.azarahealthcare.com/Report/View/218. Since you will be using the R-script file, main_incrmnt.R it may be best first to open that file so that you can find and follow the above link.
Two ways to get to the r script file: 1) I have posted it in our shared Google folder; copy and past it to a folder if you have started a RSTUDIO project. 2) double-click the script file and it will open up in RSTUDIO already. CAVEAT: either way, you need to know the folder where the script file is, because we are going to upload all our working files to the same folder, including the saved Azara report.
AZARA report: Follow this link to review the instructions: https://bookdown.org/onkwocha/_book/tchncl.html
RECAP
Note highlights in the reference: Azara-assigned View# (218).
Name of Report in Azara: (QA Measures - Medical)
Period: select Month-Year to include the latest completed month’s results. Note: can only get one month at a time.
Report grouping:
by “Location - Rendering” for clinic-based results
Report FORMAT: “CrossTab” (Important; inadvertently omitted from the cited instructions above)
by “Providers-Usual” (closest thing to PCP) for provider-based results
Report FORMAT: “CrossTab” (Important; inadvertently omitted from the cited instructions above)
Export reports to your desktop and Save in format / template:
“QA_Measures_Medical_clinics_dec21.xlsx”
“QA_Measures_Medical_pcp_dec21.xlsx”
Note grouping representation / embedding (“clinic” or “pcp”) in the file names, as well as month-year (“_dec21”; change to “_mar22)
Save to appropriate SPC QA R/RSTUDIO Project root folder (same folder as your R project or the location of your r script)
R Script: main_incrmnt.R
##QA Measures Report and Analysis
#Azara Source: https://app.azarahealthcare.com/Report/View/218
##base db Oct 2020- Nov 2021. Use 2 files grouped by 1. Clinics / Locations; 2) grouped by Providers-Usual
###Add months after Nov 2021 incrementally using same dataset manipulations.

#Go!
# Declare libraries:


setwd(getwd())
library(dplyr)
library(data.table)
library(ggplot2)
library(cusumcharter)
library(ggExtra)
library(anytime)
library(runcharter)
library(spccharter)
library(readxl)
library(dplyr)
library(tidyr)
library(DataExplorer)
library(gt)
library(tibble)
library(data.table)
library(anytime)
library(leaflet.providers)
library(leaflet)
library(leafletR)
library(htmlwidgets)
library(shiny)
library(shinythemes)
library(shinyWidgets)
library(rsconnect)
library(xlsx)
library(stringr)
library(rJava)
library(openxlsx)
library(stringr)
library(tigris)
library(tidyverse)
library(arsenal) #compare datasets
library(kableExtra)
library(ggplot2)
library(formattable)
library(xts)
library(dygraphs)
library(janitor)

# this list filters off non-current / non-medical providers:
#
non_med.prvdr.lst<-c("Atani, Sobha", "Cardenas, Jose", "Chang, Stephen", "Cuevas, Maximiliano", "Gardezy, Najia",  "Hilton, Aldon", "Huerta, William", "Khamis, Wathiq","Ku, Tony Kong",
                     "Labs, Castroville", "Labs, Circle", "Labs, Gonzales","Labs, Greenfield", "Labs, King City", "Labs, N. Main", "Labs, Pajaro", "Labs, Sanborn", "Labs, Soledad",
                     "Nguyen DDS, Hoang Quynh", "Nguyen, Son", "Nunez, Saturnino", "Payne, Martha", "Perez, David", "Reyna, Maria", "Sethi, Anil", "Shadravan, Farnaz",
                     "Stoddard, James", "Takeuchi, Sawako",  "Unassigned Provider", "Williams, Bruce", "Woodel, Nicole", "Zhang, Ding", "Garcia, Anna", "Ly, Tony", "Magana, Maria",
                     "Mancias DDS, Ramiro", "Maurice, Shelby", "Akhimien, Patience", "Darby, Tammy", "Sinnhuber, Vicki", "Wright FNP, Ellen", "Lizarraga, Oskar")

#

# **Preparing January files**
# First, providers
#
#Increments:
##Jan 2022

##Providers

##Jan 2022
###Prepare Jan 2022 file

QA_msrs_med.mar22<-read_excel("QA_Measures_Medical_pcp_mar22.xlsx", sheet = 'Results')%>%
  mutate(across(`Completed Referrals`: `Colorectal Cancer Screening (CMS 130v9)`, ~(round(.x*100,1))),
         Date=as.Date("2022-03-01", "%Y-%m-%d"))%>% #https://stackoverflow.com/questions/37869057/creating-a-date-column-in-a-data-frame ; #https://dplyr.tidyverse.org/reference/across.html apply fun across cols (need to get back to %age w/o the sign)
  #arrange(Date)%>%
  rename(provider= `Provider - Usual`, cmpltd.Rfrls = `Completed Referrals`, chld.Iz.Status = `Childhood Immunization Status (CMS 117v9)`, asthmaRx = `Use of Appropriate Medications for Asthma`,
         wcc.vsts_3_6=`Well-Child Care Visits (3-6 Yrs)`, wt.bmi.scr.cnsl = `Child Weight Screening / BMI / Nutritional /Physical Activity Counseling (CMS 155v9)`, dm.Ft.Exm =`Diabetes Foot Exam (NQF 0056)`,
         dm.Eye.Exm= `Diabetes: Eye Exam (CMS 131v9)`, a1cGT9 = `Diabetes A1c >9 (CMS 122v9 Modified)`, htn.cntrld =`Hypertension Controlling High Blood Pressure (CMS 165v9)`, brCaSrn_40_69 = `Breast Cancer Screening Ages 40-69 (NQF 0031)`,
         cxCaScrn= `Cervical Cancer Screening (CMS 124v9)`, clrctlCaScrn = `Colorectal Cancer Screening (CMS 130v9)`)%>%
  filter(!provider %in% non_med.prvdr.lst)


# Add main / basic DB saved as RDS file with rbind.
#
# (Commented out so does not generate another cycle of "QA Medical Measures-Usual Provider Azara_mar22.RDS")
#

# incr.pvdr.db<-read_rds("QA Medical Measures-Usual Provider Azara.RDS")%>%
#   mutate(date=as.Date(Date))%>%distinct()%>%
#   rbind(., QA_msrs_med.mar22)%>%
#   arrange(Date)%>%
#   write_rds(., "QA Medical Measures-Usual Provider Azara_mar22.RDS")


# Next, Clinics.

##Clinics
###Prepare Jan 2022 file: clinics. Jan 2022 date column will be added

QA_msrs_med.db.clnc_mar22<-read_excel("QA_Measures_Medical_clinics_mar22.xlsx", sheet = 'Results')%>%
  mutate(`Location - Rendering`=str_replace(`Location - Rendering`, " Medical Clinic", ""),
         `Location - Rendering` =str_replace(`Location - Rendering`, " Medical", ""))%>%
  mutate(across(`Completed Referrals`: `Colorectal Cancer Screening (CMS 130v9)`, ~(round(.x*100,1))), #https://dplyr.tidyverse.org/reference/across.html apply fun across cols (need to get back to %age w/o the sign)
         Date=as.Date("2022-03-01", "%Y-%m-%d"))%>% #https://stackoverflow.com/questions/37869057/creating-a-date-column-in-a-data-frame)%>%
  #   arrange(as.Date(Date))%>%
  rename(clinic= `Location - Rendering`, cmpltd.Rfrls = `Completed Referrals`, chld.Iz.Status = `Childhood Immunization Status (CMS 117v9)`, asthmaRx = `Use of Appropriate Medications for Asthma`,
         wcc.vsts_3_6=`Well-Child Care Visits (3-6 Yrs)`, wt.bmi.scr.cnsl = `Child Weight Screening / BMI / Nutritional /Physical Activity Counseling (CMS 155v9)`, dm.Ft.Exm =`Diabetes Foot Exam (NQF 0056)`,
         dm.Eye.Exm= `Diabetes: Eye Exam (CMS 131v9)`, a1cGT9 = `Diabetes A1c >9 (CMS 122v9 Modified)`, htn.cntrld =`Hypertension Controlling High Blood Pressure (CMS 165v9)`, brCaSrn_40_69 = `Breast Cancer Screening Ages 40-69 (NQF 0031)`,
         cxCaScrn= `Cervical Cancer Screening (CMS 124v9)`, clrctlCaScrn = `Colorectal Cancer Screening (CMS 130v9)`)

# Add to main / basic DB saved last month / earlier as RDS file with rbind
#
#(Commented out so does not generate another cycle of "QA Medical Measures- Rendering clinics Azara_mar22.RDS")
# incrmt.clnc.db<-read_rds("QA Medical Measures- clinics Azara.RDS")%>%
#   rbind(., QA_msrs_med.db.clnc_mar22)%>%
#   arrange(Date)%>%
#   write_rds(., "QA Medical Measures- Rendering clinics Azara_mar22.RDS")


# Files saved as .RDS are complete and portable. We now have 2 such files saved to the folder:
#
# "QA Medical Measures-Usual Provider Azara.RDS"
#
# "QA Medical Measures- clinics Azara.RDS"
#
# We will call on these files in the rest of the analysis
#
# **Current Measure targets** (FYI)
#
12.2.1 Measures & Current Targets used by Azara:
Measure Target in prcnt
Completed Referrals NA
Childhood Immunization Status NA
Use of appropriate medication for asthma 80.0
Well-Child Care Visits (3-6 Yrs) NA
Child Weight Screening / BMI / Nutrition /Physical Activity Counseling NA
Diabetes Foot Exam 75.0
Diabetes: Eye Exam 90.0
Diabetes A1c >9 16.0
Hypertension Controlling High Blood Pressure NA
Breast Cancer Screening Ages 40-69 71.0
Cervical cancer Screening 90.0
Colorectal Cancer Screening 90.0
*“NA” means no target set, defaulting to mean.
12.2.2 main_incrmnt.R** file
shows commented-out contents of the original file, main.R
shows how to filter for current providers
shows how to filter for clinic / locations
shows how to add the current month-year column to the newly read-in file before merging it with the current base file (using December 2021 as an example)
shows how to save the incremented dataset as .RDS to make it portable and reusable as an R object
shows extras, also:
names of providers in the dataset
names of the clinics in the dataset
names of Measures and their respective target
12.3 Root Cause Analysis
12.3.1 Ishikawa / Fishbone plots in group-brainstorming.
12.3.1.1 Cause & Effect Analysis: the Fishbone plot
(Using some of our measures as example)
12.3.1.1.1 SixSigma version
library(SixSigma)

measure<-"a1c>9%"
causes.grp<-c("Patient", "Provider", "Regimen", "Other")
causes<-vector(mode = "list", length = length(causes.grp))
causes[1] <- list(c("diet", "activity", "appointments", "logistics", "compliance", "in/dependence", "SMBG"))
causes[2] <- list(c("provider inertia", "ordering freq", "pt counselling", "pt education"))
causes[3] <- list(c("expense", "Rx instructions", "Rx side-effects"))
causes[4] <- list(c("other"))
ss.ceDiag(measure, causes.grp, causes, sub = "SPC QA  Project",  main = "Measure: A1c>9% -- Cause & Effect Analysis",
          ss.col = c("#666666", "#BBBBBB", "#CCCCCC", "#DDDDDD", "#EEEEEE")
)
Figure 12.2: SixSigma Fishbone diagrams
12.3.1.1.2 qcc version
library(qcc)
cause.and.effect(cause=
                   list(
                     Patient=c("diet", "activity", "appointments", "logistics", "compliance"),
                     Provider=c("provider inertia", "ordering freq", "pt counselling", "pt education"),
                     Regimen=c("expense", "Rx instructions", "Rx side-effects"),
                     Other=c("other")
                     ),
                 effect="a1c>9%",
title = "Cause-and-Effect diagram for a1c>9%") 
Figure 12.3: qcc Fishbone diagram
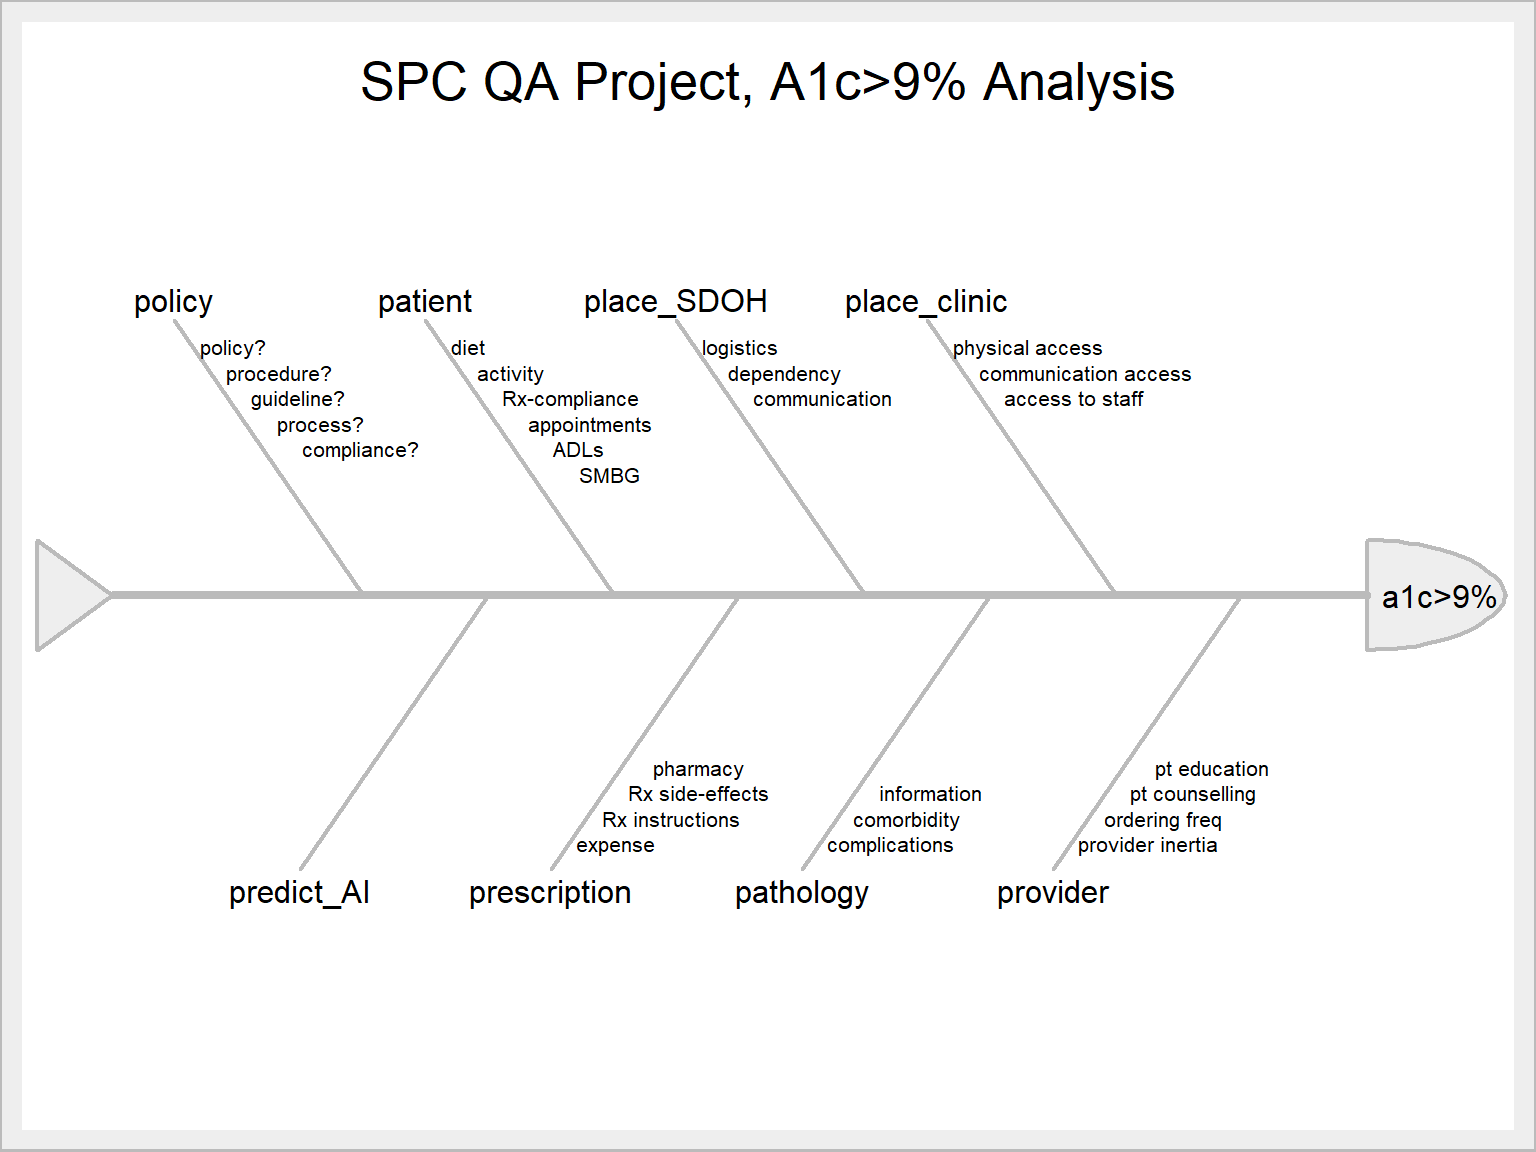
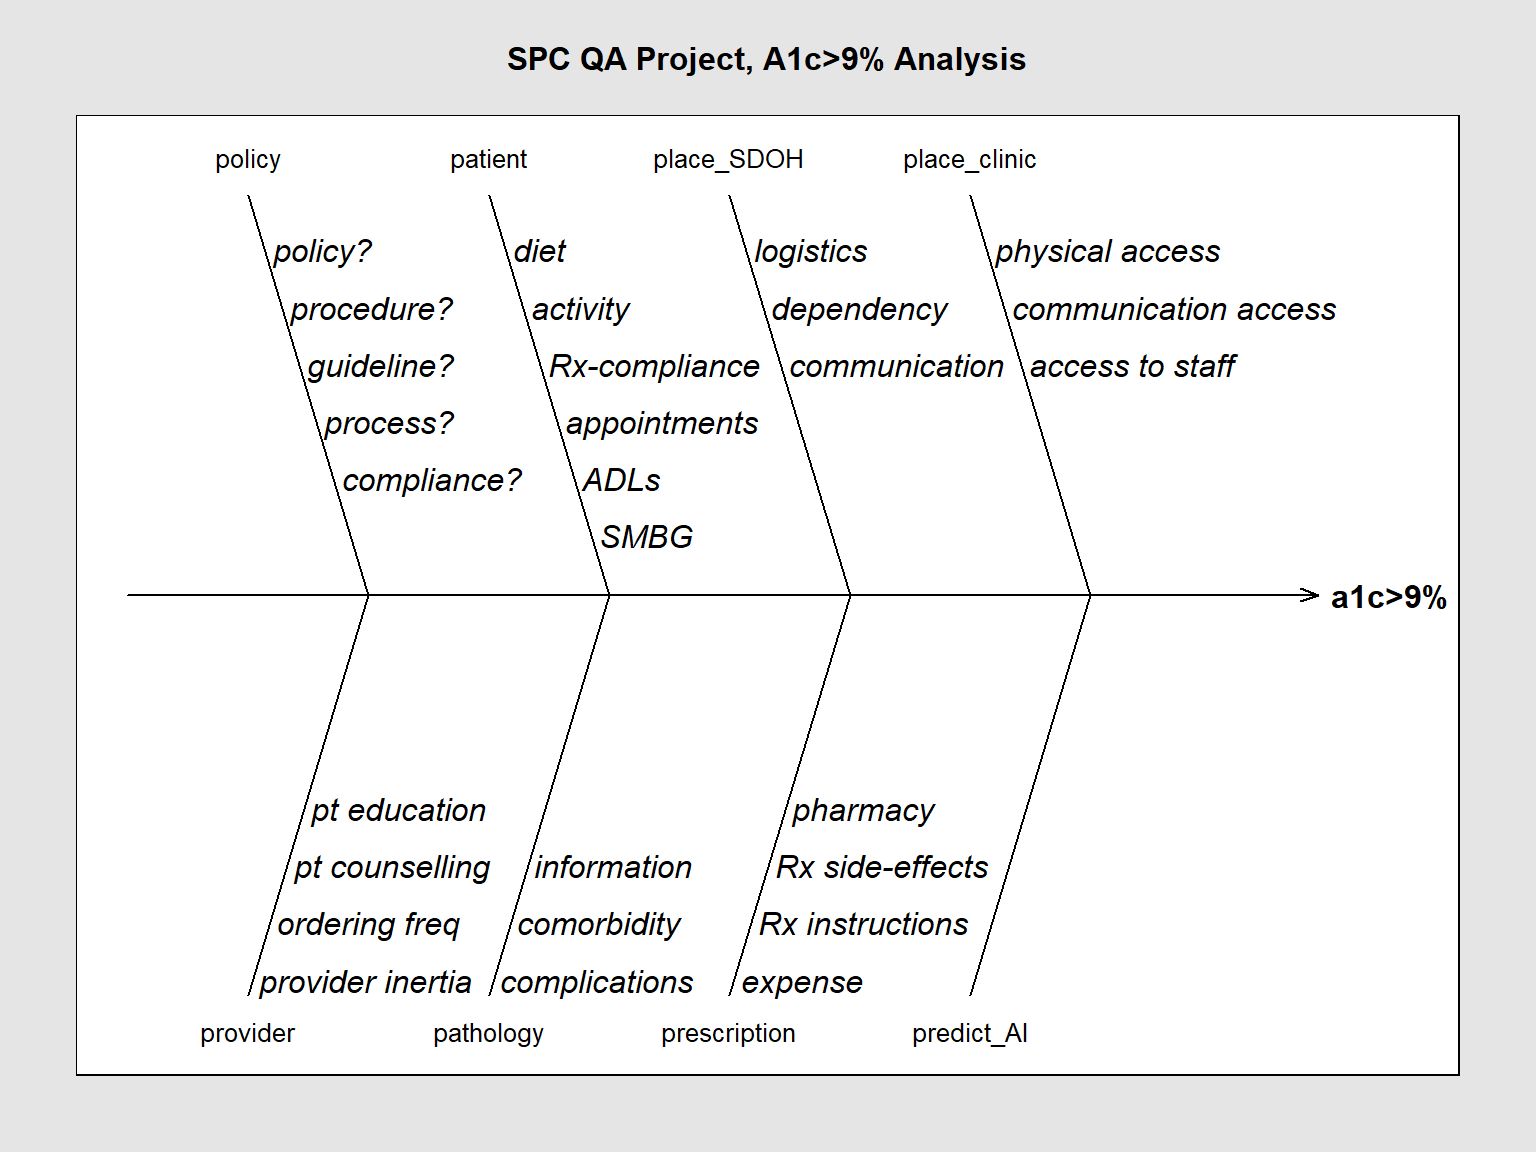
12.3.1.2 Updated Fishbone Plot Feb 2 2022
We are in the process of acquiring an AI (“Artificial Intelligence”) application. One use of it will be to analyze and rank the parameters that contribute to the value of any outcome we choose. For example, it should be able to list what factors (“features” or variables) contribute to each particular measure performance score.
This information will be useful for our root-cause analysis using the Ishikawa plot.
We will now add “AI” to our template as “predict_AI”
SixSigma Version
library(SixSigma)

measure<-"a1c>9%"
causes.grp<-c(
  "policy",
  "patient",
  "place_SDOH",
  "place_clinic",
  "provider",
  "pathology",
  "prescription",
  "predict_AI")

causes<-vector(mode = "list", length = length(causes.grp))

causes[1] <- list(c("policy?", "procedure?", "guideline?", "process?", "compliance?"))
causes[2] <- list(c("diet", "activity", "Rx-compliance", "appointments", "ADLs", "SMBG"))
causes[3] <- list(c("logistics", "dependency", "communication"))
causes[4] <- list(c("physical access", "communication access", "access to staff"))
causes[5] <- list(c("provider inertia", "ordering freq", "pt counselling", "pt education"))
causes[6] <- list(c("complications", "comorbidity", "information"))
causes[7] <- list(c("expense", "Rx instructions", "Rx side-effects", "pharmacy"))
causes[8] <- list(c(""))
SixSigma::ss.ceDiag(measure, causes.grp, causes, sub = "", main = "SPC QA Project, A1c>9% Analysis",
                    ss.col = c("#666666", "#BBBBBB", "#CCCCCC", "#DDDDDD", "#EEEEEE")

)
qcc Version
library(qcc)

qcc::cause.and.effect(cause=
                        list(
                          policy=c("policy?", "procedure?", "guideline?", "process?", "compliance?"),
                          patient=c("diet", "activity", "Rx-compliance", "appointments", "ADLs", "SMBG"),
                          place_SDOH=c("logistics", "dependency", "communication"),
                          place_clinic=c("physical access", "communication access", "access to staff"),
                          provider=c("provider inertia", "ordering freq", "pt counselling", "pt education"),
                          pathology=c("complications", "comorbidity", "information"),
                          prescription=c("expense", "Rx instructions", "Rx side-effects", "pharmacy"),
                          predict_AI=c("")
                        ),
                      effect="a1c>9%",
                      title = "SPC QA Project, A1c>9% Analysis",
                      cex = 0.8


)