Chapter 4 Cause & Effect Analysis: the Fishbone plot
(Using A1c > 9 as example)
4.0.1 SixSigma version
library(SixSigma)

measure<-"a1c>9%"
causes.grp<-c("Patient", "Provider", "Regimen", "Other")
causes<-vector(mode = "list", length = length(causes.grp))
causes[1] <- list(c("diet", "activity", "appointments", "logistics", "compliance", "in/dependence", "SMBG"))
causes[2] <- list(c("provider inertia", "ordering freq", "pt counselling", "pt education"))
causes[3] <- list(c("expense", "Rx instructions", "Rx side-effects"))
causes[4] <- list(c("other"))
ss.ceDiag(measure, causes.grp, causes, sub = "SPC QA  Project",  main = "Measure: A1c>9% -- Cause & Effect Analysis",
          ss.col = c("#666666", "#BBBBBB", "#CCCCCC", "#DDDDDD", "#EEEEEE")
)
4.0.2 qcc version
library(qcc)
cause.and.effect(cause=
                   list(
                     Patient=c("diet", "activity", "appointments", "logistics", "compliance"),
                     Provider=c("provider inertia", "ordering freq", "pt counselling", "pt education"),
                     Regimen=c("expense", "Rx instructions", "Rx side-effects"),
                     Other=c("other")
                     ),
                 effect="a1c>9%",
title = "Cause-and-Effect diagram for a1c>9%") 
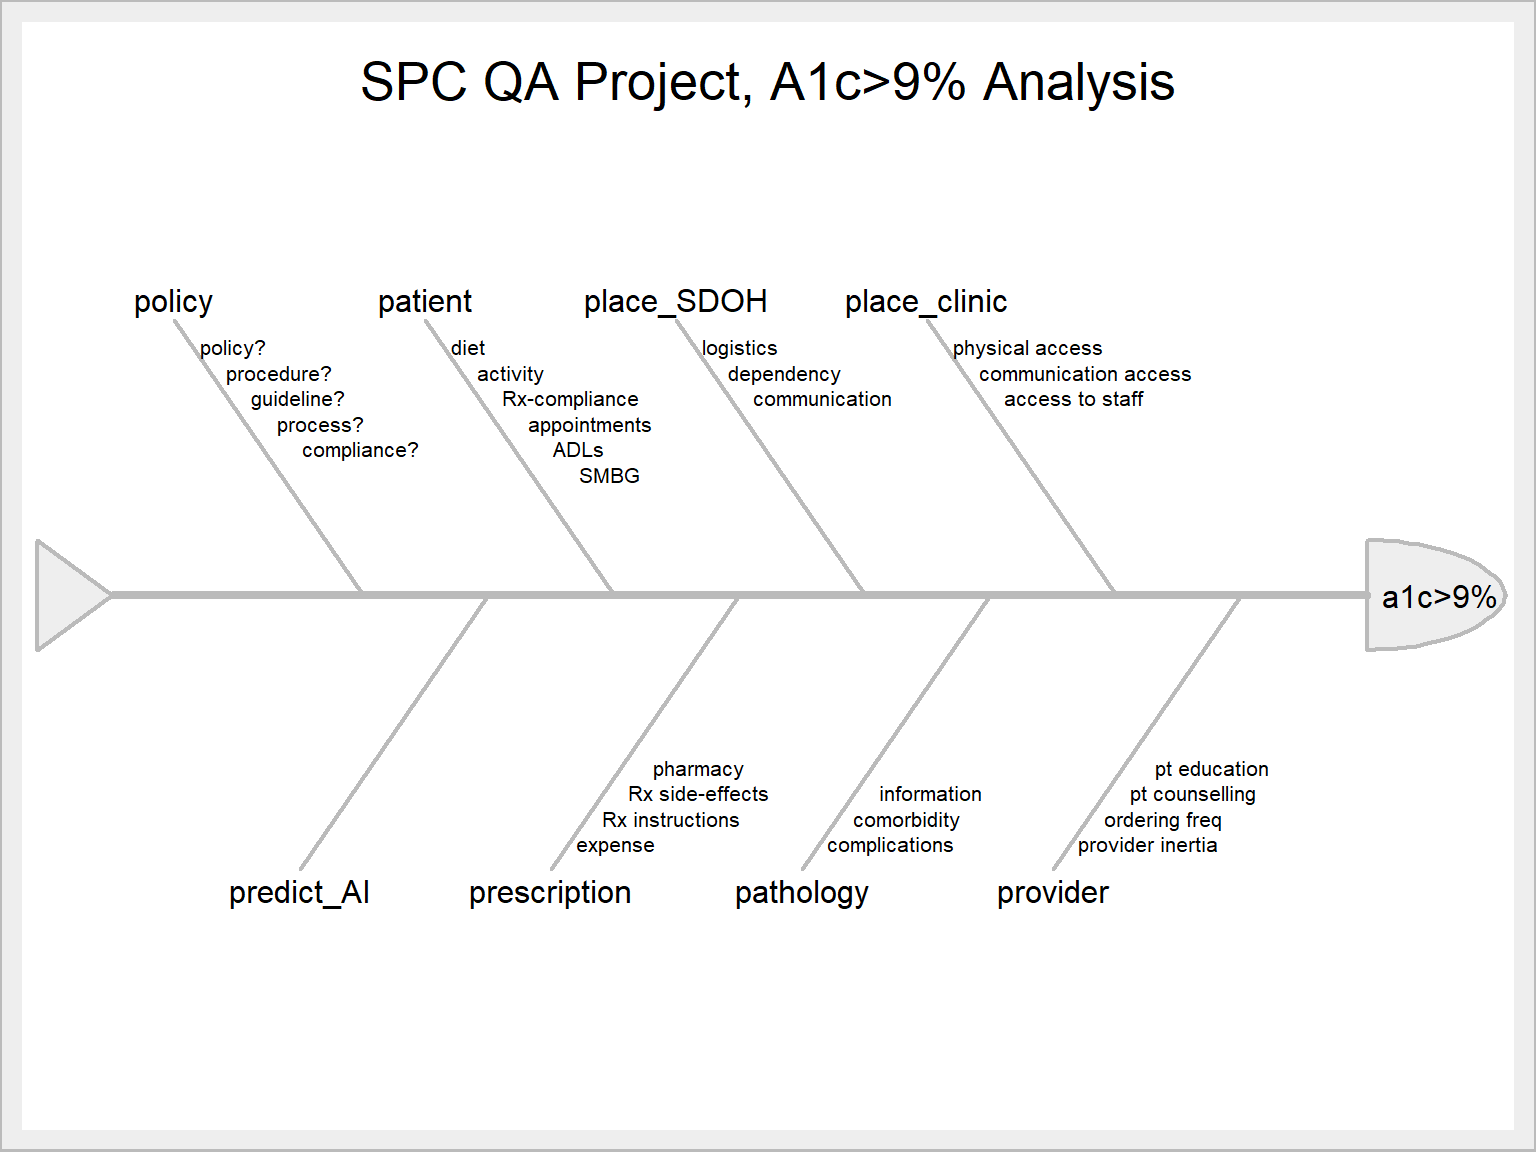
4.1 Updated plot schema Feb 2 3022
We are in the process of acquiring an AI (“Artificial Intelligence”) application. One use of it will be to analyze and rank the parameters that contribute to the value of any outcome we choose. For example, it should be able to list what factors (“features” or variables) contribute to each particular measure performance score.
This information will be useful for our root-cause analysis using the Ishikawa plot.
We will now add “AI” to our template as “predict_AI”
SixSigma Version
library(SixSigma)

measure<-"a1c>9%"
causes.grp<-c(
  "policy",
  "patient",
  "place_SDOH",
  "place_clinic",
  "provider",
  "pathology",
  "prescription",
  "predict_AI")

causes<-vector(mode = "list", length = length(causes.grp))

causes[1] <- list(c("policy?", "procedure?", "guideline?", "process?", "compliance?"))
causes[2] <- list(c("diet", "activity", "Rx-compliance", "appointments", "ADLs", "SMBG"))
causes[3] <- list(c("logistics", "dependency", "communication"))
causes[4] <- list(c("physical access", "communication access", "access to staff"))
causes[5] <- list(c("provider inertia", "ordering freq", "pt counselling", "pt education"))
causes[6] <- list(c("complications", "comorbidity", "information"))
causes[7] <- list(c("expense", "Rx instructions", "Rx side-effects", "pharmacy"))
causes[8] <- list(c(""))
SixSigma::ss.ceDiag(measure, causes.grp, causes, sub = "", main = "SPC QA Project, A1c>9% Analysis",
                    ss.col = c("#666666", "#BBBBBB", "#CCCCCC", "#DDDDDD", "#EEEEEE")

)
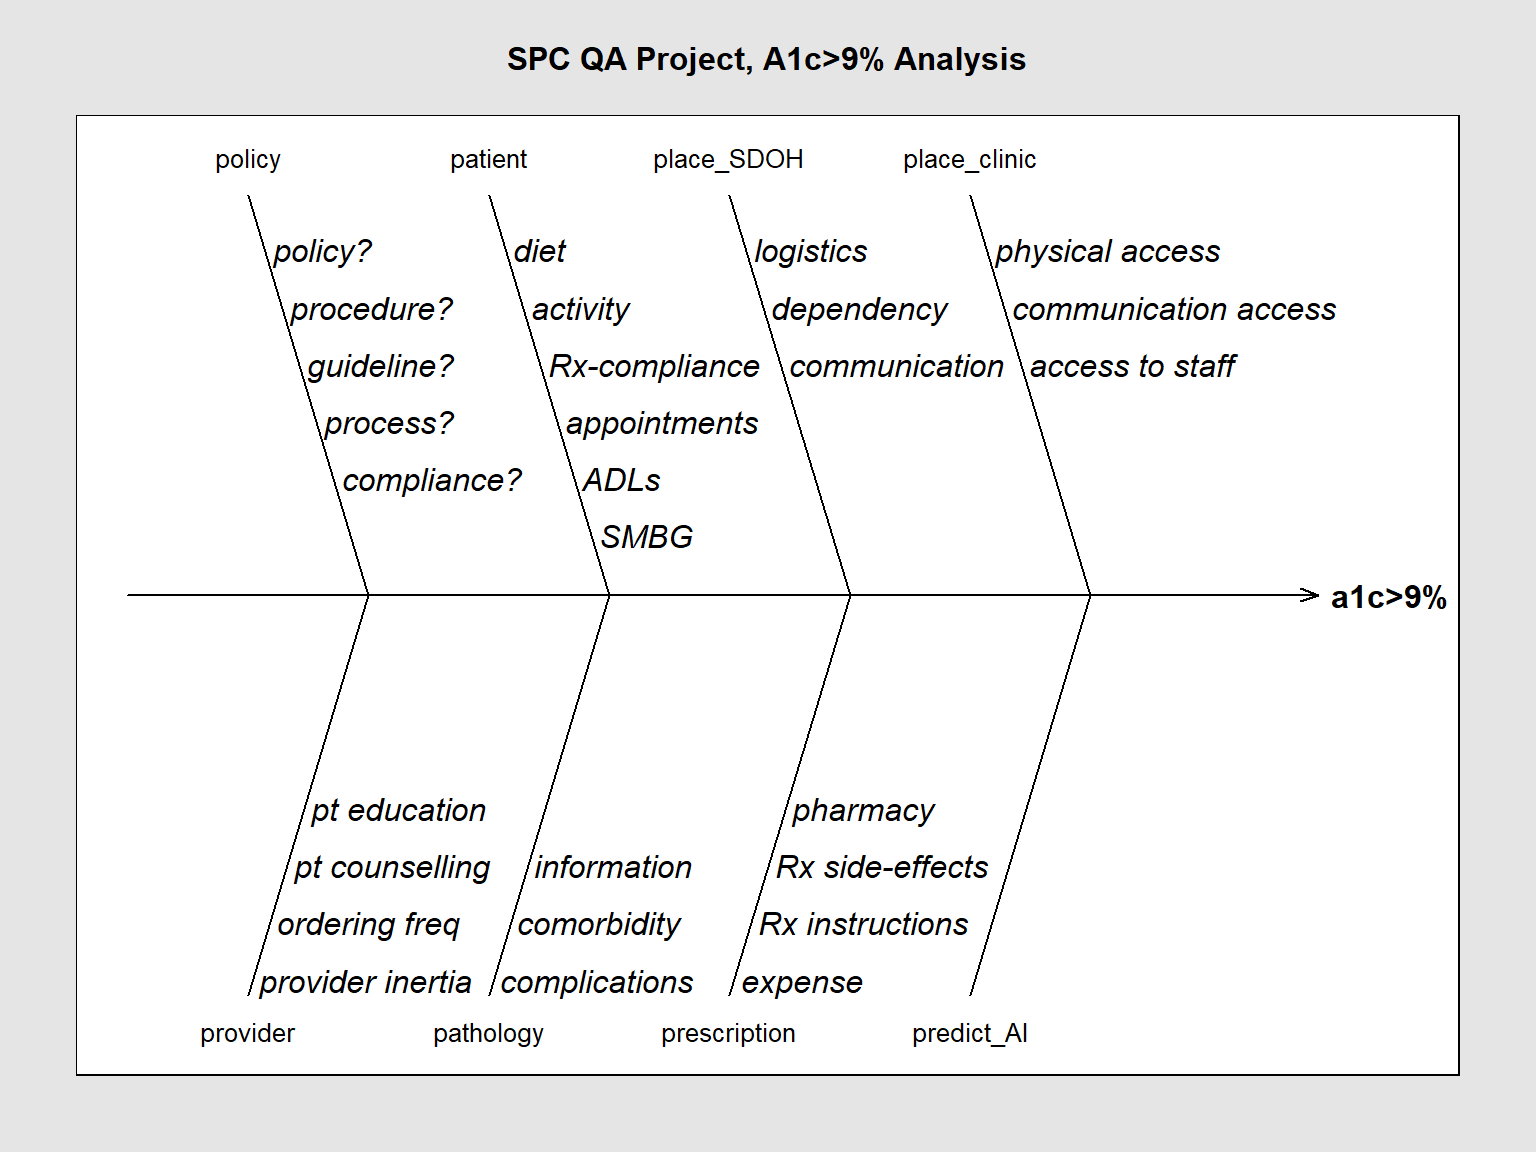
qcc Version
library(qcc)

qcc::cause.and.effect(cause=
                        list(
                          policy=c("policy?", "procedure?", "guideline?", "process?", "compliance?"),
                          patient=c("diet", "activity", "Rx-compliance", "appointments", "ADLs", "SMBG"),
                          place_SDOH=c("logistics", "dependency", "communication"),
                          place_clinic=c("physical access", "communication access", "access to staff"),
                          provider=c("provider inertia", "ordering freq", "pt counselling", "pt education"),
                          pathology=c("complications", "comorbidity", "information"),
                          prescription=c("expense", "Rx instructions", "Rx side-effects", "pharmacy"),
                          predict_AI=c("")
                        ),
                      effect="a1c>9%",
                      title = "SPC QA Project, A1c>9% Analysis",
                      cex = 0.8


)