Chapter 1 Retinal Communication During Blindness
1.1 Introduction
A central theme in neuroscience is the application of an accurate representation of the neural code. The underlying question can be stated as follows: given some observable signal x (a visual stimulus like an image of a tree or a moving bar), what is the probability of a response y (for example, an individual action potential). From this framework, it is clear that studies involving neural coding are fundamentally statistical and may also apply to all areas of the nervous system. In prior retina studies, neural coding has been used to understand the functional effects of RP. Nevertheless, we feel there is a large gap in knowledge about retinal encoding during RP – especially with an information theoretic perspective – to justify this presentation of our findings.
The physiology of retinal ganglion cells (RGCs) using rodent RP models has been reported, in terms of the spontaneous spiking activity, receptive field properties, and the spike train consistency (Lund et al. 1998; Pu, Xu, and Zhang 2006; Puthussery et al. 2009; Sauve et al. 2001; Sekirnjak et al. 2011; Stasheff 2008; Stasheff, Shankar, and Andrews 2011; Yu et al. 2017; Yoon et al. 2020). These studies suggested a loss in the inhibition and excitation ability of the retina with RP. These disruptions resulted in increased spontaneous activity from the retina, loss of receptive field sensitivity, and worsening of the spike train consistencies. Overall, these observations point to a decline in the reliability of retinal activity and potentially a reduction in the information transmission. In addition, since rods die before cones in RP, a natural question is to understand how RGC signals depend on their respective pathways. Uncovering these functional subtleties will better assess the vision loss during RP.
There are signs that function is maintained in spite of the damage to the retinal hardware. Another report (Stutzki et al. 2016) suggested retinal messages are reliable in blind mice. These researchers investigated the receptive field, which is the average spatial and temporal features of the stimulus that caused an RGC to fire. Even with blindness, they found that receptive field properties were maintained. This suggests retinal messages to the brain are intact and informative. An explanation for this functional preservation may lie in the particular neural pathways. Instead of stimuli from a light source, the researchers used a microchip device to stimulate the retina. Electrical stimulation though is not as robust in inducing cellular responses like those from a light stimulus. An experiment using a stimulus at varying light levels would provide more clarity. This newer approach would describe how separate retinal circuits are functionally altered and explain the variability in prior RP physiology reports.
The information rate using the direct method (see Fig 5) is an insightful method to measure the performance of the retina for a few reasons. First, the tool does not assume a model between the stimuli and responses or require parameterization with the stimulus features (Ruyter van Steveninck et al. 1997; Strong et al. 1998). This tool constructs distributions of the neural responses and their stimuli without assumptions regarding their shape (Quian Quiroga and Panzeri 2009). Second, information rate provides a meaningful unit of measurement - bits per second. This quantity can be described as the speed with which a neuron is able to send data about the stimulus. Third, the information rate is a general metric to assess reliability in all upstream neural responses to a stimulus (Ince et al. 2010). Lastly, this analysis serves as the first application of information theory to study diseases in the retina. (Should I put this in the methods section???)
Retinas treated for RP will need a neural code which resembles that of a healthy retina. An important element of normal RGC signaling is the consistency of spike count and spike timing (Berry, Warland, and Meister 1997; Reich et al. 1997; Meister and Berry 1999; Kara, Reinagel, and Reid 2000; Uzzell and Chichilnisky 2004; Koch et al. 2004). Spikes which fire consistently may allow for better mental images of the temporal and spatial dynamics of the visual world. In particular, more consistent visual responses have led to better visual perceptions in prosthetic retinas (Lee, Eddington, and Fried 2013; Jepson et al. 2014). If responses to a stimulus were not reproducible across trials, the brain could incorrectly detect the stimulus as changing. In addition, reports also show less reproducibility in blind than in normal-sighted subjects when using electrical stimulation (Rizzo et al. 2003, @Fariss2000; Marc and Jones 2003). These observations indicate retinal remodeling from degeneration reduces response consistencies and consequently causes poorer visual experiences.
This paper targets the following hypothesis: the effect of retinal degeneration on neural response activity relies on which of the two retinal pathways is used – the rod or the cone pathway. We applied information theory and spike train consistency metrics to analyze spike trains from retinas with RP and healthy retinas. Ultimately, we found that responses with rods progressively became less informative with greater degeneration. In addition, cone-mediated responses of the same stimulus were not as prone to this decline in information rate. Next, we show that under cone light levels, responses to natural motion stimuli are more informative than those under a binary white stimulus. Furthermore, we show that the daylight natural motion signals are least impacted by this disease.
1.2 Methods
1.2.1 Data Collection and Preparation
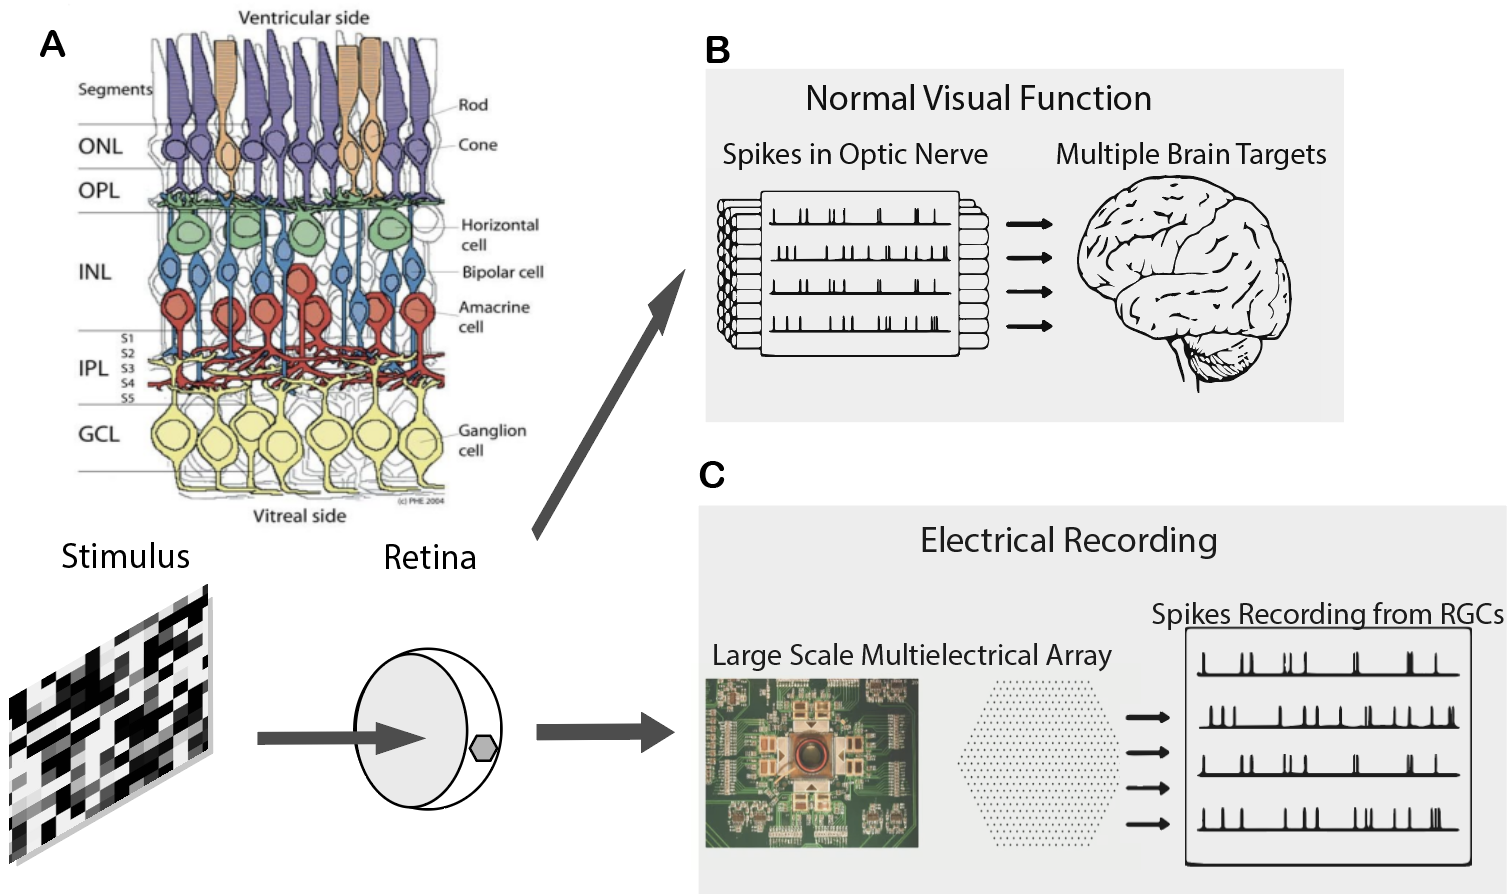
Figure 1.1: (A) Organization of retina (Adapted from (Edqvist, 2006)) (B) Normal process in visual function (C) Procedure in MEA Recordings in these experiments
We use the CNGB1 mouse (ages 30-210 days) to model RP. In these mice, a neoloxP cassette has been inserted into intron 19 of the Cngb1 gene (cyclic nucleotide gated channel, beta-1 subunit). This cassette prevents the expression Cngb1, a critical component of phototransduction whose dysfunction leads to rod death (Biel and Michalakis 2007; Huttl et al. 2005). Mutations in this gene cause RP in humans, giving us the ability to model a genuine cause of blindness (Bareil et al. 2001).
We dissected dorsal pieces of the retina and placed them RGC-side down on an electrode array.The electrode array consisted of 512 electrodes in the shape of a hexagon.
Visual stimuli were created with Matlab code. Stimuli were presented using a computer display. The image from the display was focused onto the photoreceptors using an inverted microscope. The focus was confirmed through adjustements that maximize the spike rate of RGCs over the MEA. The intensity of the stimulus was set using neutral density filters. NDF2 stimuli were used to stimulate mesopic vision, while NDF0 were used to stimulate photopic vision. Natural movie 1 was generated by mounting a video camera to the head of a cat walking through a forest. Movie 2 was generated by mounting a video to a squirrel that is climbing a tree and consisted of faster motions relative to that of the cat movie. 10 second segments of these movies were presented 200 times to estimate mutual information rates.
1.2.2 Direct Method for Mutual Information
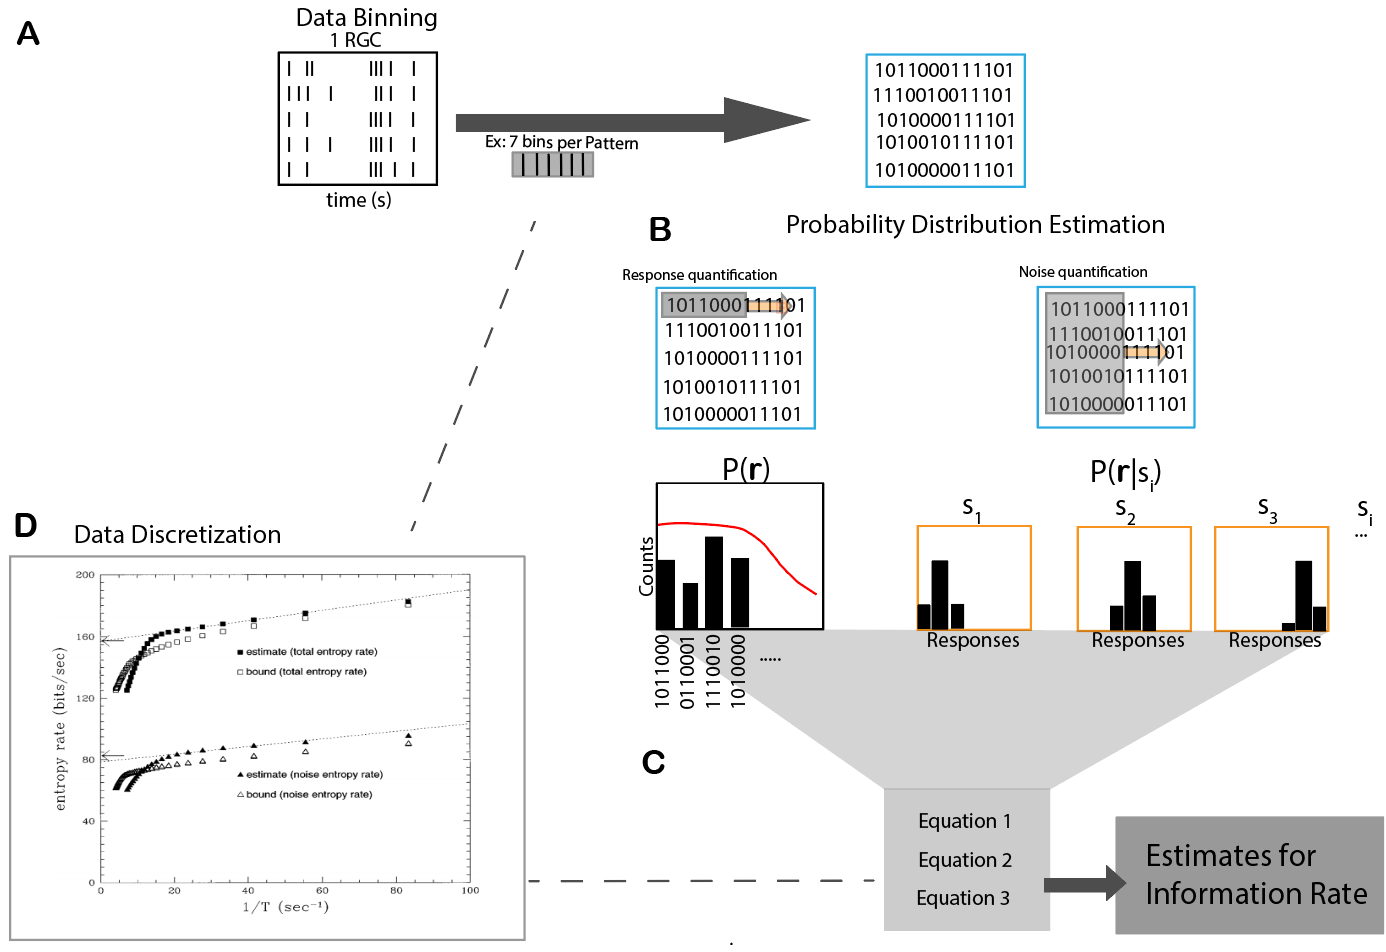
Figure 1.2: (A) Data binning step (B) Probability distribution quantification procedure. (C) Information rate computation (D) Recursive steps to determine appropriate binning (Adapted from (Strong, 1998))
The information rate is the metric we use to measure performance of retinal visual processing. Spike trains from all RGCs were binned to a time resolution that achieved the entropy estimates from the Ma upper bound (Ma 1981.; Strong et al. 1998). The response pattern length was selected using the same procedure, followed by the mutual information calculation of the response patterns using the direct method (Strong et al. 1998; Buracas et al. 1998). The information rate is then computed as the quotient of the mutual information content and the time length of the response pattern.
The mutual information between a response and stimulus is computed as \[\begin{equation} I(S;R)=H(R) - H(R|S) \tag{1.1} \end{equation}\]
I(S;R) is the mutual information about the stimulus contained in the response. H(R) here is defined as the Shannon entropy (Shannon 1948) of the response distribution. This measure quantifies the total capability of a neuron to convey information about the stimulus. H(R|S) is the conditional entropy, a measurement of how noisey neural responses are across repeated trials of a stimulus (Equation 2). To randomize the mutual information rate, each repeat was shifted by a random amount of time using a normal distribution.
\[\begin{equation} H(R|S)= \sum_{s\in S}^{}P(s) \sum_{r\in R}^{} P(r|s)log_{2}(r|s) \tag{1.2} \end{equation}\]
\[\begin{equation} H(R)= -\sum_{r\in R}^{}P(r)log_{2}(r) \tag{1.3} \end{equation}\]
In Equation (1.3), P(r) is the probability of a spike count occurring in a pattern across all trials of the stimulus space. While P(r|s) (Equation (1.2)) is the probability of observing a response pattern when a stimulus is presented. These probability estimates are found by measuring the proportion of the observed response patterns of all the response patterns.
1.2.3 SPIKE Distance and Fano Factor
Synchrony was measured using the SPIKE distance (Kreuz et al. 2013). This metric finds the dissimilarity between two time series of event occurrences. In this analysis of spike train synchrony, the measure of the interspike interval (ISI) distance is used. ISI distance uses the relative differences of the instantaneous rates of two spike trains to compute a parameter-free, time-resolved measure for spike train synchrony. Kreuz’s Matlab code also applies the metric across multiple time series, which we use in our repeated trials. This method allows us to report the spike train synchrony of every RGC in our study.
Fano factor is a fundamental concept in neuroscience that measures spike count variation. It is the variance to mean ratio in the quantity of spikes. We apply the fano factor to all pairs of repeats for each cell and then report the average fano factor in each cell.
1.3 Results
1.3.1 Mesopic Vision Worsens with Degeneration
After recording neural responses across 20 retinas, we analyzed the spike trains from a few recordings to stimulate mesopic vision. Mesopic vision stimulates both the rod and cone pathways in the retina. As shown in Figure 1A-B, we found that more informative RGCs of a control retina exhibited higher spike rate and high consistency across repeated trials. While the most informative neurons in a CNG retina, the mice with RP, also exhibited increased spike rate but less consistent firing. Thus, the information rate metric appears to provide contributions from both the quantity of spikes and the spike train consistency.
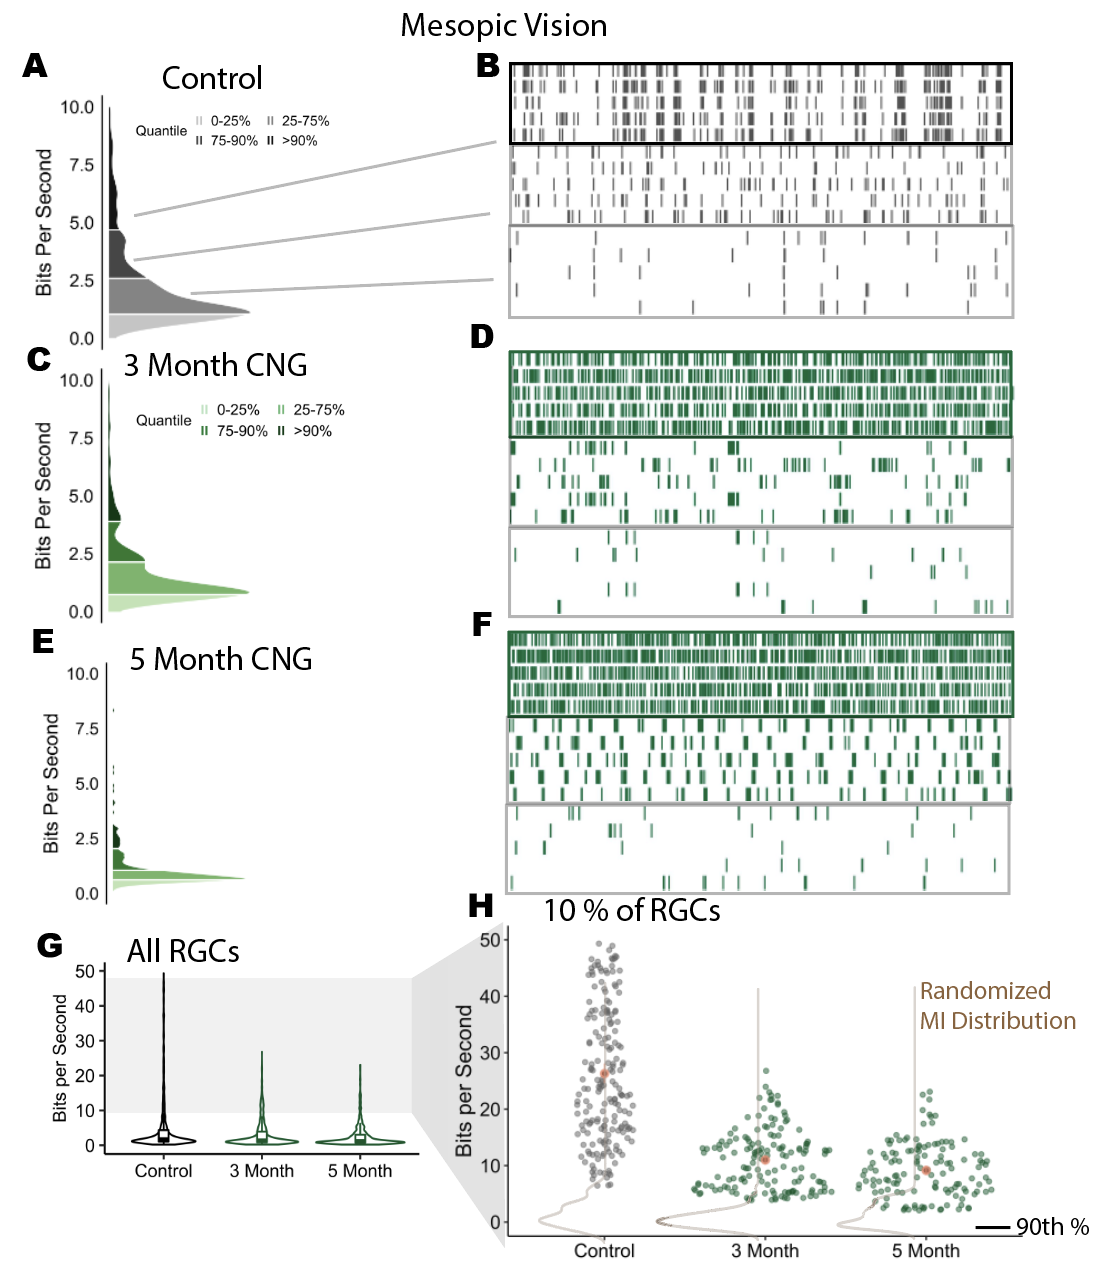
Figure 1.3: (A)Information rate distribution from cells sampled from one retina (N = ). (B)Spike times of 5 repeated trials of a b/w checkerboard stimulus at mesopic vision. Cells come from separate percentiles of the MI distribution (C-F) CNG distributions and spike trains. (3 Month and 5 Month groups have N = , N = , respectively) (G)Information rate distributions from multiple recordings. Each group contains data from three biological replicates. (H) Information rate of cells at or above the 90th percentile in each recording. Brown contours indicate information rate distributions after randomly shifting every trial.
After multiple recordings of neural responses to a mesopic checkerboard stimulus, the most informative RGCs decline in mutual information with retinal damage. In Figure 1G, the information rate distribution in the most informative RGCs declines between the control and RP groups. The cells near the median however do not exhibit changes in their information rates. By focusing on the 10% of the most informative RGCs (Fig. 1H), it is apparent there is a decline in the mean information rate by nearly 20 bits per second. This distributions skews right in RP retinas, while RGCs in control mice have information rates spread uniformly. This distributional change at the upper end fits with consistency trends in the previously sampled cells. These cells had contained the greatest degree of consistency and greatest spike rate, so they have more room to decline in coding performance.
Information encoding in the retina relies on consistent spike trains regardless of retinal degeneration. When RGC spike trains were randomly shifted, the rate at which neurons sent information about the stimulus drop to the same level in RP and control groups (Fig. 1H). The act of shifting spike trains from repeated trials removes spike timing consistencies. As a consequence, without consistent spike timing, the performance of the combined rod and cone pathway is no different between the retinas from control and RP groups.Moreover, the encoding performance of the retina declines in RP.
1.3.2 Cone Vision is Maintained with Degeneration
We then analyzed cone vision in the retina with photopic stimuli (daylight level) using a checkerboard stimulus. In these 3 recordings (Fig 1A - 1F), cells with the greatest information rates again fired at higher rates. However, the cells that fired frequently also had maintained spike timing consistency across repeated trials of stimuli. This difference shows that the retina has maintained its coding performance in its cone pathway even with retinal damage.
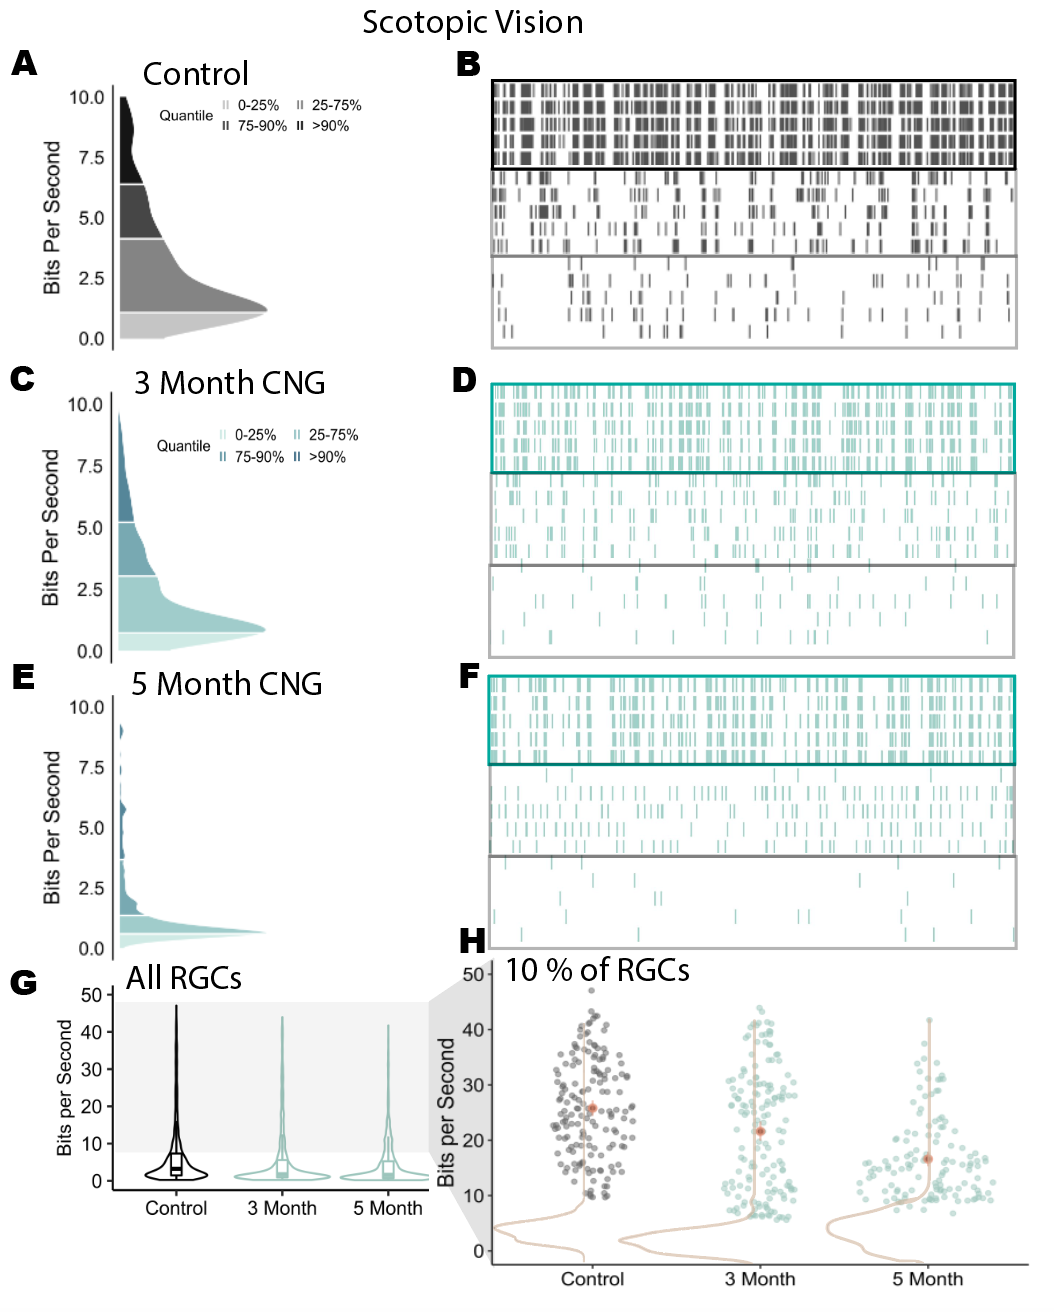
Figure 1.4: (A)Information rate distribution from cells sampled from one retina (N = ). (B)Spike times of 5 repeated trials of a b/w checkerboard stimulus at mesopic vision. Cells come from separate percentiles of the MI distribution (C-F) CNG distributions and spike trains. (3 Month and 5 Month groups have N = , N = , respectively) (G)Information rate distributions from multiple recordings. Each group contains data from three biological replicates. (H) Information rate of cells at or above the 90th percentile in each recording. Brown contours indicate information rate distributions after randomly shifting every trial.
After additional experiments with biological replicates, it became clear that the most informative cells decline in information rates at a later degeneration state. In Figure 1G, like the mesopic-light level recordings, the recorded retinas do not have changes at the median information rates with daylight level stimulus. However, the upper tail of the MI distributions changes (Fig. 1H). The distribution skews right in neurons from the 5 month recordings, but not from the 3 month RP group. Thus, the cone mediated pathway in the retina gets altered at a later stage in RP.
1.3.3 Nature Induces More Informative Responses
For further confirmation, it was necessary to verify the presence of these coding changes more quantitatively. We conducted additional experiments at additional time points of degeneration. In these experiments, we also recorded neural responses from two additional stimuli that contained naturalistic features (Fig. 3A).
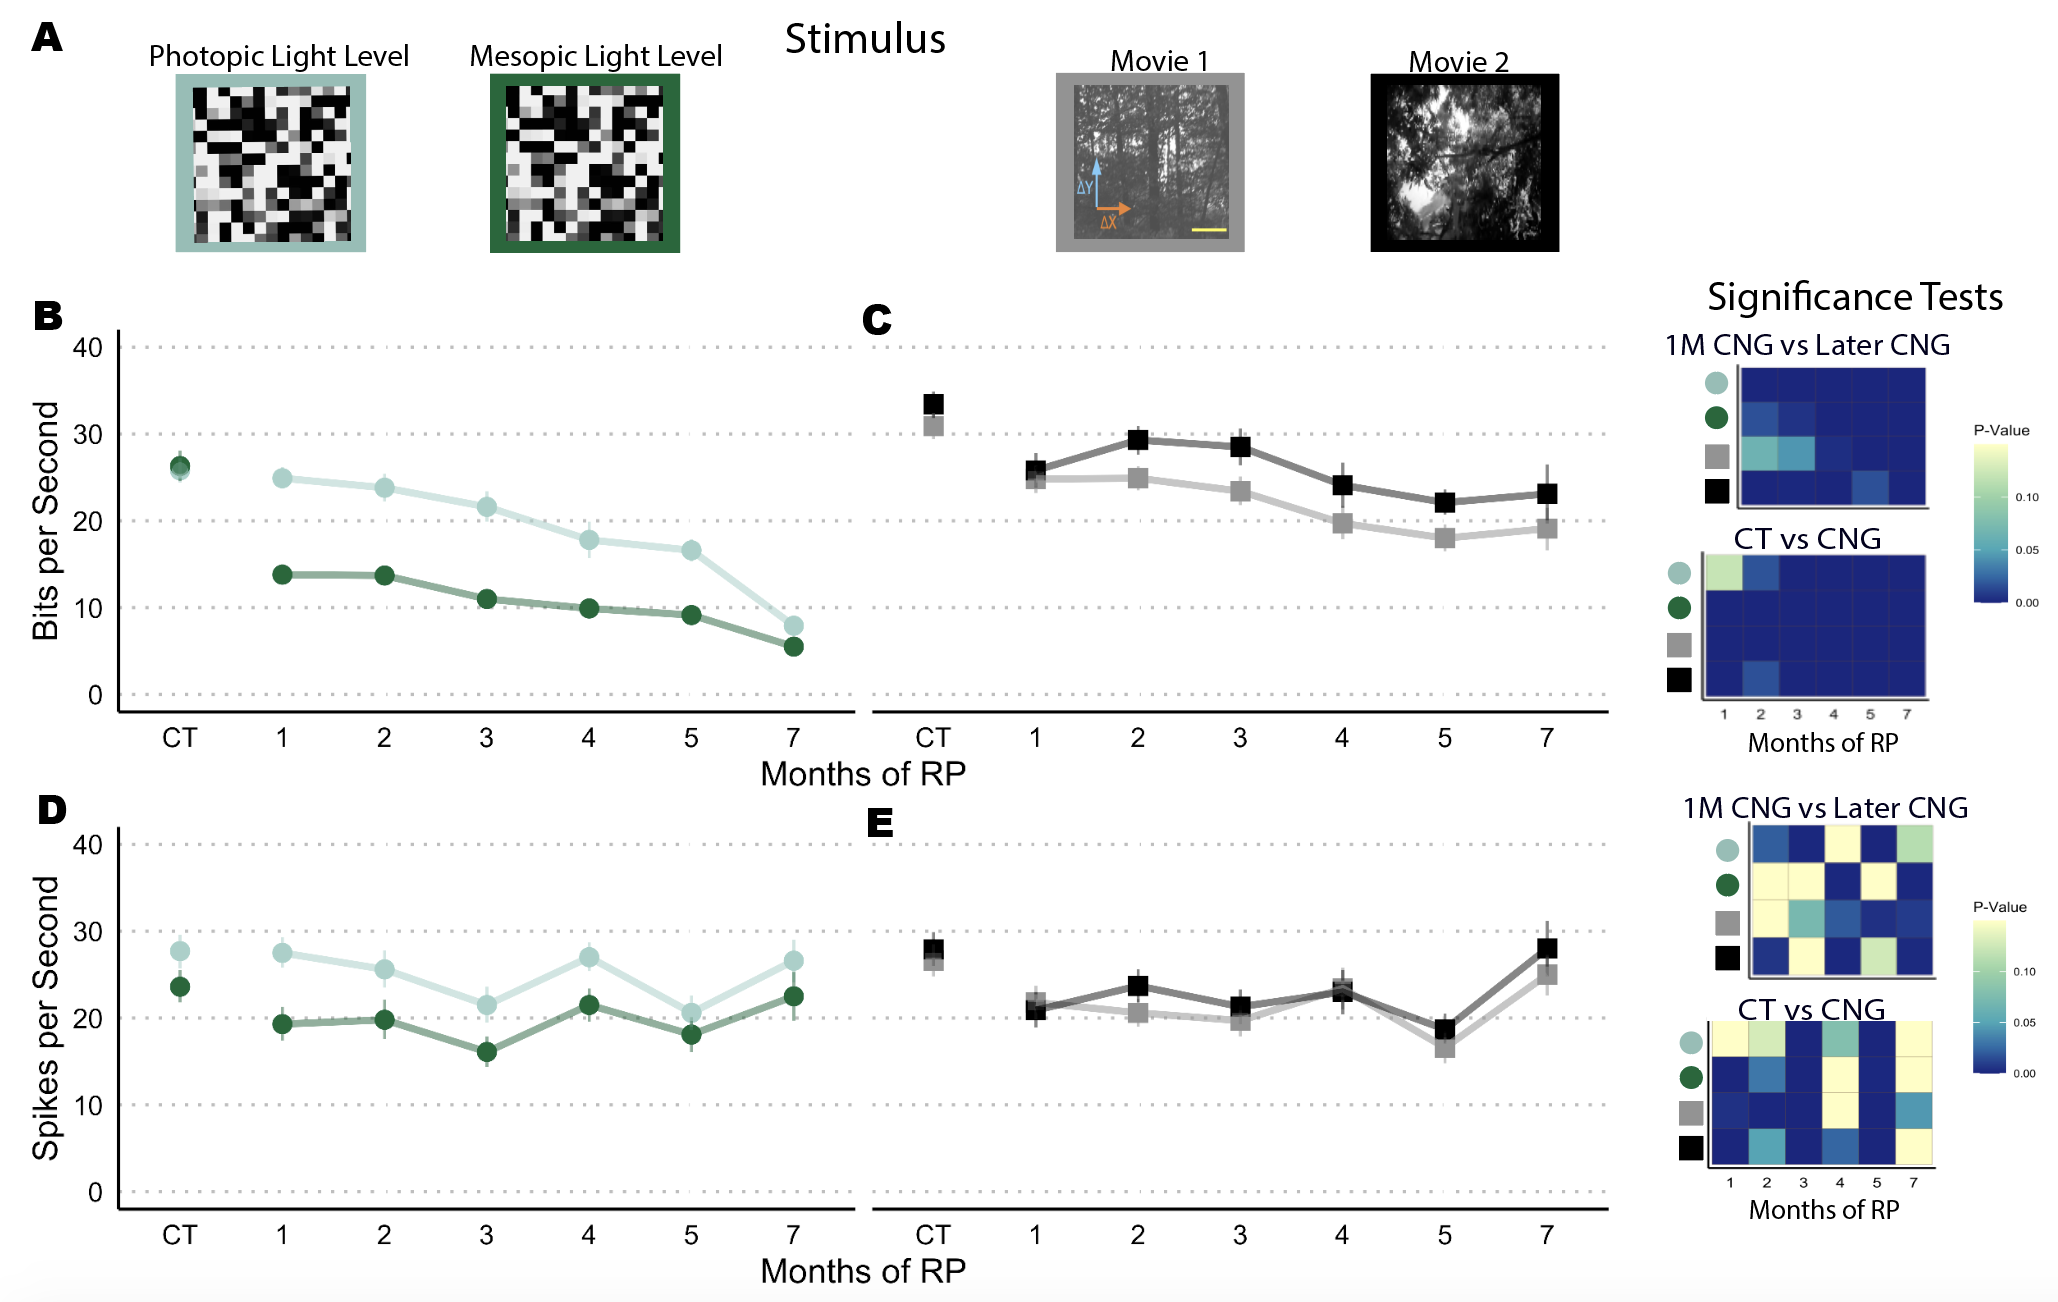
Figure 1.5: (A) Images of 4 unique stimuli we recorded responses from. Outline color indicate the dat plotted below.(B-C) Mean and 95 percentile confidence interval of the information rates in subsampled cells (>90th percentile MI), N = 3 recordings in each group. Heat maps indicate significance tests from two-way Kilmogrov-Smirnov distribution test. (D-E) Spike rates from subsampled cells (>90th percentile MI). Adjacent heatmaps illustrate results from two-way K-S tests.
In the 10% most informative cells, neuronal information rates from checkerboard stimuli show a consistent decline with greater degeneration. Again, changes to the MI distribution occurred early when both rod and cone light receptors were utilized (Fig 3B). However, when cone-specific pathways are used in transmitting light (photopic light level), the decline in the information rate is more gradual. Thus, cone vision declines gradually while the combination of rod and cone vision has a more immediate effect to retinal damage. At 7 months of degeneration, information rates are similar between the responses of the two different stimuli. This observation can be explained by the loss of all rods photoreceptors at that stage of degeneration (Biel and Michalakis 2007). In consequence, both stimuli induce mainly cone mediated responses at this degree of retinal damage.
Degeneration affected responses to natural motion movies to a lesser degree For all mouse groups, the mean information rate was higher in the naturalistic movie responses than those from the checkerboard responses. Nevertheless, degeneration did affect the information rates but by a smaller change. After 4 months of degeneration, the information rate distributions from RGCs does not decline further and stays near a mean of 20 bits per second.
Figure 1D and 1E illustrate one important point. While information rates declined overall, spike rates do not consistently decline with greater degeneration. Samples from the control and 7 month period had similar distributions while some intermediate groups had lower spike rates. Furthermore, spike rates between the two naturalistic stimuli and the checkerboard stimuli were generally similar. These trends show that greater degeneration affects the information mainly through spike timing instead of producing lower spike rate. Of course, these overall does not directly show that spike timing precision is affected. Thus, we confirmed this observation through spike timing and spike count consistency metrics (see Supplemental Fig. 3.1-3.2).
1.4 Discussion
In all, we show that cone vision is maintained with greater retinal degeneration and to a greater degree in response to naturalistic visual stimuli. This good performance is especially striking in contrast to interruptions to mesopic vision. We emphasize below that this conclusion leads to more optimism about vision restoration for RP patients and better understanding of this disease.
1.4.1 Potential for Useful Vision Restoration
We now have increased optimism for RP therapies and believe compensation occurs at the cone pathway. With respect to anatomy, RP eventually shifts synapses from interneurons cells connected to rods to meet with cones instead (Pfeiffer et al. 2020). This morphological change may be the source of compensation that occur at the interneuron-cone synapses during RP (Care et al. 2020). Moreover, this compensation likely led to the improved photopic vision in our results. Thus for patients with RP, Genetic and Optogenetic therapies would only need to recover rod pathway function. Lastly, prosthetic treatments would have to stimulate rod output in its various approaches.
One issue in some RP therapies is the need to recover the interneuron-rod connection. Since morphological and physiological compensation occur at the cone-interneuron level, recovering solely the rods will not suffice. The rod connections to their interneurons will need to be recovered. Genetic treatments in this vein will be addressed in Section 0.2. Some prosthetic treatments try to overcome this issue by entirely avoiding the outer segment and directly stimulating the RGCs.
1.4.2 Naturalistic Stimuli
There are two reasons why natural stimuli induced more informative spikes: the stimulus and the retina. First, the retina may have coding mechanisms that better process natural movies instead of black and white squares. These trends may have developed as an outcome of evolution that preferred to code natural scenes instead of random blocks. To add, this preference is also metabolically efficient because no animal in nature should need to spend energy visually encoding black squares.
Second, the differences between the natural scene and the checkerboard movies could have caused the observed encoding differences. Natural scenes often have features within the same spatial area, so there are usually fewer differences in one movie frame to the next. On the other hand, since a checkerboard stimulus changes every square at a random rate, larger difference in stimulus features are more likely. This difference in features creates more ease when encoding natural scenes, producing more informative messages. This result is interesting in its own right and is reasonable in the context of retina’s biology and the features from each stimulus.
1.4.3 Limitations and Future Directions
With real data, it is not possible to determine the true values of information rate. Nevertheless, this method has performed well in past studies (Strong et al. 1998) in comparison to simulated physiological data. In addition, our experiments with longer repeat lengths (20 seconds) did not have differences in the information rates. To add, there are newer methods that use non-entropy based methods for calculating mutual information (Zeldenrust et al. (2017)).
A future direction for this project is to evaluate encoding in retinas treated for RP. Researchers could evaluate whether treated retinas could send as much information as healthy retinas. One could also use this as a method for evaluating different treatments and the degree to which they may improve vision. This method would provide “an informative” tool in addition to other functional assays.
References
Bareil, C., C. P. Hamel, V. Delague, B. Arnaud, J. Demaille, and M. Claustres. 2001. “Segregation of a Mutation in Cngb1 Encoding the Beta-Subunit of the Rod cGMP-Gated Channel in a Family with Autosomal Recessive Retinitis Pigmentosa.” Journal Article. Hum Genet 108 (4): 328–34. https://doi.org/10.1007/s004390100496.
Berry, M. J., D. K. Warland, and M. Meister. 1997. “The Structure and Precision of Retinal Spike Trains.” Journal Article. Proc Natl Acad Sci U S A 94 (10): 5411–6. https://doi.org/10.1073/pnas.94.10.5411.
Biel, M., and S. Michalakis. 2007. “Function and Dysfunction of Cng Channels: Insights from Channelopathies and Mouse Models.” Journal Article. Mol Neurobiol 35 (3): 266–77. https://doi.org/10.1007/s12035-007-0025-y.
Buracas, G. T., A. M. Zador, M. R. DeWeese, and T. D. Albright. 1998. “Efficient Discrimination of Temporal Patterns by Motion-Sensitive Neurons in Primate Visual Cortex.” Journal Article. Neuron 20 (5): 959–69. https://doi.org/10.1016/s0896-6273(00)80477-8.
Care, R. A., I. A. Anastassov, D. B. Kastner, Y. M. Kuo, L. Della Santina, and F. A. Dunn. 2020. “Mature Retina Compensates Functionally for Partial Loss of Rod Photoreceptors.” Journal Article. Cell Rep 31 (10): 107730. https://doi.org/10.1016/j.celrep.2020.107730.
Huttl, S., S. Michalakis, M. Seeliger, D. G. Luo, N. Acar, H. Geiger, K. Hudl, et al. 2005. “Impaired Channel Targeting and Retinal Degeneration in Mice Lacking the Cyclic Nucleotide-Gated Channel Subunit Cngb1.” Journal Article. J Neurosci 25 (1): 130–8. https://doi.org/10.1523/JNEUROSCI.3764-04.2005.
Ince, R. A., R. Senatore, E. Arabzadeh, F. Montani, M. E. Diamond, and S. Panzeri. 2010. “Information-Theoretic Methods for Studying Population Codes.” Journal Article. Neural Netw 23 (6): 713–27. https://doi.org/10.1016/j.neunet.2010.05.008.
Jepson, L. H., P. Hottowy, G. A. Weiner, W. Dabrowski, A. M. Litke, and E. J. Chichilnisky. 2014. “High-Fidelity Reproduction of Spatiotemporal Visual Signals for Retinal Prosthesis.” Journal Article. Neuron 83 (1): 87–92. https://doi.org/10.1016/j.neuron.2014.04.044.
Kara, P., P. Reinagel, and R. C. Reid. 2000. “Low Response Variability in Simultaneously Recorded Retinal, Thalamic, and Cortical Neurons.” Journal Article. Neuron 27 (3): 635–46. https://doi.org/10.1016/s0896-6273(00)00072-6.
Koch, K., J. McLean, M. Berry, P. Sterling, V. Balasubramanian, and M. A. Freed. 2004. “Efficiency of Information Transmission by Retinal Ganglion Cells.” Journal Article. Curr Biol 14 (17): 1523–30. https://doi.org/10.1016/j.cub.2004.08.060.
Kreuz, T., D. Chicharro, C. Houghton, R. G. Andrzejak, and F. Mormann. 2013. “Monitoring Spike Train Synchrony.” Journal Article. J Neurophysiol 109 (5): 1457–72. https://doi.org/10.1152/jn.00873.2012.
Lee, S. W., D. K. Eddington, and S. I. Fried. 2013. “Responses to Pulsatile Subretinal Electric Stimulation: Effects of Amplitude and Duration.” Journal Article. J Neurophysiol 109 (7): 1954–68. https://doi.org/10.1152/jn.00293.2012.
Lund, R. D., J. M. Lawrence, M. P. Villegas-Perez, T. M. Litchfield, Y. Sauve, S. J. Whiteley, and P. J. Coffey. 1998. “Retinal Degeneration and Transplantation in the Royal College of Surgeons Rat.” Journal Article. Eye (Lond) 12 ( Pt 3b): 597–604. https://doi.org/10.1038/eye.1998.150.
Ma, Shang -keng. 1981. “Calculation of Entropy from Data of Motion.” Journal Article. Journal of Statistical Physics 26: 221–40. https://doi.org/https://doi.org/10.1007/BF01013169.
Marc, R. E., and B. W. Jones. 2003. “Retinal Remodeling in Inherited Photoreceptor Degenerations.” Journal Article. Mol Neurobiol 28 (2): 139–47. https://doi.org/10.1385/MN:28:2:139.
Meister, M., and 2nd Berry M. J. 1999. “The Neural Code of the Retina.” Journal Article. Neuron 22 (3): 435–50. https://doi.org/10.1016/s0896-6273(00)80700-x.
Pfeiffer, R. L., J. R. Anderson, J. Dahal, J. C. Garcia, J. H. Yang, C. L. Sigulinsky, K. Rapp, et al. 2020. “A Pathoconnectome of Early Neurodegeneration: Network Changes in Retinal Degeneration.” Journal Article. Exp Eye Res 199: 108196. https://doi.org/10.1016/j.exer.2020.108196.
Pu, M., L. Xu, and H. Zhang. 2006. “Visual Response Properties of Retinal Ganglion Cells in the Royal College of Surgeons Dystrophic Rat.” Journal Article. Invest Ophthalmol Vis Sci 47 (8): 3579–85. https://doi.org/10.1167/iovs.05-1450.
Puthussery, T., J. Gayet-Primo, S. Pandey, R. M. Duvoisin, and W. R. Taylor. 2009. “Differential Loss and Preservation of Glutamate Receptor Function in Bipolar Cells in the Rd10 Mouse Model of Retinitis Pigmentosa.” Journal Article. Eur J Neurosci 29 (8): 1533–42. https://doi.org/10.1111/j.1460-9568.2009.06728.x.
Quian Quiroga, R., and S. Panzeri. 2009. “Extracting Information from Neuronal Populations: Information Theory and Decoding Approaches.” Journal Article. Nat Rev Neurosci 10 (3): 173–85. https://doi.org/10.1038/nrn2578.
Reich, D. S., J. D. Victor, B. W. Knight, T. Ozaki, and E. Kaplan. 1997. “Response Variability and Timing Precision of Neuronal Spike Trains in Vivo.” Journal Article. J Neurophysiol 77 (5): 2836–41. https://doi.org/10.1152/jn.1997.77.5.2836.
Rizzo, 3rd, J. F., J. Wyatt, J. Loewenstein, S. Kelly, and D. Shire. 2003. “Perceptual Efficacy of Electrical Stimulation of Human Retina with a Microelectrode Array During Short-Term Surgical Trials.” Journal Article. Invest Ophthalmol Vis Sci 44 (12): 5362–9. https://doi.org/10.1167/iovs.02-0817.
Ruyter van Steveninck, R. R. de, G. D. Lewen, S. P. Strong, R. Koberle, and W. Bialek. 1997. “Reproducibility and Variability in Neural Spike Trains.” Journal Article. Science 275 (5307): 1805–8. https://doi.org/10.1126/science.275.5307.1805.
Sauve, Y., S. V. Girman, S. Wang, J. M. Lawrence, and R. D. Lund. 2001. “Progressive Visual Sensitivity Loss in the Royal College of Surgeons Rat: Perimetric Study in the Superior Colliculus.” Journal Article. Neuroscience 103 (1): 51–63. https://doi.org/10.1016/s0306-4522(00)00557-1.
Sekirnjak, C., L. H. Jepson, P. Hottowy, A. Sher, W. Dabrowski, A. M. Litke, and E. J. Chichilnisky. 2011. “Changes in Physiological Properties of Rat Ganglion Cells During Retinal Degeneration.” Journal Article. J Neurophysiol 105 (5): 2560–71. https://doi.org/10.1152/jn.01061.2010.
Shannon, J. A. 1948. “Recent Advances in Treatment of Malaria.” Journal Article. Postgrad Med 3 (3): 171–8. https://doi.org/10.1080/00325481.1948.11692968.
Stasheff, S. F. 2008. “Emergence of Sustained Spontaneous Hyperactivity and Temporary Preservation of Off Responses in Ganglion Cells of the Retinal Degeneration (Rd1) Mouse.” Journal Article. J Neurophysiol 99 (3): 1408–21. https://doi.org/10.1152/jn.00144.2007.
Stasheff, S. F., M. Shankar, and M. P. Andrews. 2011. “Developmental Time Course Distinguishes Changes in Spontaneous and Light-Evoked Retinal Ganglion Cell Activity in Rd1 and Rd10 Mice.” Journal Article. J Neurophysiol 105 (6): 3002–9. https://doi.org/10.1152/jn.00704.2010.
Strong, S. P., R. R. de Ruyter van Steveninck, W. Bialek, and R. Koberle. 1998. “On the Application of Information Theory to Neural Spike Trains.” Journal Article. Pac Symp Biocomput, 621–32. https://www.ncbi.nlm.nih.gov/pubmed/9697217.
Stutzki, Henrike, Florian Helmhold, Max Eickenscheidt, and Günther Zeck. 2016. “Subretinal Electrical Stimulation Reveals Intact Network Activity in the Blind Mouse Retina.” Journal Article. Journal of Neurophysiology 116 (4): 1684–93. https://doi.org/10.1152/jn.01095.2015.
Uzzell, V. J., and E. J. Chichilnisky. 2004. “Precision of Spike Trains in Primate Retinal Ganglion Cells.” Journal Article. J Neurophysiol 92 (2): 780–9. https://doi.org/10.1152/jn.01171.2003.
Yoon, Y. J., J. I. Lee, Y. J. Jang, S. An, J. H. Kim, S. I. Fried, and M. Im. 2020. “Retinal Degeneration Reduces Consistency of Network-Mediated Responses Arising in Ganglion Cells to Electric Stimulation.” Journal Article. IEEE Trans Neural Syst Rehabil Eng 28 (9): 1921–30. https://doi.org/10.1109/TNSRE.2020.3003345.
Yu, W. Q., N. M. Grzywacz, E. J. Lee, and G. D. Field. 2017. “Cell Type-Specific Changes in Retinal Ganglion Cell Function Induced by Rod Death and Cone Reorganization in Rats.” Journal Article. J Neurophysiol 118 (1): 434–54. https://doi.org/10.1152/jn.00826.2016.
Zeldenrust, Fleur, Sicco de Knecht, Wytse J. Wadman, Sophie Denève, and Boris Gutkin. 2017. “Estimating the Information Extracted by a Single Spiking Neuron from a Continuous Input Time Series.” Frontiers in Computational Neuroscience 11: 49. https://doi.org/10.3389/fncom.2017.00049.