Chapter 3 Player Analysis
3.1 Dataset
The data aggregated is scraped from the OUA website. Every box score per game per season is collected and aggregated so that there are player statistics for every season from 2014-15 to 2018-19 (this is because the Player Statistics came from the OUA website which has 2014-15 data).
3.2 The Goal
The goal is to use player statistics to gather insights on how players contribute to the game and how to categorize players using unsupervised learning.
3.3 Data Preparation
The data is a subset of the player data with certain filters on the number of games played and the minutes per game. There are dataframes for every season from 2014-15 to 2018-19 with players that have played at least 15 games of at least 20 minutes per game. The games are regular season games from the U Sports division, Ontario University Athletics conference. All the variables are totals for the season except for PPG (Points per game) and MPG (Minutes per game)
3.4 K-Means Clustering
First the data will be normalized in order to prepare the data for k-means clustering. This is helpful because some statistics have very different ranges e.g. the number of points compared to the number of steals. Therefore the variables will be comparable.
K-Means Clustering is a popular unsupervised machine learning algorithm. The goal of K-Means is to group similar data points in a dataset of unlabeled data. It does this by dividing the data into k clusters where each observation belongs to the cluster closest to the mean (cluster centroid) by using a distance metric (most usually Euclidean distance).
Since K-Means clustering is an unsupervised algorithm, this means that the number of clusters is not known. However, there are techniques that can be used to find an optimal number of clusters such as the gap method, silhouette method, within-cluster sum of squares method, D - index, etc. Different techniques and configurations of the techniques will be used for each season’s clustering for finding the optimal number of clusters.
3.4.1 K-Means Results
The technique that will be used to find the optimal number of clusters for the 2014-2015 season is the D-index method (Lebart et al. 2000). The D-index is based on clustering gain on intra-cluster inertia [8]. Intra-cluster inertia can be defined as:
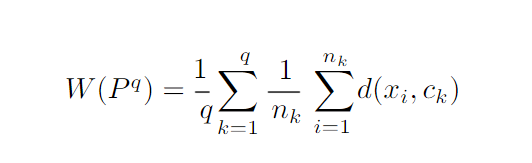
Figure 3.1: Intra-cluster Inertia formula.
The clustering gain should be minimized. The optimal cluster configuration can be identified by the sharp knee that corresponds to a significant decrease of the first differences of clustering gain versus the number of clusters. This knee or great jump of gain values can be identified by a significant peak in second differences of clustering gain.
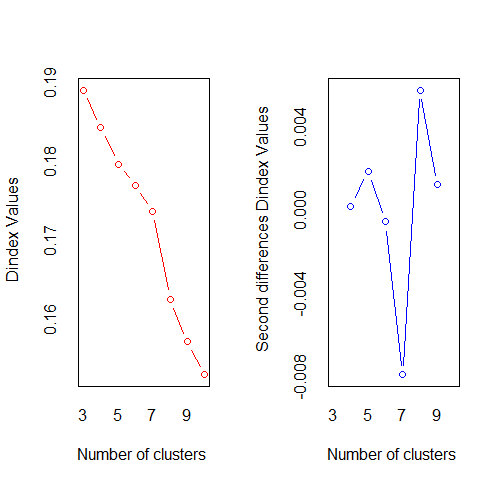
Figure 3.2: Finding the Optimal Cluster using D-index for the 2014-15 season.
In the plot of D-index, we seek a significant knee (the significant peak in D-index second differences plot) around 8, that corresponds to a significant increase of the value of measure. The number of clusters that the method suggests is 8 clusters.
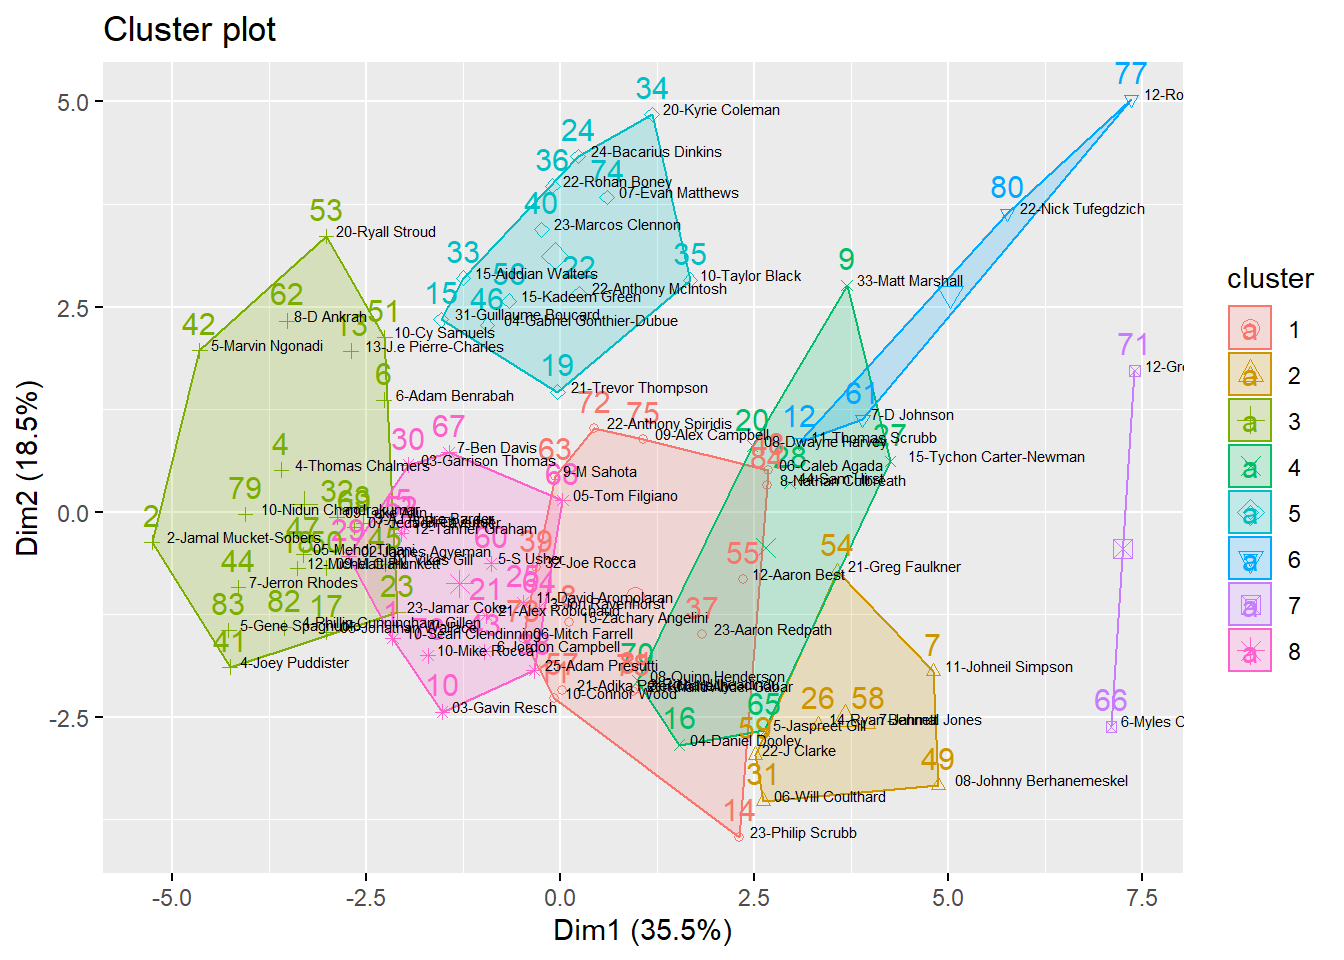
Figure 3.3: Cluster Plot for 2014-15 Season. The axes are the Principal Components where Dim1 is the first PC and Dim2 is the second PC. The first PC explains 35.5% of the data and the second PC explains 18.5%.
| Cluster 1 | Cluster 2 | Cluster 3 | Cluster 4 | Cluster 5 | Cluster 6 | Cluster 7 | Cluster 8 | |
|---|---|---|---|---|---|---|---|---|
| 3PointMade | 31.47 | 40.14 | 12.77 | 19.57 | 2.25 | 17.25 | 23.50 | 19.47 |
| 3PointAttempted | 81.40 | 112.57 | 37.86 | 64.29 | 8.92 | 46.75 | 74.00 | 56.47 |
| Assists | 38.07 | 56.14 | 22.50 | 47.71 | 22.17 | 36.50 | 59.00 | 35.20 |
| Blocks | 4.33 | 6.29 | 3.64 | 5.86 | 15.25 | 21.25 | 4.50 | 4.13 |
| DefensiveRebounds | 59.60 | 64.86 | 44.18 | 81.86 | 79.83 | 128.75 | 94.00 | 58.00 |
| FieldGoalMade | 84.87 | 118.43 | 42.91 | 87.29 | 78.50 | 132.50 | 149.00 | 50.53 |
| FieldGoalAttempted | 194.00 | 278.14 | 104.55 | 209.29 | 157.50 | 264.75 | 304.50 | 135.27 |
| FreeThrowsMade | 44.80 | 58.57 | 20.86 | 55.71 | 40.50 | 64.25 | 99.50 | 29.40 |
| FreeThrowsAttempted | 59.87 | 73.57 | 32.59 | 75.00 | 62.83 | 94.75 | 137.50 | 40.67 |
| Minutes | 502.93 | 579.86 | 387.45 | 619.14 | 450.75 | 547.25 | 694.00 | 500.93 |
| OffensiveRebounds | 25.67 | 16.86 | 19.00 | 25.86 | 44.50 | 52.50 | 26.50 | 16.67 |
| PersonalFouls | 39.40 | 35.43 | 39.50 | 50.71 | 46.17 | 33.50 | 44.50 | 44.93 |
| Points | 246.00 | 335.57 | 119.45 | 249.86 | 199.75 | 346.50 | 421.00 | 149.93 |
| Rebounds | 85.27 | 81.71 | 63.18 | 107.71 | 124.33 | 181.25 | 120.50 | 74.67 |
| Steals | 19.60 | 21.86 | 13.00 | 23.57 | 12.50 | 16.75 | 27.50 | 20.53 |
| Turnovers | 34.47 | 40.14 | 28.55 | 48.43 | 30.50 | 47.25 | 57.00 | 34.27 |
| Home | 9.53 | 9.00 | 9.27 | 9.14 | 9.50 | 9.50 | 10.50 | 9.47 |
| GamesPlayed | 18.73 | 18.29 | 18.00 | 19.00 | 18.92 | 18.75 | 20.00 | 18.93 |
| PointsPerGame | 13.15 | 18.39 | 6.64 | 13.19 | 10.59 | 18.47 | 21.05 | 7.95 |
| MinutesPerGame | 26.85 | 31.74 | 21.53 | 32.60 | 23.81 | 29.20 | 34.70 | 26.53 |
| 3P% | 0.37 | 0.36 | 0.30 | 0.29 | 0.18 | 0.37 | 0.32 | 0.38 |
| FG% | 0.44 | 0.43 | 0.42 | 0.42 | 0.50 | 0.50 | 0.49 | 0.38 |
| FT% | 0.74 | 0.79 | 0.66 | 0.76 | 0.64 | 0.70 | 0.72 | 0.72 |
| TrueShooting% | 0.56 | 0.54 | 0.50 | 0.52 | 0.54 | 0.56 | 0.57 | 0.49 |
| Player | Team | Cluster |
|---|---|---|
| 15-Zachary Angelini | Brock | 1 |
| 10-Connor Wood | Carleton | 1 |
| 23-Philip Scrubb | Carleton | 1 |
| 23-Aaron Redpath | McMaster | 1 |
| 32-Joe Rocca | McMaster | 1 |
| 06-Caleb Agada | Ottawa | 1 |
| 12-Aaron Best | Ryerson | 1 |
| 21-Adika Peter-McNeilly | Ryerson | 1 |
| 9-M Sahota | Toronto | 1 |
| 22-Anthony Spiridis | Western | 1 |
| 06-Mitch Farrell | Windsor | 1 |
| 09-Alex Campbell | Windsor | 1 |
| 21-Khalid Abdel-Gabar | Windsor | 1 |
| 3-Richard Iheadindu | York | 1 |
| 8-Nathan Culbreath | York | 1 |
| 11-Johneil Simpson | Brock | 2 |
| 14-Ryan Bennett | Laurentian | 2 |
| 06-Will Coulthard | Laurier | 2 |
| 08-Johnny Berhanemeskel | Ottawa | 2 |
| 21-Greg Faulkner | Queen’s | 2 |
| 7-Jahmal Jones | Ryerson | 2 |
| 22-J Clarke | Toronto | 2 |
| 2-Jamal Mucket-Sobers | Algoma | 3 |
| 3-AJ Andre Barder | Algoma | 3 |
| 4-Thomas Chalmers | Algoma | 3 |
| 6-Adam Benrabah | Algoma | 3 |
| 13-J.e Pierre-Charles | Carleton | 3 |
| 05-Jonathan Wallace | Guelph | 3 |
| 12-Michel Clark | Guelph | 3 |
| 23-Jamar Coke | Lakehead | 3 |
| 09-Luke Allin | Laurier | 3 |
| 4-Joey Puddister | Nipissing | 3 |
| 5-Marvin Ngonadi | Nipissing | 3 |
| 7-Jerron Rhodes | Nipissing | 3 |
| 01-Vikas Gill | Ottawa | 3 |
| 05-Mehdi Tihani | Ottawa | 3 |
| 09-Matt Plunkett | Ottawa | 3 |
| 10-Cy Samuels | Queen’s | 3 |
| 20-Ryall Stroud | Queen’s | 3 |
| 8-D Ankrah | Toronto | 3 |
| 07-Jedson Tavernier | Western | 3 |
| 10-Nidun Chandrakumar | York | 3 |
| 4-Phillip Cunningham-Gillen | York | 3 |
| 5-Gene Spagnuolo | York | 3 |
| 33-Matt Marshall | Brock | 4 |
| 04-Daniel Dooley | Guelph | 4 |
| 08-Dwayne Harvey | Lakehead | 4 |
| 15-Tychon Carter-Newman | Laurentian | 4 |
| 44-Sam Hirst | Laurentian | 4 |
| 5-Jaspreet Gill | Waterloo | 4 |
| 08-Quinn Henderson | Western | 4 |
| 31-Guillaume Boucard | Carleton | 5 |
| 21-Trevor Thompson | Guelph | 5 |
| 22-Anthony McIntosh | Lakehead | 5 |
| 24-Bacarius Dinkins | Lakehead | 5 |
| 15-Aiddian Walters | Laurier | 5 |
| 20-Kyrie Coleman | Laurier | 5 |
| 10-Taylor Black | McMaster | 5 |
| 22-Rohan Boney | McMaster | 5 |
| 23-Marcos Clennon | Nipissing | 5 |
| 04-Gabriel Gonthier-Dubue | Ottawa | 5 |
| 15-Kadeem Green | Ryerson | 5 |
| 07-Evan Matthews | Windsor | 5 |
| 11-Thomas Scrubb | Carleton | 6 |
| 7-D Johnson | Toronto | 6 |
| 12-Rotimi Osuntola | Windsor | 6 |
| 22-Nick Tufegdzich | York | 6 |
| 6-Myles Charvis | Waterloo | 7 |
| 12-Greg Morrow | Western | 7 |
| 10-Sean Clendinning | Algoma | 8 |
| 5-Brett Zufelt | Algoma | 8 |
| 03-Gavin Resch | Carleton | 8 |
| 21-Alex Robichaud | Lakehead | 8 |
| 11-David Aromolaran | Laurentian | 8 |
| 02-James Agyeman | Laurier | 8 |
| 03-Garrison Thomas | Laurier | 8 |
| 25-Adam Presutti | McMaster | 8 |
| 6-Jordon Campbell | Nipissing | 8 |
| 12-Tanner Graham | Queen’s | 8 |
| 5-S Usher | Toronto | 8 |
| 3-Jon Ravenhorst | Waterloo | 8 |
| 7-Ben Davis | Waterloo | 8 |
| 05-Tom Filgiano | Western | 8 |
| 10-Mike Rocca | Windsor | 8 |
Each cluster can be categorized as a type of player.
Cluster 1: Efficient Playmakers & Scorers This cluster of players have the most assists and the second most points per game. They have a big defensive impact through the number of steals they get and can control the tempo well and score.
Cluster 2: All-Around Players These players can get rebounds, pass and score well.
Cluster 3: Dominant Big Men These players are the most dominant big men in the league with the most rebounds (defensive and offensive), blocks, and points.
Cluster 4: Smart Catch & Shoot Players These players make the best decisions and turnover the ball the fewest. They do not dribble the ball much and are the most efficient shooters.
Cluster 5: Aggressive Defenders These players are aggressive and foul the most out of all the other clusters. They have a bigger impact on defense since they do not shoot well.
Cluster 6: Role Players These players contribute to many plays and work both offensively and defensively.
Cluster 7: Second Tier Playmakers These players are less dominant playmakers that can still score efficiently.
Cluster 8: Second Tier Small Players These players play small but do not shoot as efficiently as the other players or create as many plays.
3.4.2 2015-16 Season
For this season, the elbow method [9] will be used to find the optimal number of clusters. The elbow method looks at the percentage of variance explained as a function of the number of clusters: One should choose a number of clusters so that adding another cluster does not give much better modeling of the data. More precisely, if one plots the percentage of variance explained by the clusters against the number of clusters, the first clusters will add much information (explain a lot of variance), but at some point the marginal gain will drop, giving an angle in the graph. The number of clusters is chosen at this point, hence the “elbow criterion”. This “elbow” cannot always be unambiguously identified.
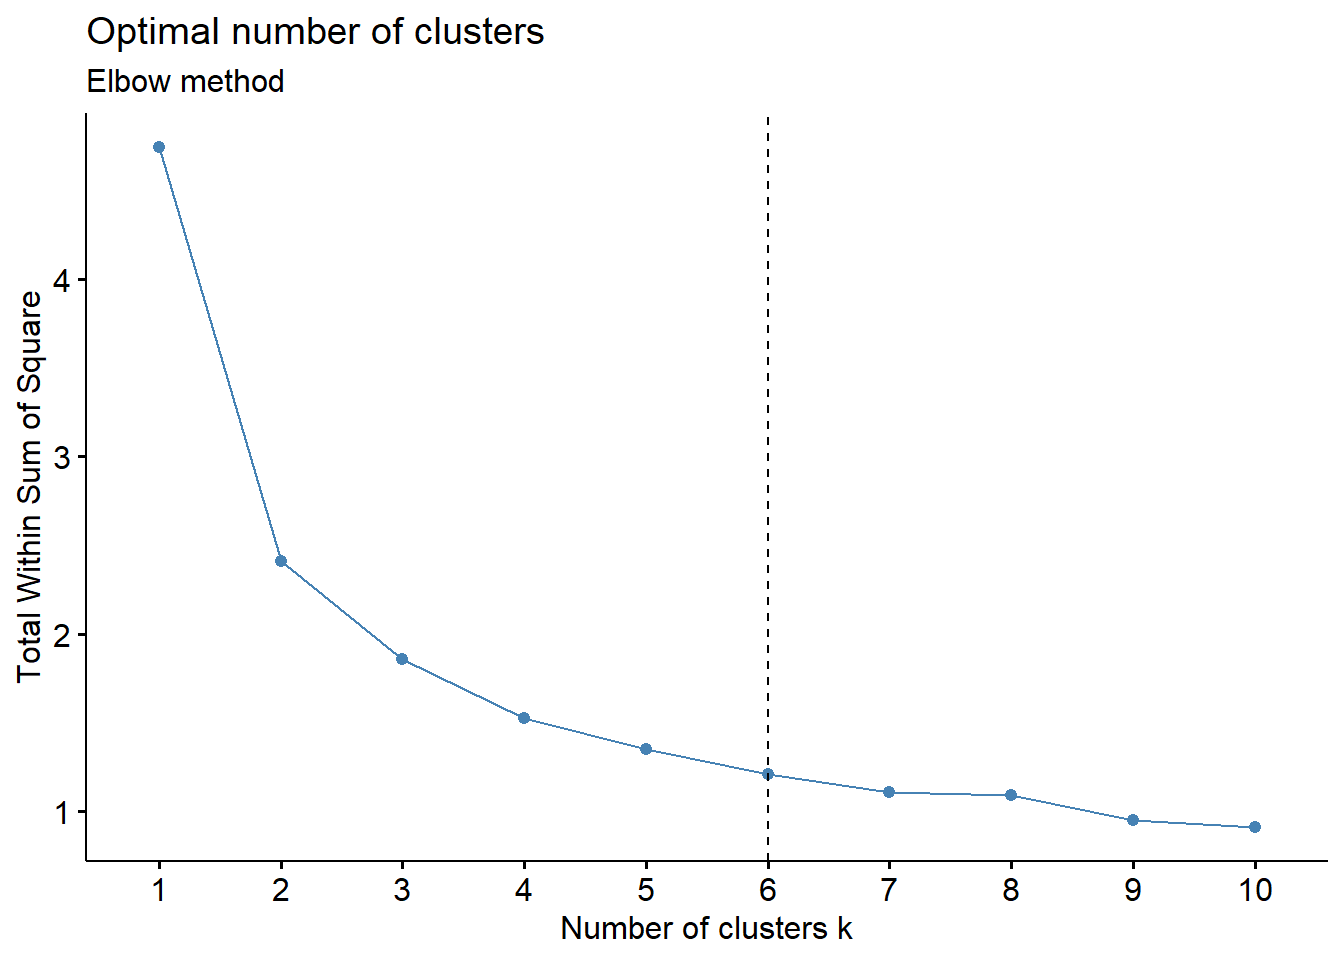
Figure 3.4: Elbow Method for finding the optimal number of clusters for the 2015-16 season
The number of clusters that will be used for this season is 6 for this season. Below are tables to show the average statistics for each cluster and also which players belong to which cluster.
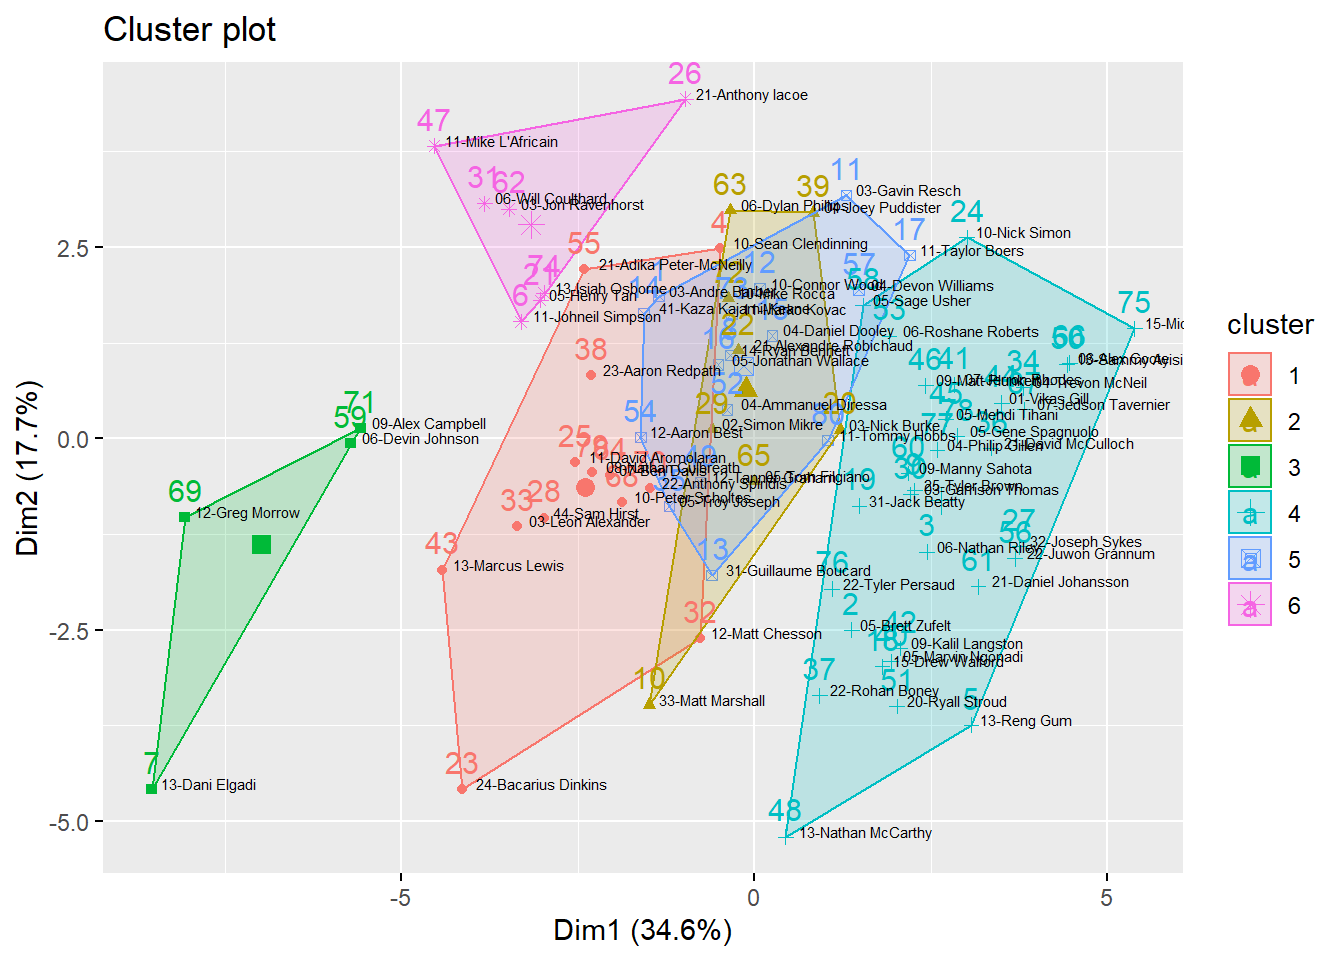
Figure 3.5: Cluster Plot of 2015-16 Season
| Cluster 1 | Cluster 2 | Cluster 3 | Cluster 4 | Cluster 5 | Cluster 6 | |
|---|---|---|---|---|---|---|
| 3PointMade | 14.85 | 22.62 | 18.75 | 13.16 | 31.75 | 44.57 |
| 3PointAttempted | 48.15 | 67.88 | 55.75 | 41.84 | 86.00 | 133.29 |
| Assists | 39.38 | 57.12 | 43.25 | 24.91 | 40.62 | 52.71 |
| Blocks | 7.85 | 4.75 | 13.50 | 7.41 | 6.44 | 3.29 |
| DefensiveRebounds | 72.00 | 72.50 | 111.25 | 51.62 | 63.56 | 68.71 |
| FieldGoalMade | 101.38 | 56.25 | 150.50 | 48.56 | 85.62 | 111.14 |
| FieldGoalAttempted | 236.23 | 150.62 | 317.75 | 119.72 | 196.88 | 290.00 |
| FreeThrowsMade | 59.38 | 28.75 | 99.00 | 23.69 | 32.88 | 55.14 |
| FreeThrowsAttempted | 83.46 | 40.12 | 130.25 | 34.47 | 43.44 | 74.00 |
| Minutes | 564.00 | 620.00 | 631.50 | 419.31 | 490.81 | 639.14 |
| OffensiveRebounds | 30.77 | 25.75 | 44.50 | 21.50 | 18.19 | 14.57 |
| PersonalFouls | 44.92 | 48.88 | 47.25 | 39.56 | 38.44 | 35.57 |
| Points | 277.00 | 163.88 | 418.75 | 133.97 | 235.88 | 322.00 |
| Rebounds | 102.77 | 98.25 | 155.75 | 73.12 | 81.75 | 83.29 |
| Steals | 23.85 | 25.00 | 30.25 | 15.72 | 18.88 | 24.14 |
| Turnovers | 49.46 | 40.50 | 58.00 | 26.00 | 34.50 | 49.57 |
| Home | 9.69 | 9.62 | 9.75 | 9.31 | 9.25 | 9.71 |
| GamesPlayed | 19.08 | 19.38 | 19.00 | 18.38 | 18.25 | 19.43 |
| PointsPerGame | 14.58 | 8.47 | 22.02 | 7.34 | 12.99 | 16.58 |
| MinutesPerGame | 29.60 | 31.98 | 33.18 | 22.87 | 26.96 | 32.90 |
| 3P% | 0.26 | 0.32 | 0.31 | 0.28 | 0.38 | 0.33 |
| FG% | 0.43 | 0.37 | 0.47 | 0.41 | 0.44 | 0.39 |
| FT% | 0.72 | 0.72 | 0.76 | 0.71 | 0.77 | 0.76 |
| TrueShooting% | 0.50 | 0.48 | 0.55 | 0.49 | 0.54 | 0.50 |
| Player | Team | Cluster |
|---|---|---|
| 10-Sean Clendinning | Algoma | 1 |
| 24-Bacarius Dinkins | Lakehead | 1 |
| 11-David Aromolaran | Laurentian | 1 |
| 44-Sam Hirst | Laurentian | 1 |
| 12-Matt Chesson | Laurier | 1 |
| 03-Leon Alexander | McMaster | 1 |
| 23-Aaron Redpath | McMaster | 1 |
| 13-Marcus Lewis | Nipissing | 1 |
| 21-Adika Peter-McNeilly | Ryerson | 1 |
| 07-Ben Davis | Waterloo | 1 |
| 10-Peter Scholtes | Western | 1 |
| 22-Anthony Spiridis | Western | 1 |
| 08-Nathan Culbreath | York | 1 |
| 33-Matt Marshall | Brock | 2 |
| 03-Nick Burke | Lakehead | 2 |
| 21-Alexandre Robichaud | Lakehead | 2 |
| 02-Simon Mikre | Laurier | 2 |
| 04-Joey Puddister | Nipissing | 2 |
| 06-Dylan Phillips | Waterloo | 2 |
| 05-Tom Filgiano | Western | 2 |
| 10-Mike Rocca | Windsor | 2 |
| 13-Dani Elgadi | Brock | 3 |
| 06-Devin Johnson | Toronto | 3 |
| 12-Greg Morrow | Western | 3 |
| 09-Alex Campbell | Windsor | 3 |
| 05-Brett Zufelt | Algoma | 4 |
| 06-Nathan Riley | Algoma | 4 |
| 13-Reng Gum | Algoma | 4 |
| 25-Tyler Brown | Brock | 4 |
| 15-Drew Walford | Guelph | 4 |
| 31-Jack Beatty | Guelph | 4 |
| 10-Nick Simon | Laurentian | 4 |
| 32-Joseph Sykes | Laurentian | 4 |
| 03-Garrison Thomas | Laurier | 4 |
| 04-Trevon McNeil | McMaster | 4 |
| 21-David McCulloch | McMaster | 4 |
| 22-Rohan Boney | McMaster | 4 |
| 05-Marvin Ngonadi | Nipissing | 4 |
| 07-Jerron Rhodes | Nipissing | 4 |
| 09-Kalil Langston | Nipissing | 4 |
| 01-Vikas Gill | Ottawa | 4 |
| 05-Mehdi Tihani | Ottawa | 4 |
| 09-Matt Plunkett | Ottawa | 4 |
| 13-Nathan McCarthy | Ottawa | 4 |
| 13-Sammy Ayisi | Queen’s | 4 |
| 20-Ryall Stroud | Queen’s | 4 |
| 06-Roshane Roberts | Ryerson | 4 |
| 22-Juwon Grannum | Ryerson | 4 |
| 05-Sage Usher | Toronto | 4 |
| 09-Manny Sahota | Toronto | 4 |
| 21-Daniel Johansson | Toronto | 4 |
| 06-Alex Coote | Western | 4 |
| 07-Jedson Tavernier | Western | 4 |
| 15-Micah Kirubel | Windsor | 4 |
| 22-Tyler Persaud | Windsor | 4 |
| 04-Philip Gillen | York | 4 |
| 05-Gene Spagnuolo | York | 4 |
| 03-Andre Barber | Algoma | 5 |
| 14-Ryan Bennett | Brock | 5 |
| 03-Gavin Resch | Carleton | 5 |
| 10-Connor Wood | Carleton | 5 |
| 31-Guillaume Boucard | Carleton | 5 |
| 41-Kaza Kajami-Keane | Carleton | 5 |
| 04-Daniel Dooley | Guelph | 5 |
| 05-Jonathan Wallace | Guelph | 5 |
| 11-Taylor Boers | Guelph | 5 |
| 05-Troy Joseph | McMaster | 5 |
| 12-Tanner Graham | Queen’s | 5 |
| 04-Ammanuel Diressa | Ryerson | 5 |
| 12-Aaron Best | Ryerson | 5 |
| 04-Devon Williams | Toronto | 5 |
| 11-Marko Kovac | Windsor | 5 |
| 11-Tommy Hobbs | York | 5 |
| 11-Johneil Simpson | Brock | 6 |
| 05-Henry Tan | Lakehead | 6 |
| 21-Anthony Iacoe | Laurentian | 6 |
| 06-Will Coulthard | Laurier | 6 |
| 11-Mike L’Africain | Ottawa | 6 |
| 03-Jon Ravenhorst | Waterloo | 6 |
| 13-Isiah Osborne | Windsor | 6 |
3.4.3 2016-17 Season
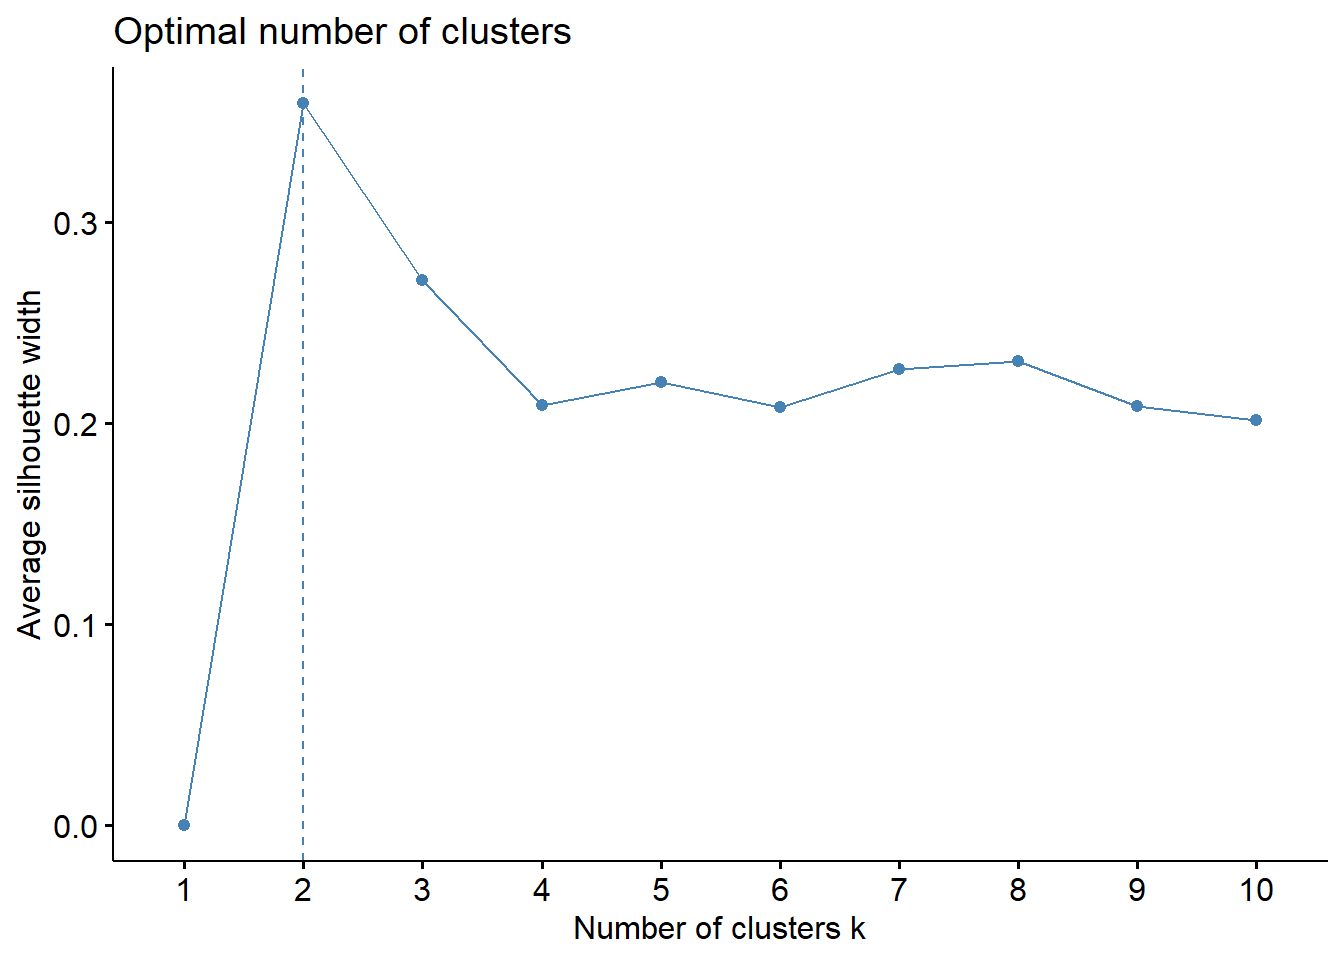
Figure 3.6: Silhouette Method for finding the optimal number of clusters for the 2016-17 season
The Silhouette method suggests 2 as the optimal number of clusters for this season. This is possibly separating the players into forwards/centers and guards. Below are tables to show the average statistics for each cluster and also which players belong to which cluster.
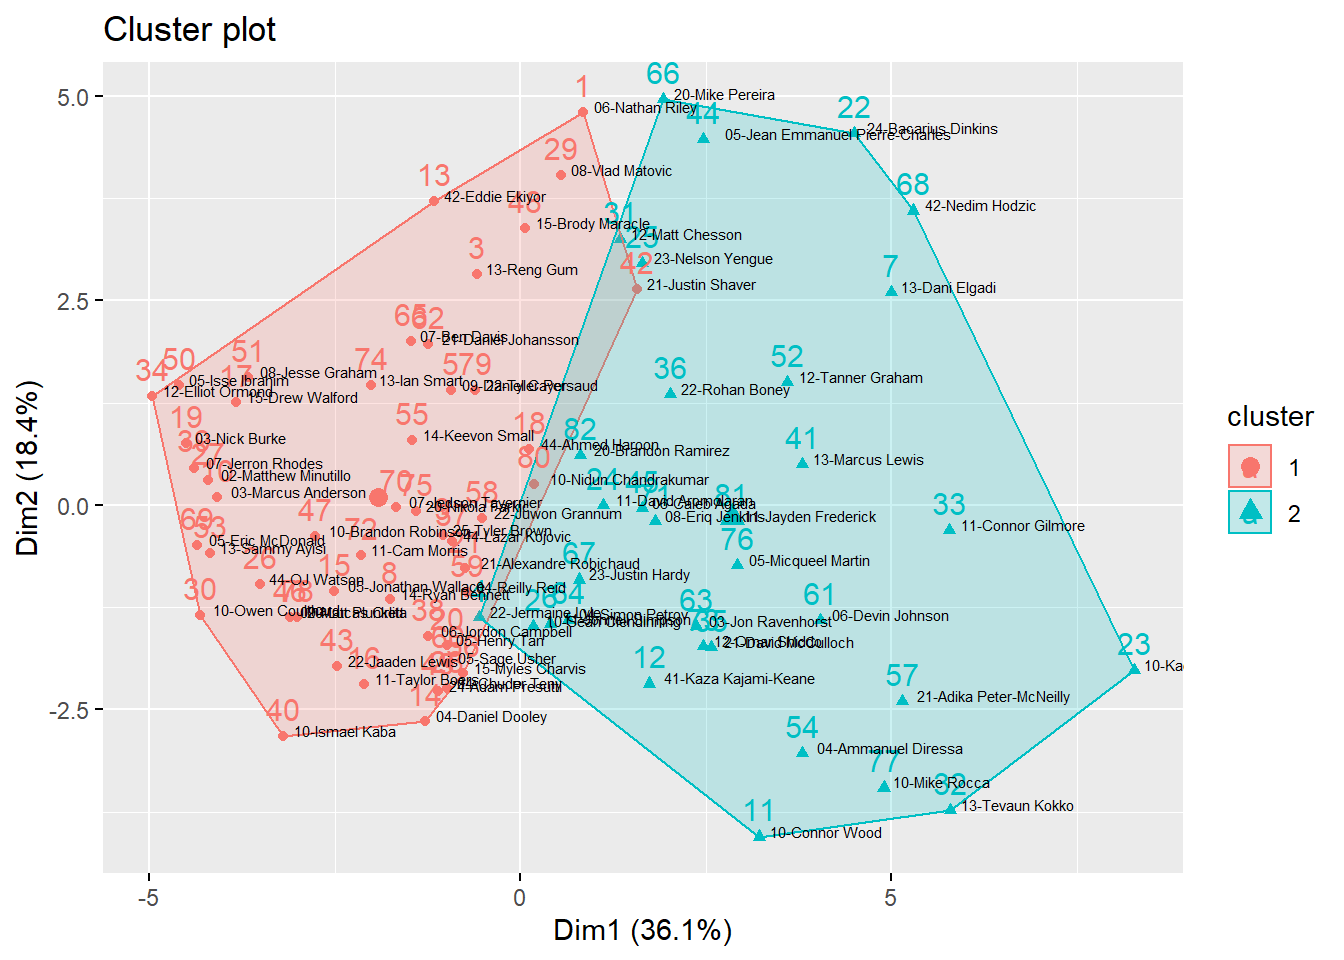
Figure 3.7: Cluster Plot of 2016-17 Season
| Cluster 1 | Cluster 2 | |
|---|---|---|
| 3PointMade | 16.67 | 25.09 |
| 3PointAttempted | 51.80 | 73.85 |
| Assists | 30.02 | 42.82 |
| Blocks | 4.92 | 9.18 |
| DefensiveRebounds | 53.12 | 83.88 |
| FieldGoalMade | 55.86 | 101.97 |
| FieldGoalAttempted | 136.37 | 234.88 |
| FreeThrowsMade | 24.86 | 50.88 |
| FreeThrowsAttempted | 37.14 | 71.27 |
| Minutes | 452.90 | 559.09 |
| OffensiveRebounds | 20.53 | 30.91 |
| PersonalFouls | 35.53 | 44.12 |
| Points | 153.24 | 279.91 |
| Rebounds | 73.65 | 114.79 |
| Steals | 16.88 | 23.67 |
| Turnovers | 28.86 | 47.39 |
| Home | 9.14 | 9.70 |
| GamesPlayed | 18.43 | 19.12 |
| PointsPerGame | 8.34 | 14.70 |
| MinutesPerGame | 24.59 | 29.24 |
| 3P% | 0.28 | 0.30 |
| FG% | 0.41 | 0.44 |
| FT% | 0.68 | 0.71 |
| TrueShooting% | 0.50 | 0.52 |
| Player | Team | Cluster |
|---|---|---|
| 06-Nathan Riley | Algoma | 1 |
| 13-Reng Gum | Algoma | 1 |
| 09-Daniel Cayer | Brock | 1 |
| 14-Ryan Bennett | Brock | 1 |
| 25-Tyler Brown | Brock | 1 |
| 03-Marcus Anderson | Carleton | 1 |
| 42-Eddie Ekiyor | Carleton | 1 |
| 04-Daniel Dooley | Guelph | 1 |
| 05-Jonathan Wallace | Guelph | 1 |
| 11-Taylor Boers | Guelph | 1 |
| 15-Drew Walford | Guelph | 1 |
| 44-Ahmed Haroon | Guelph | 1 |
| 03-Nick Burke | Lakehead | 1 |
| 05-Henry Tan | Lakehead | 1 |
| 21-Alexandre Robichaud | Lakehead | 1 |
| 44-OJ Watson | Laurentian | 1 |
| 02-Matthew Minutillo | Laurier | 1 |
| 04-Chuder Teny | Laurier | 1 |
| 08-Vlad Matovic | Laurier | 1 |
| 10-Owen Coulthard | Laurier | 1 |
| 12-Elliot Ormond | McMaster | 1 |
| 44-Lazar Kojovic | McMaster | 1 |
| 06-Jordon Campbell | Nipissing | 1 |
| 07-Jerron Rhodes | Nipissing | 1 |
| 10-Ismael Kaba | Nipissing | 1 |
| 21-Justin Shaver | Nipissing | 1 |
| 22-Jaaden Lewis | Nipissing | 1 |
| 09-Matt Plunkett | Ottawa | 1 |
| 10-Brandon Robinson | Ottawa | 1 |
| 15-Brody Maracle | Ottawa | 1 |
| 24-Adam Presutti | Ottawa | 1 |
| 05-Isse Ibrahim | Queen’s | 1 |
| 08-Jesse Graham | Queen’s | 1 |
| 13-Sammy Ayisi | Queen’s | 1 |
| 14-Keevon Small | Ryerson | 1 |
| 15-Myles Charvis | Ryerson | 1 |
| 22-Juwon Grannum | Ryerson | 1 |
| 04-Reilly Reid | Toronto | 1 |
| 05-Sage Usher | Toronto | 1 |
| 21-Daniel Johansson | Toronto | 1 |
| 07-Ben Davis | Waterloo | 1 |
| 05-Eric McDonald | Western | 1 |
| 07-Jedson Tavernier | Western | 1 |
| 11-Cam Morris | Western | 1 |
| 13-Ian Smart | Western | 1 |
| 20-Nikola Farkic | Western | 1 |
| 20-Lucas Orlita | Windsor | 1 |
| 22-Tyler Persaud | Windsor | 1 |
| 10-Nidun Chandrakumar | York | 1 |
| 10-Sean Clendinning | Algoma | 2 |
| 22-Jermaine Lyle | Algoma | 2 |
| 11-Johneil Simpson | Brock | 2 |
| 13-Dani Elgadi | Brock | 2 |
| 10-Connor Wood | Carleton | 2 |
| 41-Kaza Kajami-Keane | Carleton | 2 |
| 24-Bacarius Dinkins | Lakehead | 2 |
| 10-Kadre Gray | Laurentian | 2 |
| 11-David Aromolaran | Laurentian | 2 |
| 23-Nelson Yengue | Laurentian | 2 |
| 12-Matt Chesson | Laurier | 2 |
| 13-Tevaun Kokko | Laurier | 2 |
| 11-Connor Gilmore | McMaster | 2 |
| 21-David McCulloch | McMaster | 2 |
| 22-Rohan Boney | McMaster | 2 |
| 13-Marcus Lewis | Nipissing | 2 |
| 05-Jean Emmanuel Pierre-Charles | Ottawa | 2 |
| 06-Caleb Agada | Ottawa | 2 |
| 12-Tanner Graham | Queen’s | 2 |
| 04-Ammanuel Diressa | Ryerson | 2 |
| 21-Adika Peter-McNeilly | Ryerson | 2 |
| 06-Devin Johnson | Toronto | 2 |
| 03-Jon Ravenhorst | Waterloo | 2 |
| 04-Simon Petrov | Waterloo | 2 |
| 20-Mike Pereira | Waterloo | 2 |
| 23-Justin Hardy | Waterloo | 2 |
| 42-Nedim Hodzic | Waterloo | 2 |
| 08-Eriq Jenkins | Western | 2 |
| 12-Omar Shiddo | Western | 2 |
| 05-Micqueel Martin | Windsor | 2 |
| 10-Mike Rocca | Windsor | 2 |
| 11-Jayden Frederick | York | 2 |
| 20-Brandon Ramirez | York | 2 |
3.4.4 2017-18 Season
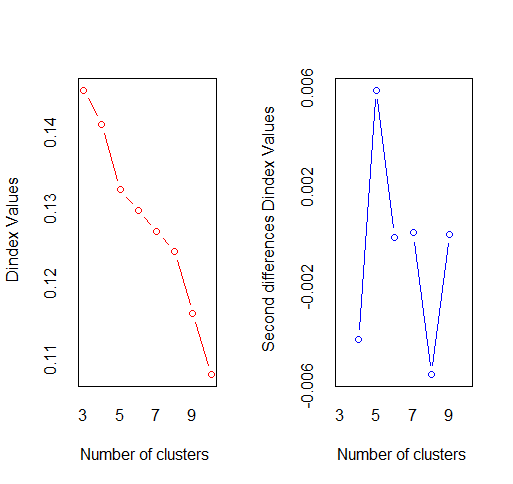
Figure 3.8: Finding the Optimal Cluster using D-index for the 2017-18 season.
The optimal number of clusters suggested by the D-index method is 5 for this season. This is possibly separating the players into the actual posistions (Point Guard, Shooting Guard, Small Forward, Power Forward, and Center). Below are tables to show the average statistics for each cluster and also which players belong to which cluster.
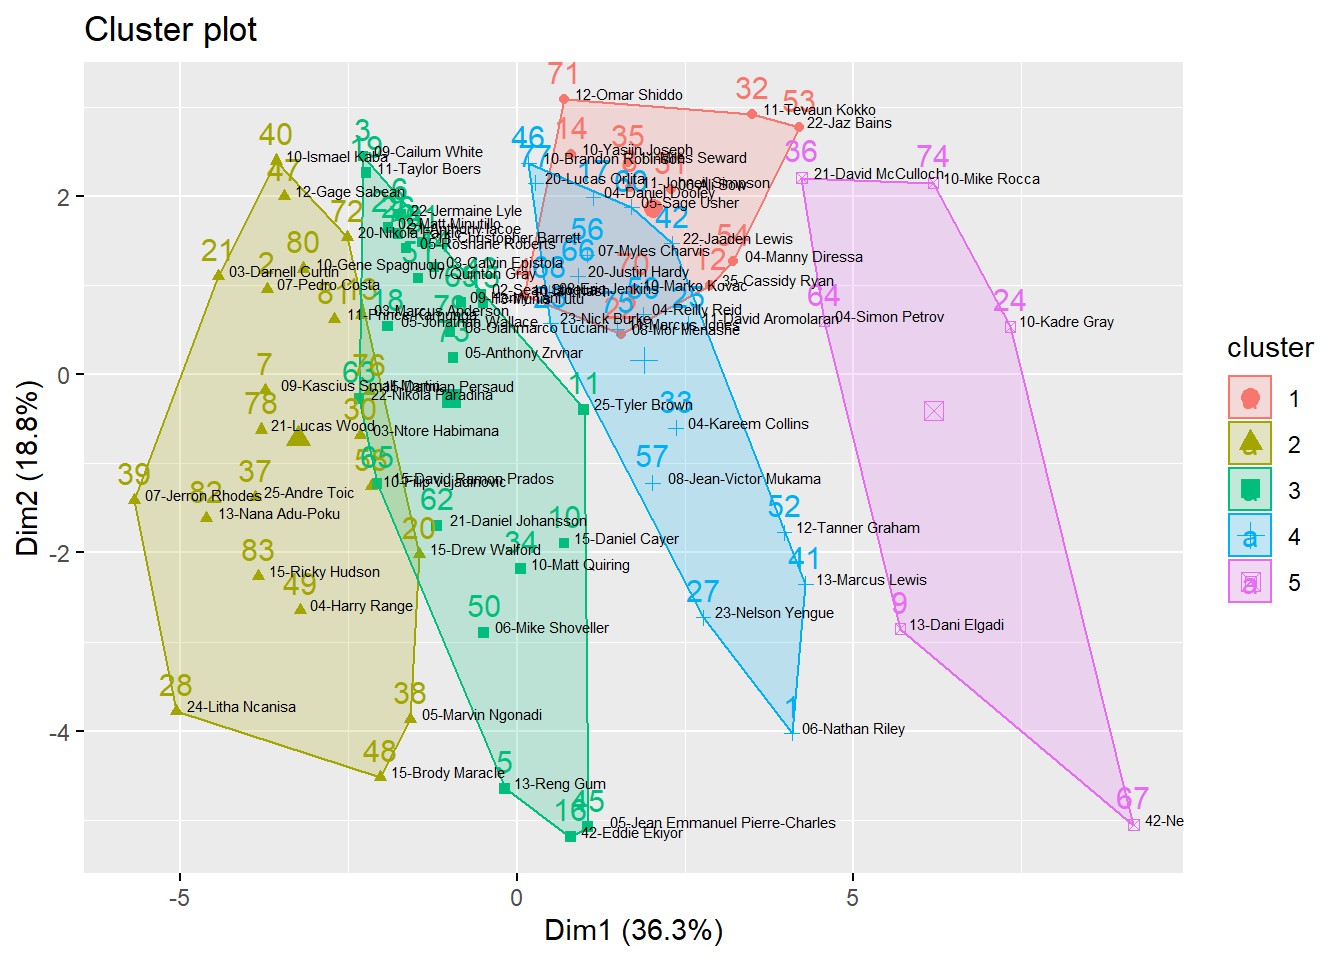
Figure 3.9: Cluster Plot of 2017-18 Season
| Cluster 1 | Cluster 2 | Cluster 3 | Cluster 4 | Cluster 5 | |
|---|---|---|---|---|---|
| 3PointMade | 46.75 | 16.23 | 23.72 | 28.11 | 29.50 |
| 3PointAttempted | 127.75 | 49.32 | 71.44 | 85.00 | 86.33 |
| Assists | 57.92 | 33.95 | 41.36 | 64.17 | 85.33 |
| Blocks | 3.83 | 6.68 | 10.04 | 11.06 | 11.33 |
| DefensiveRebounds | 70.17 | 60.45 | 74.40 | 93.22 | 137.00 |
| FieldGoalMade | 133.00 | 53.00 | 81.40 | 109.00 | 156.33 |
| FieldGoalAttempted | 309.83 | 129.64 | 189.52 | 255.67 | 340.33 |
| FreeThrowsMade | 58.42 | 20.86 | 36.56 | 55.17 | 117.17 |
| FreeThrowsAttempted | 75.50 | 33.68 | 52.52 | 77.28 | 144.00 |
| Minutes | 606.67 | 496.41 | 571.40 | 703.78 | 750.17 |
| OffensiveRebounds | 22.17 | 23.73 | 26.32 | 30.72 | 40.17 |
| PersonalFouls | 49.33 | 44.00 | 47.08 | 52.89 | 54.00 |
| Points | 371.17 | 143.09 | 223.08 | 301.28 | 459.33 |
| Rebounds | 92.33 | 84.18 | 100.72 | 123.94 | 177.17 |
| Steals | 26.50 | 17.73 | 19.88 | 31.11 | 27.67 |
| Turnovers | 48.58 | 31.09 | 34.00 | 49.33 | 65.33 |
| Home | 11.25 | 11.36 | 11.44 | 11.56 | 11.50 |
| GamesPlayed | 22.25 | 22.50 | 22.72 | 23.22 | 23.17 |
| PointsPerGame | 16.82 | 6.44 | 9.88 | 13.00 | 19.95 |
| MinutesPerGame | 27.36 | 22.11 | 25.22 | 30.34 | 32.43 |
| 3P% | 0.37 | 0.27 | 0.29 | 0.30 | 0.27 |
| FG% | 0.43 | 0.41 | 0.43 | 0.43 | 0.46 |
| FT% | 0.77 | 0.64 | 0.71 | 0.71 | 0.82 |
| TrueShooting% | 0.54 | 0.48 | 0.52 | 0.52 | 0.56 |
| Player | Team | Cluster |
|---|---|---|
| 10-Ian Nash | Algoma | 1 |
| 11-Johneil Simpson | Brock | 1 |
| 35-Cassidy Ryan | Brock | 1 |
| 10-Yasiin Joseph | Carleton | 1 |
| 08-Mor Menashe | Lakehead | 1 |
| 06-Ali Sow | Laurier | 1 |
| 11-Tevaun Kokko | Laurier | 1 |
| 11-Miles Seward | McMaster | 1 |
| 22-Jaz Bains | Queen’s | 1 |
| 04-Manny Diressa | Ryerson | 1 |
| 10-Marko Kovac | Western | 1 |
| 12-Omar Shiddo | Western | 1 |
| 07-Pedro Costa | Algoma | 2 |
| 09-Kascius Small-Martin | Brock | 2 |
| 03-Marcus Anderson | Carleton | 2 |
| 15-Drew Walford | Guelph | 2 |
| 03-Darnell Curtin | Lakehead | 2 |
| 24-Litha Ncanisa | Laurentian | 2 |
| 03-Ntore Habimana | Laurier | 2 |
| 25-Andre Toic | McMaster | 2 |
| 05-Marvin Ngonadi | Nipissing | 2 |
| 07-Jerron Rhodes | Nipissing | 2 |
| 10-Ismael Kaba | Nipissing | 2 |
| 12-Gage Sabean | Ottawa | 2 |
| 15-Brody Maracle | Ottawa | 2 |
| 04-Harry Range | Queen’s | 2 |
| 10-Filip Vujadinovic | Ryerson | 2 |
| 20-Nikola Farkic | Western | 2 |
| 15-Damian Persaud | Windsor | 2 |
| 21-Lucas Wood | Windsor | 2 |
| 10-Gene Spagnuolo | York | 2 |
| 11-Prince Kamunga | York | 2 |
| 13-Nana Adu-Poku | York | 2 |
| 15-Ricky Hudson | York | 2 |
| 09-Cailum White | Algoma | 3 |
| 13-Reng Gum | Algoma | 3 |
| 22-Jermaine Lyle | Algoma | 3 |
| 15-Daniel Cayer | Brock | 3 |
| 25-Tyler Brown | Brock | 3 |
| 13-Munis Tutu | Carleton | 3 |
| 42-Eddie Ekiyor | Carleton | 3 |
| 05-Jonathan Wallace | Guelph | 3 |
| 11-Taylor Boers | Guelph | 3 |
| 21-Anthony Iacoe | Laurentian | 3 |
| 02-Matt Minutillo | Laurier | 3 |
| 10-Matt Quiring | McMaster | 3 |
| 02-Sean Stoqua | Ottawa | 3 |
| 03-Calvin Epistola | Ottawa | 3 |
| 05-Jean Emmanuel Pierre-Charles | Ottawa | 3 |
| 06-Mike Shoveller | Queen’s | 3 |
| 07-Quinton Gray | Queen’s | 3 |
| 05-Roshane Roberts | Ryerson | 3 |
| 11-Christopher Barrett | Toronto | 3 |
| 21-Daniel Johansson | Toronto | 3 |
| 22-Nikola Paradina | Toronto | 3 |
| 15-David Ramon Prados | Waterloo | 3 |
| 09-Henry Tan | Western | 3 |
| 05-Anthony Zrvnar | Windsor | 3 |
| 08-Gianmarco Luciani | York | 3 |
| 06-Nathan Riley | Algoma | 4 |
| 04-Daniel Dooley | Guelph | 4 |
| 23-Nick Burke | Lakehead | 4 |
| 11-David Aromolaran | Laurentian | 4 |
| 23-Nelson Yengue | Laurentian | 4 |
| 04-Kareem Collins | McMaster | 4 |
| 13-Marcus Lewis | Nipissing | 4 |
| 22-Jaaden Lewis | Nipissing | 4 |
| 10-Brandon Robinson | Ottawa | 4 |
| 12-Tanner Graham | Queen’s | 4 |
| 07-Myles Charvis | Ryerson | 4 |
| 08-Jean-Victor Mukama | Ryerson | 4 |
| 04-Reilly Reid | Toronto | 4 |
| 05-Sage Usher | Toronto | 4 |
| 20-Justin Hardy | Waterloo | 4 |
| 08-Eriq Jenkins | Western | 4 |
| 11-Marcus Jones | Windsor | 4 |
| 20-Lucas Orlita | Windsor | 4 |
| 13-Dani Elgadi | Brock | 5 |
| 10-Kadre Gray | Laurentian | 5 |
| 21-David McCulloch | McMaster | 5 |
| 04-Simon Petrov | Waterloo | 5 |
| 42-Nedim Hodzic | Waterloo | 5 |
| 10-Mike Rocca | Windsor | 5 |
3.4.5 2018-19 Season
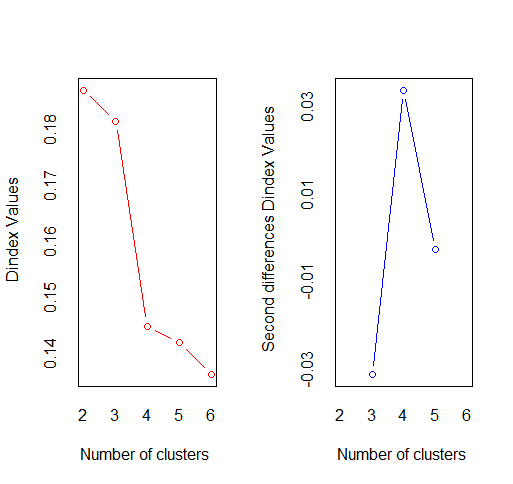
Figure 3.10: Finding the Optimal Cluster using D-index for the 2018-19 season.
The optimal number of clusters suggested for the 2018-19 season is 4. Below are tables to show the average statistics for each cluster and also which players belong to which cluster.

Figure 3.11: Cluster Plot of 2018-19 Season
| Cluster 1 | Cluster 2 | Cluster 3 | Cluster 4 | |
|---|---|---|---|---|
| 3PointMade | 25.24 | 75.50 | 18.74 | 38.00 |
| 3PointAttempted | 79.55 | 205.75 | 58.26 | 106.56 |
| Assists | 51.12 | 70.75 | 29.81 | 53.06 |
| Blocks | 9.03 | 4.25 | 6.85 | 11.12 |
| DefensiveRebounds | 83.12 | 96.00 | 60.33 | 114.81 |
| FieldGoalMade | 91.48 | 192.75 | 62.52 | 132.25 |
| FieldGoalAttempted | 215.67 | 435.75 | 150.70 | 308.19 |
| FreeThrowsMade | 40.79 | 105.00 | 28.93 | 81.19 |
| FreeThrowsAttempted | 58.48 | 130.75 | 40.74 | 108.38 |
| Minutes | 613.58 | 775.25 | 478.74 | 708.94 |
| OffensiveRebounds | 28.67 | 22.00 | 20.56 | 36.44 |
| PersonalFouls | 52.00 | 48.50 | 40.37 | 50.38 |
| Points | 249.00 | 566.00 | 172.70 | 383.69 |
| Rebounds | 111.79 | 118.00 | 80.89 | 151.25 |
| Steals | 24.64 | 31.00 | 15.96 | 24.69 |
| Turnovers | 37.42 | 68.00 | 29.00 | 50.12 |
| Home | 11.55 | 11.50 | 10.33 | 11.38 |
| GamesPlayed | 22.73 | 23.00 | 20.52 | 22.88 |
| PointsPerGame | 11.00 | 24.88 | 8.65 | 16.80 |
| MinutesPerGame | 27.05 | 33.72 | 23.51 | 30.99 |
| 3P% | 0.29 | 0.36 | 0.29 | 0.33 |
| FG% | 0.43 | 0.44 | 0.42 | 0.43 |
| FT% | 0.69 | 0.79 | 0.70 | 0.75 |
| TrueShooting% | 0.51 | 0.57 | 0.51 | 0.54 |
| Player | Team | Cluster |
|---|---|---|
| 03-Elijah Butler | Algoma | 1 |
| 08-David Bokanga | Algoma | 1 |
| 15-Daniel Cayer | Brock | 1 |
| 25-Tyler Brown | Brock | 1 |
| 11-Tj Lall | Carleton | 1 |
| 13-Munis Tutu | Carleton | 1 |
| 42-Eddie Ekiyor | Carleton | 1 |
| 22-Rasheed Weekes | Guelph | 1 |
| 08-Lock Lam | Lakehead | 1 |
| 23-Nick Burke | Lakehead | 1 |
| 21-Anthony Iacoe | Laurentian | 1 |
| 02-Matt Minutillo | Laurier | 1 |
| 03-Ntore Habimana | Laurier | 1 |
| 05-Jackson Mayers | Laurier | 1 |
| 11-Justin Hill | Nipissing | 1 |
| 03-Calvin Epistola | Ottawa | 1 |
| 07-Mackenzie Morrison | Ottawa | 1 |
| 10-Brandon Robinson | Ottawa | 1 |
| 07-Quinton Gray | Queen’s | 1 |
| 23-Jayden Frederick | Ryerson | 1 |
| 09-Evan Shadkami | Toronto | 1 |
| 11-Christopher Barrett | Toronto | 1 |
| 21-Daniel Johansson | Toronto | 1 |
| 22-Nikola Paradina | Toronto | 1 |
| 08-Eriq Jenkins | Western | 1 |
| 13-Julian Walker | Western | 1 |
| 20-Nikola Farkic | Western | 1 |
| 08-Chris Poloniato | Windsor | 1 |
| 11-Telloy Simon | Windsor | 1 |
| 14-Thomas Kennedy | Windsor | 1 |
| 20-Lucas Orlita | Windsor | 1 |
| 02-Chevon Brown | York | 1 |
| 05-DeAndrae Pierre | York | 1 |
| 11-Johneil Simpson | Brock | 2 |
| 10-Kadre Gray | Laurentian | 2 |
| 06-Ali Sow | Laurier | 2 |
| 12-Omar Shiddo | Western | 2 |
| 10-Michael Vos Otin | Brock | 3 |
| 03-Marcus Anderson | Carleton | 3 |
| 10-Yasiin Joseph | Carleton | 3 |
| 05-Aaron Nugent | Guelph | 3 |
| 21-Davarius Wright | Lakehead | 3 |
| 22-Josis Mikia-Thomas | Laurentian | 3 |
| 24-Litha Ncanisa | Laurentian | 3 |
| 32-Gaetan Chamand | Laurentian | 3 |
| 23-Sefa Otchere | McMaster | 3 |
| 32-Jordan Henry | McMaster | 3 |
| 05-Marvin Ngonadi | Nipissing | 3 |
| 08-Jordan Roberts | Nipissing | 3 |
| 12-Quintin Ashitei | Nipissing | 3 |
| 04-Harry Range | Queen’s | 3 |
| 05-Yusuf Ali | Ryerson | 3 |
| 10-Filip Vujadinovic | Ryerson | 3 |
| 14-Keevon Small | Ryerson | 3 |
| 04-Simon Petrov | Waterloo | 3 |
| 05-Colin Connors | Waterloo | 3 |
| 07-Jeff Baradziej | Waterloo | 3 |
| 15-David Ramon Prados | Waterloo | 3 |
| 23-Justin Malnerich | Waterloo | 3 |
| 09-Marko Kovac | Western | 3 |
| 10-Anthony Zrvnar | Windsor | 3 |
| 04-Prince Kamunga | York | 3 |
| 08-Gianmarco Luciani | York | 3 |
| 10-Gene Spagnuolo | York | 3 |
| 06-Nathan Riley | Algoma | 4 |
| 35-Cassidy Ryan | Brock | 4 |
| 15-Malcolm Glanville | Guelph | 4 |
| 32-Tommy Yanchus | Guelph | 4 |
| 40-Banky Alade | Guelph | 4 |
| 01-Isaiah Traylor | Lakehead | 4 |
| 11-Connor Gilmore | McMaster | 4 |
| 21-David McCulloch | McMaster | 4 |
| 13-Marcus Lewis | Nipissing | 4 |
| 12-Gage Sabean | Ottawa | 4 |
| 41-Guillaume Pepin | Ottawa | 4 |
| 03-Jaz Bains | Queen’s | 4 |
| 12-Tanner Graham | Queen’s | 4 |
| 07-Myles Charvis | Ryerson | 4 |
| 08-JV Mukama | Ryerson | 4 |
| 42-Nedim Hodzic | Waterloo | 4 |
3.5 Conclusion
Unsupervised learning used on basketball data can be very helpful. It can be used to categorize players and to see what their style of play is. It can also be used for match-ups and for predicting important players. For instance, if you find that a player was in the same cluster as the catch and shoot players, a coach can assign an appropriate defender. Knowing the style of play for your opponents is very useful for defensive purposes. In my opinion the higher the number of clusters assigned, the better because it would distinguish the type of player more.