Ejercicios Día 3
Herramientas R para perfilar datos
0.11 Carga de Librerias - AutoEDA
library(devtools)
library(autoEDA)
0.12 Análisis Univariado
## autoEDA | Setting color theme
## autoEDA | Removing constant features
## autoEDA | 0 constant features removed
## autoEDA | 0 zero spread features removed
## autoEDA | Removing features containing majority missing values
## autoEDA | 0 majority missing features removed
## autoEDA | Cleaning data
## autoEDA | Correcting sparse categorical feature levels
## autoEDA | Performing univariate analysis
## autoEDA | Visualizing data


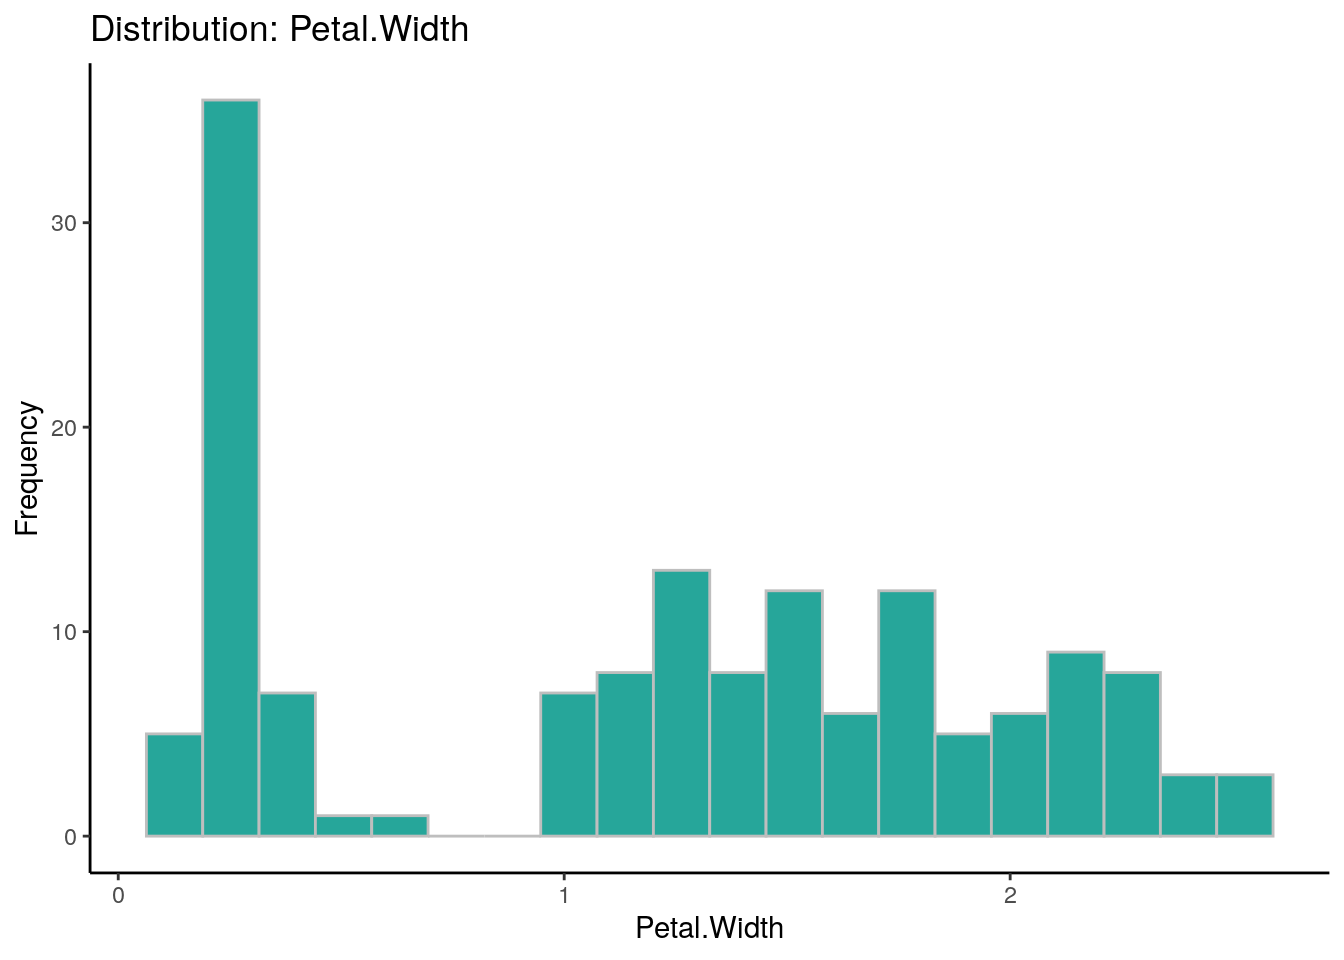
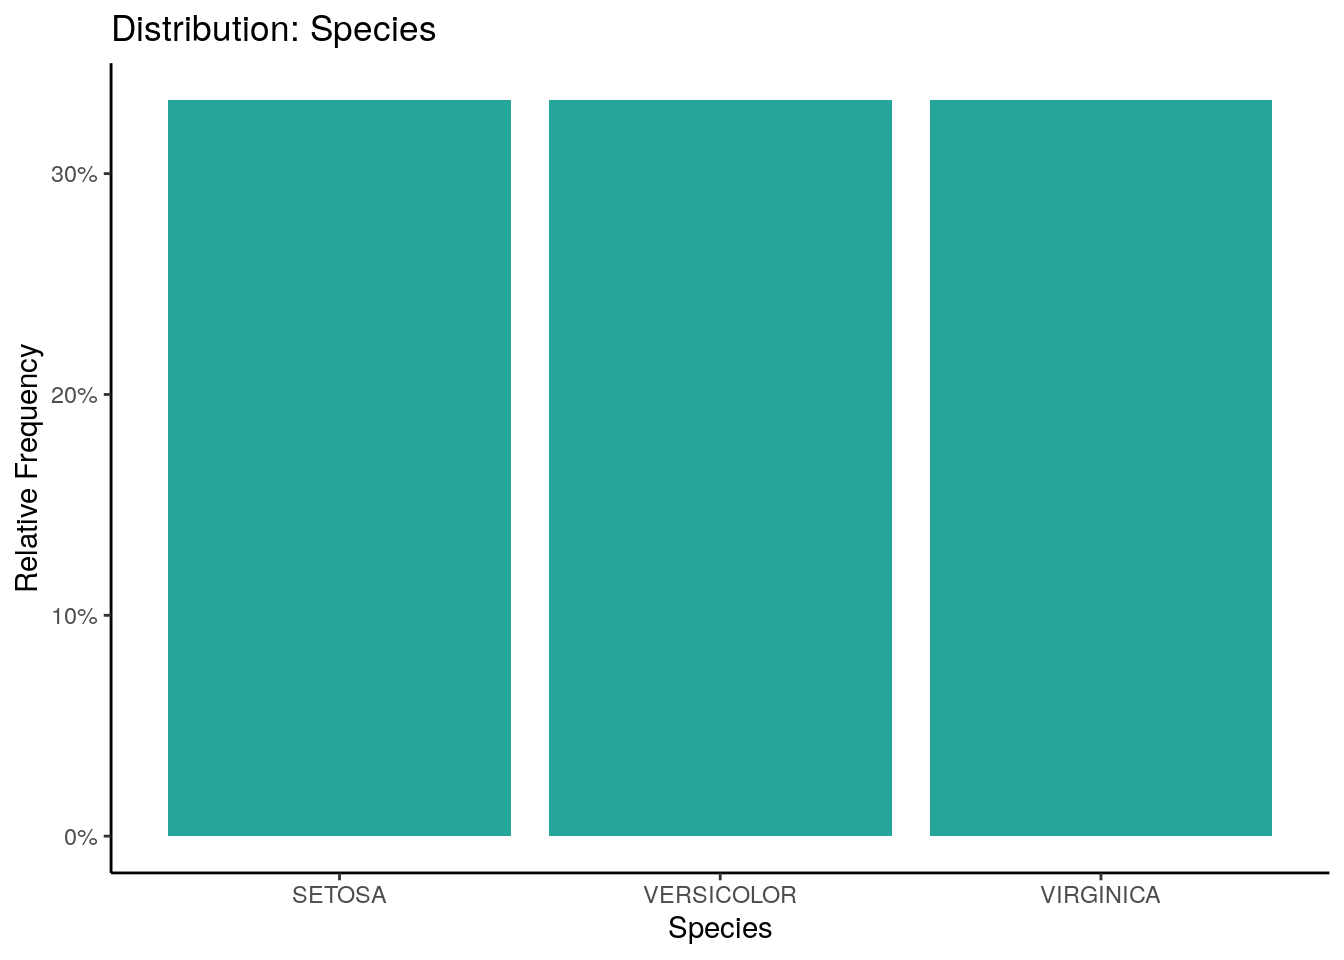
##        Feature Observations FeatureClass FeatureType PercentageMissing
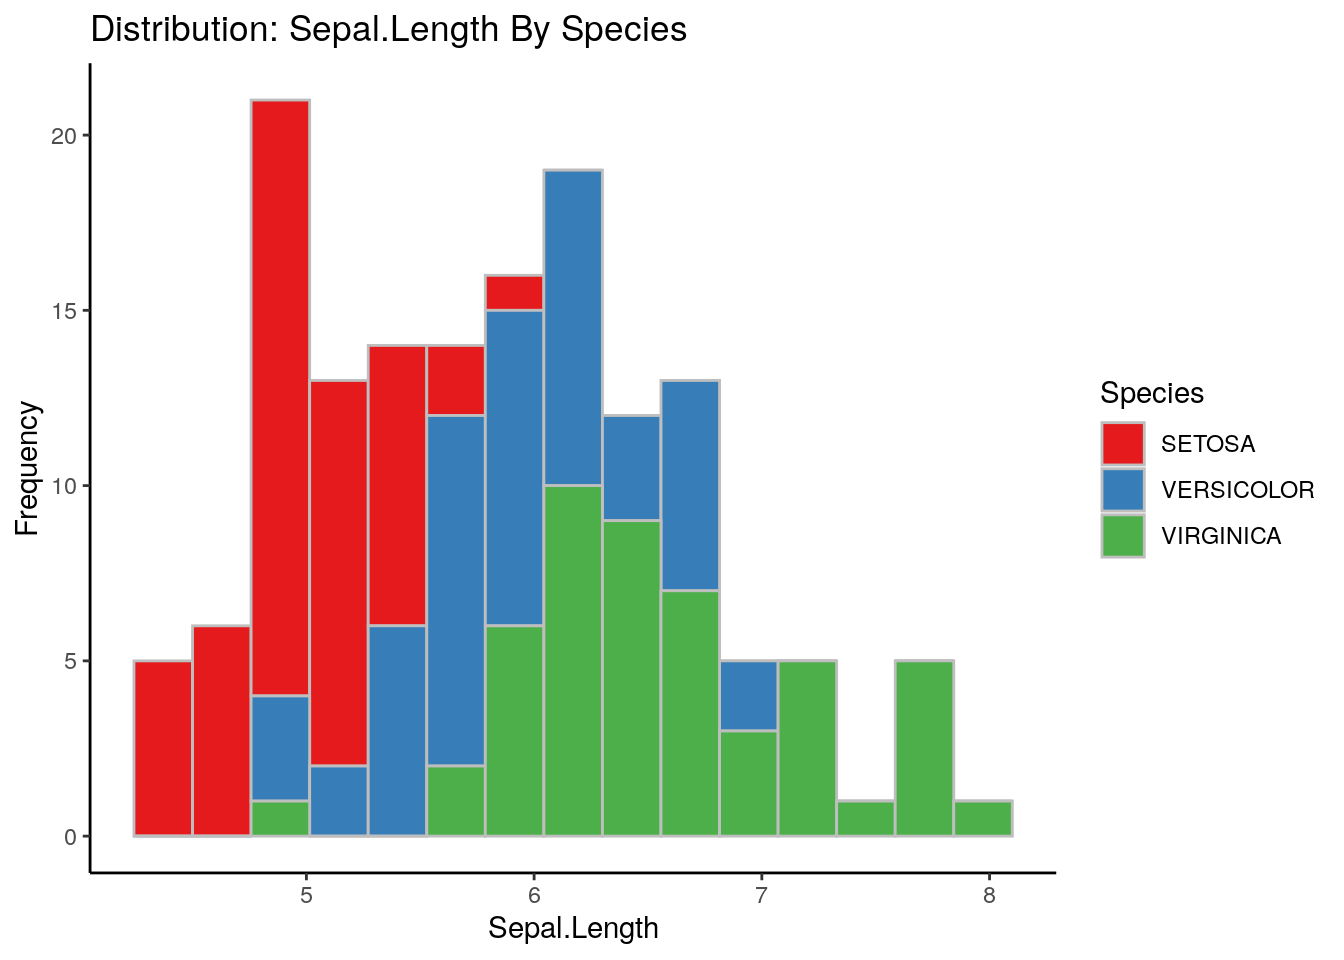
## 1 Sepal.Length          150      numeric  Continuous                 0
## 2  Sepal.Width          150      numeric  Continuous                 0
## 3 Petal.Length          150      numeric  Continuous                 0
## 4  Petal.Width          150      numeric  Continuous                 0
## 5      Species          150    character Categorical                 0
##   PercentageUnique ConstantFeature ZeroSpreadFeature LowerOutliers
## 1            23.33              No                No             0
## 2            15.33              No                No             1
## 3            28.67              No                No             0
## 4            14.67              No                No             0
## 5             2.00              No                No             0
##   UpperOutliers ImputationValue MinValue FirstQuartile Median Mean   Mode
## 1             0             5.8      4.3           5.1   5.80 5.84      5
## 2             3               3      2.0           2.8   3.00 3.06      3
## 3             0            4.35      1.0           1.6   4.35 3.76    1.4
## 4             0             1.3      0.1           0.3   1.30 1.20    0.2
## 5             0          SETOSA      0.0           0.0   0.00 0.00 SETOSA
##   ThirdQuartile MaxValue LowerOutlierValue UpperOutlierValue
## 1           6.4      7.9              3.15              8.35
## 2           3.3      4.4              2.05              4.05
## 3           5.1      6.9             -3.65             10.35
## 4           1.8      2.5             -1.95              4.05
## 5           0.0      0.0              0.00              0.00
0.13 Regresión Bivariada
## autoEDA | Setting color theme
## autoEDA | Removing constant features
## autoEDA | 0 constant features removed
## autoEDA | Removing zero spread features
## autoEDA | 0 zero spread features removed
## autoEDA | Removing features containing majority missing values
## autoEDA | 0 majority missing features removed
## autoEDA | Cleaning data
## autoEDA | Correcting sparse categorical feature levels
## autoEDA | Sorting features
## autoEDA | Regression outcome detected
## autoEDA | Calculating feature predictive power
## autoEDA | Visualizing data


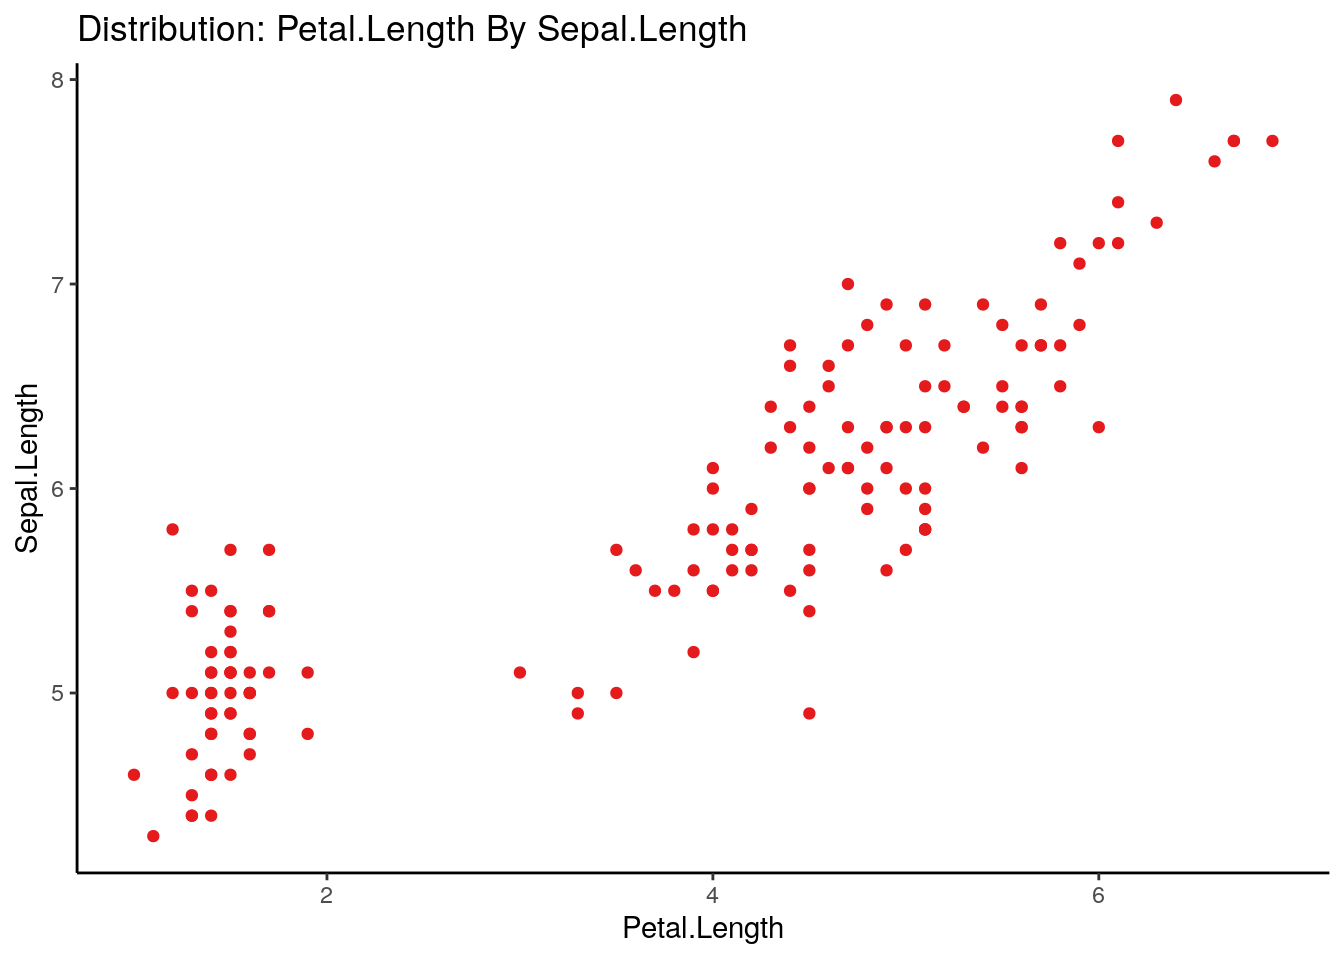
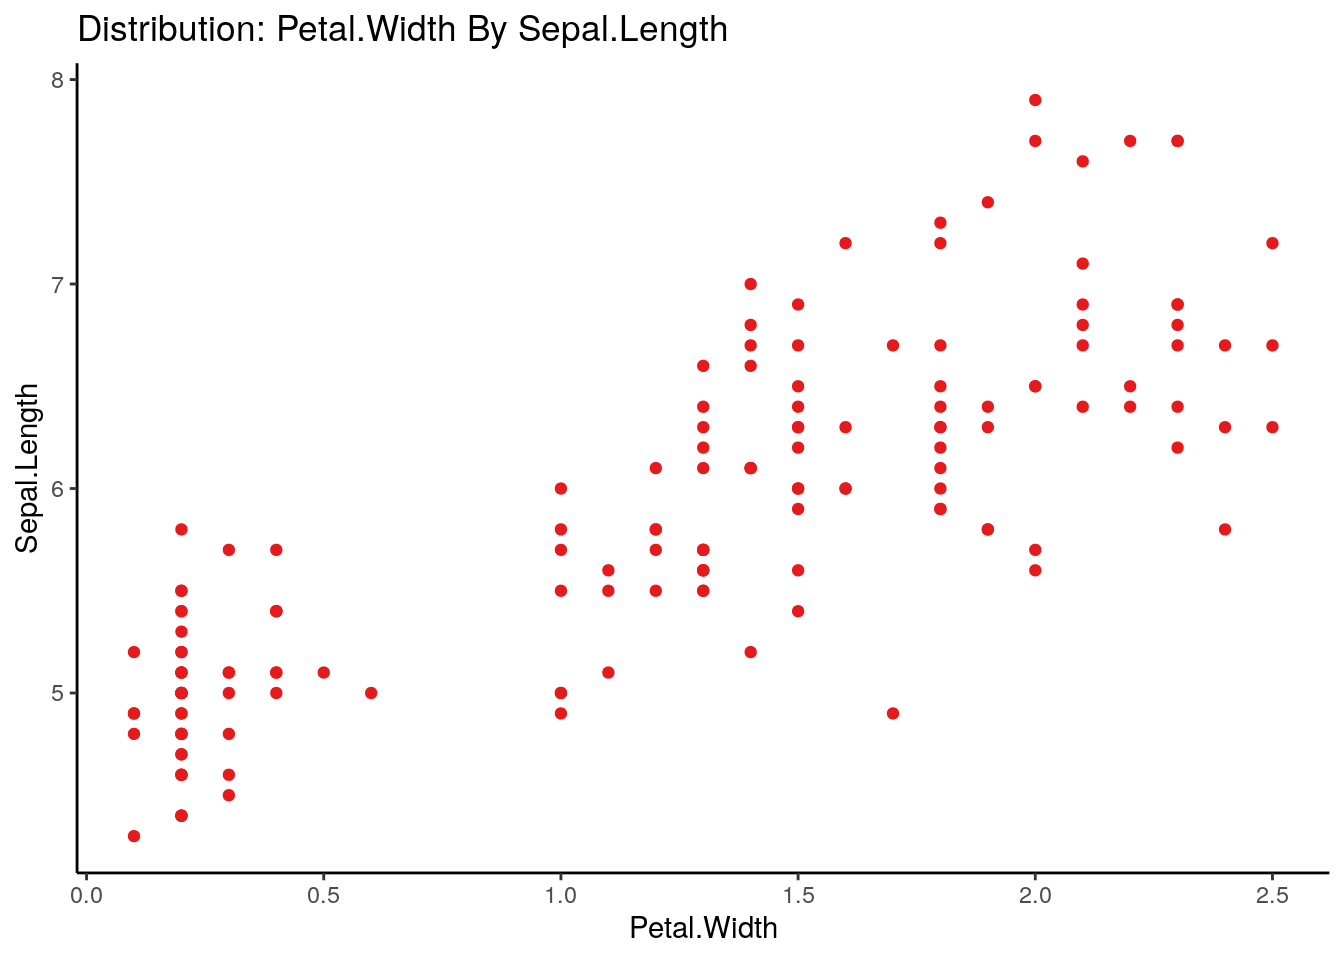
##        Feature Observations FeatureClass FeatureType PercentageMissing
## 1 Petal.Length          150      numeric  Continuous                 0
## 2  Petal.Width          150      numeric  Continuous                 0
## 3 Sepal.Length          150      numeric  Continuous                 0
## 4  Sepal.Width          150      numeric  Continuous                 0
## 5      Species          150    character Categorical                 0
##   PercentageUnique ConstantFeature ZeroSpreadFeature LowerOutliers
## 1            28.67              No                No             0
## 2            14.67              No                No             0
## 3            23.33              No                No             0
## 4            15.33              No                No             1
## 5             2.00              No                No             0
##   UpperOutliers ImputationValue MinValue FirstQuartile Median Mean   Mode
## 1             0            4.35      1.0           1.6   4.35 3.76    1.4
## 2             0             1.3      0.1           0.3   1.30 1.20    0.2
## 3             0             5.8      4.3           5.1   5.80 5.84      5
## 4             3               3      2.0           2.8   3.00 3.06      3
## 5             0          SETOSA      0.0           0.0   0.00 0.00 SETOSA
##   ThirdQuartile MaxValue LowerOutlierValue UpperOutlierValue
## 1           5.1      6.9             -3.65             10.35
## 2           1.8      2.5             -1.95              4.05
## 3           6.4      7.9              3.15              8.35
## 4           3.3      4.4              2.05              4.05
## 5           0.0      0.0              0.00              0.00
##   PredictivePowerPercentage PredictivePower
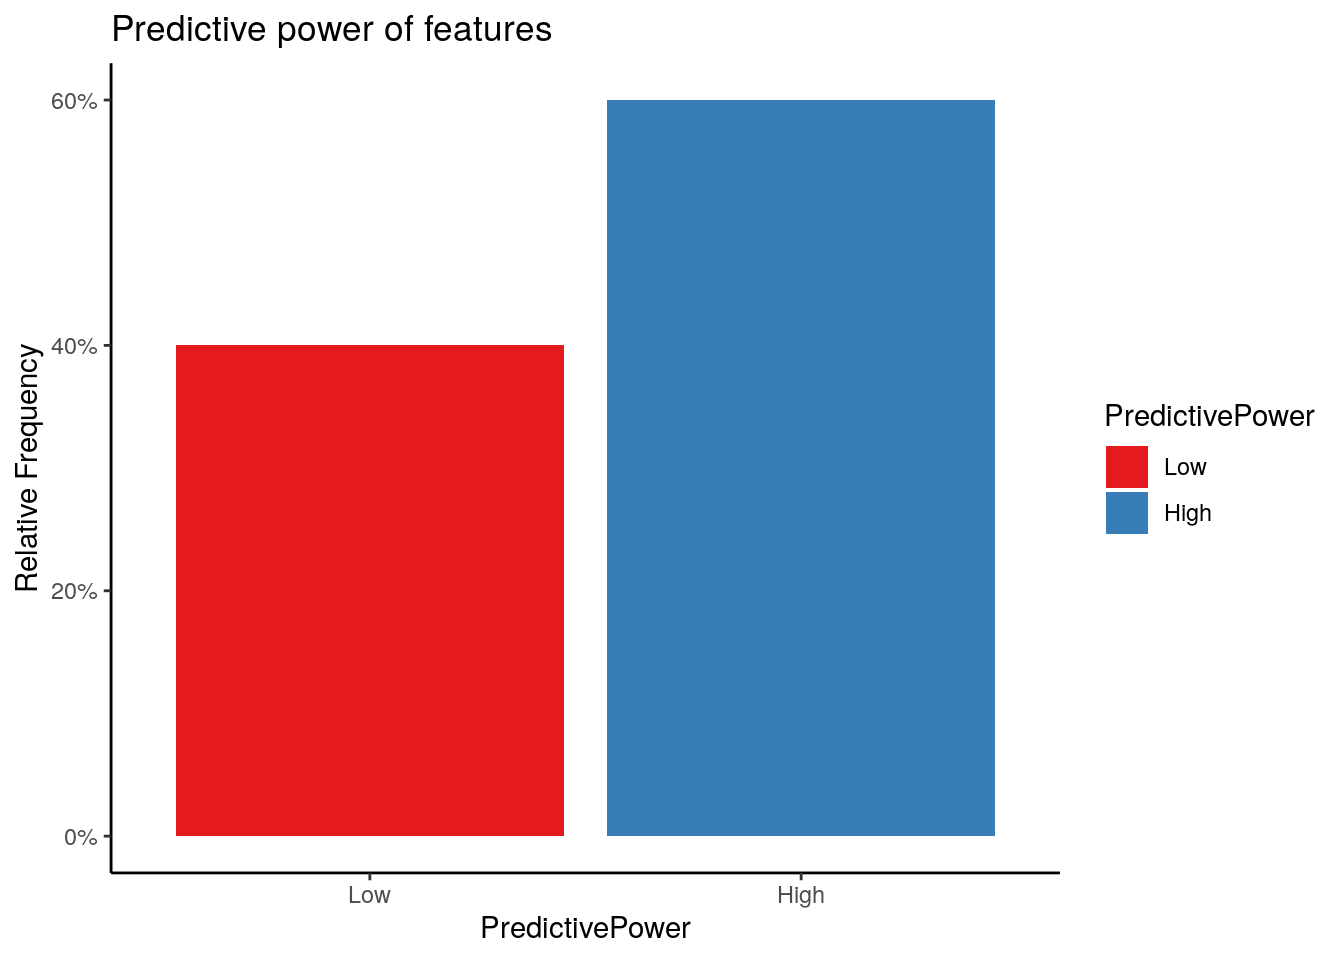
## 1                        87            High
## 2                        82            High
## 3                         0             Low
## 4                        12             Low
## 5                        78            High
0.14 Clasificación Bivariada
## autoEDA | Setting color theme
## autoEDA | Removing constant features
## autoEDA | 0 constant features removed
## autoEDA | Removing zero spread features
## autoEDA | 0 zero spread features removed
## autoEDA | Removing features containing majority missing values
## autoEDA | 0 majority missing features removed
## autoEDA | Cleaning data
## autoEDA | Correcting sparse categorical feature levels
## autoEDA | Sorting features
## autoEDA | Multi-class classification outcome detected
## autoEDA | Calculating feature predictive power
## autoEDA | Visualizing data


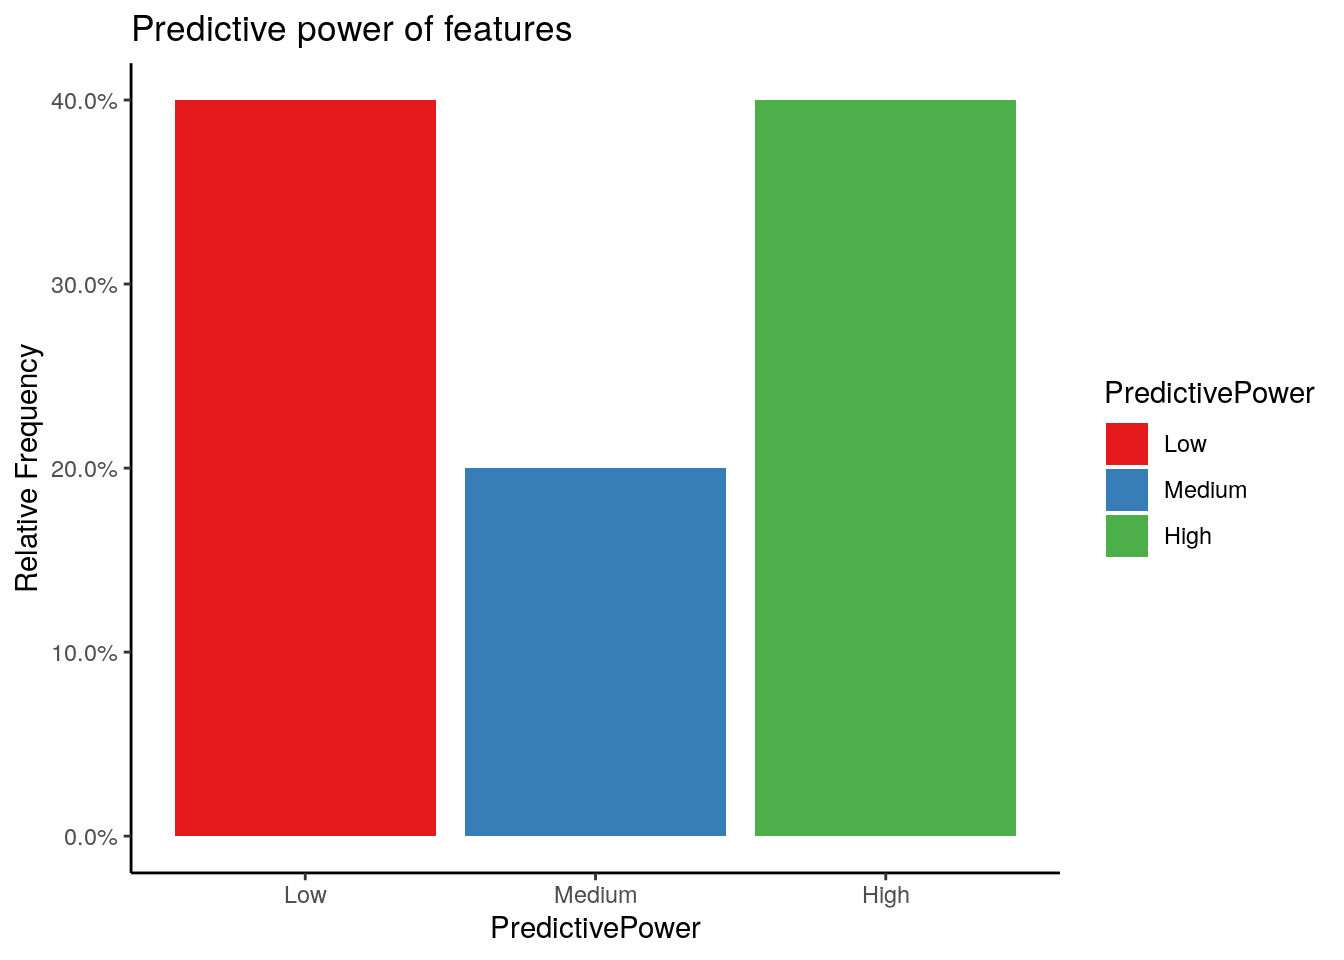
##        Feature Observations FeatureClass FeatureType PercentageMissing
## 1 Petal.Length          150      numeric  Continuous                 0
## 2  Petal.Width          150      numeric  Continuous                 0
## 3 Sepal.Length          150      numeric  Continuous                 0
## 4  Sepal.Width          150      numeric  Continuous                 0
## 5      Species          150    character Categorical                 0
##   PercentageUnique ConstantFeature ZeroSpreadFeature LowerOutliers
## 1            28.67              No                No             0
## 2            14.67              No                No             0
## 3            23.33              No                No             0
## 4            15.33              No                No             1
## 5             2.00              No                No             0
##   UpperOutliers ImputationValue MinValue FirstQuartile Median Mean   Mode
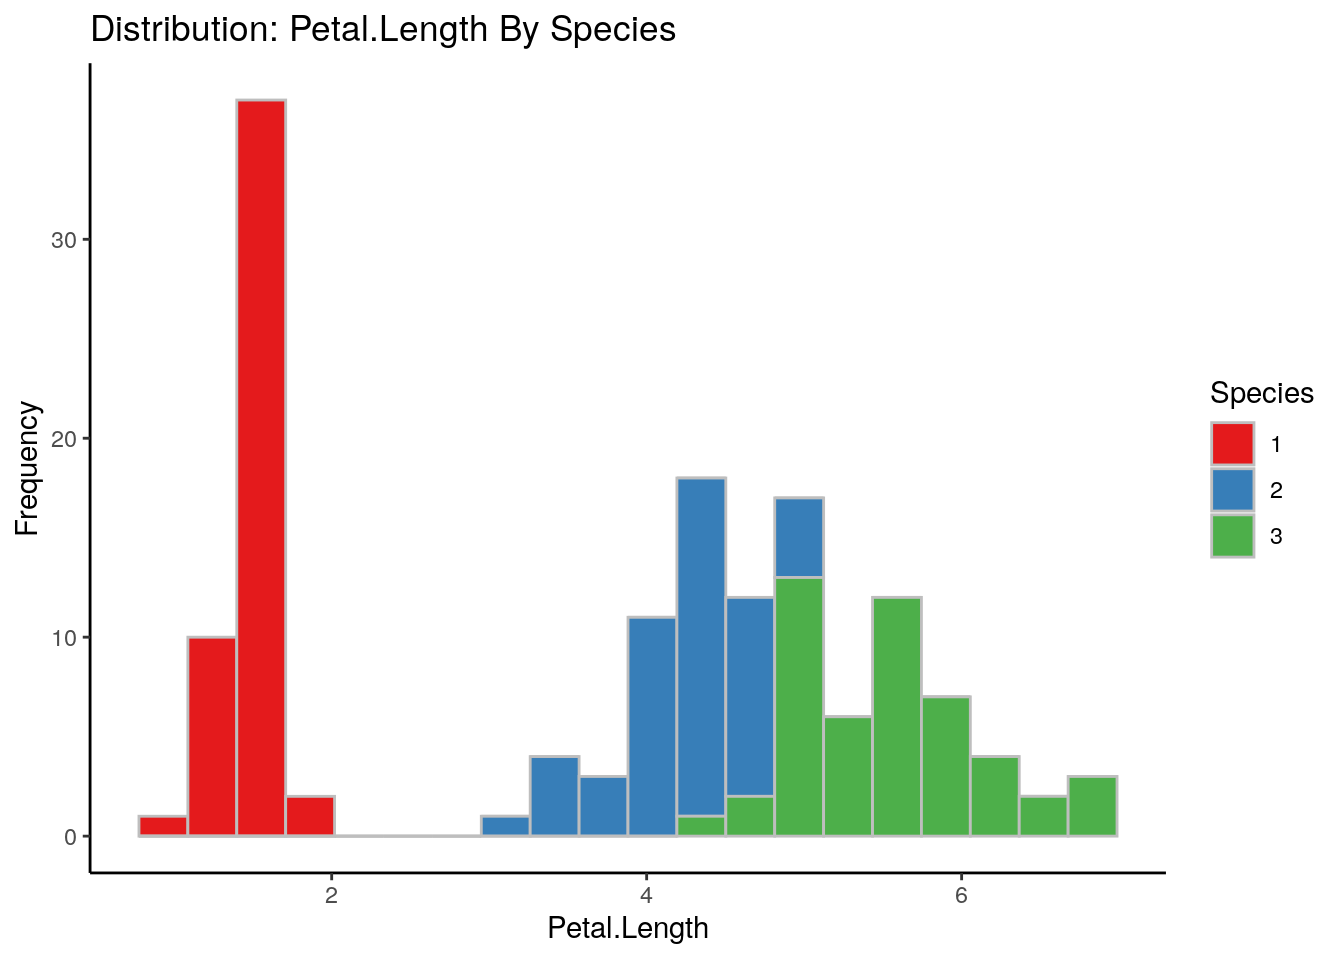
## 1             0            4.35      1.0           1.6   4.35 3.76    1.4
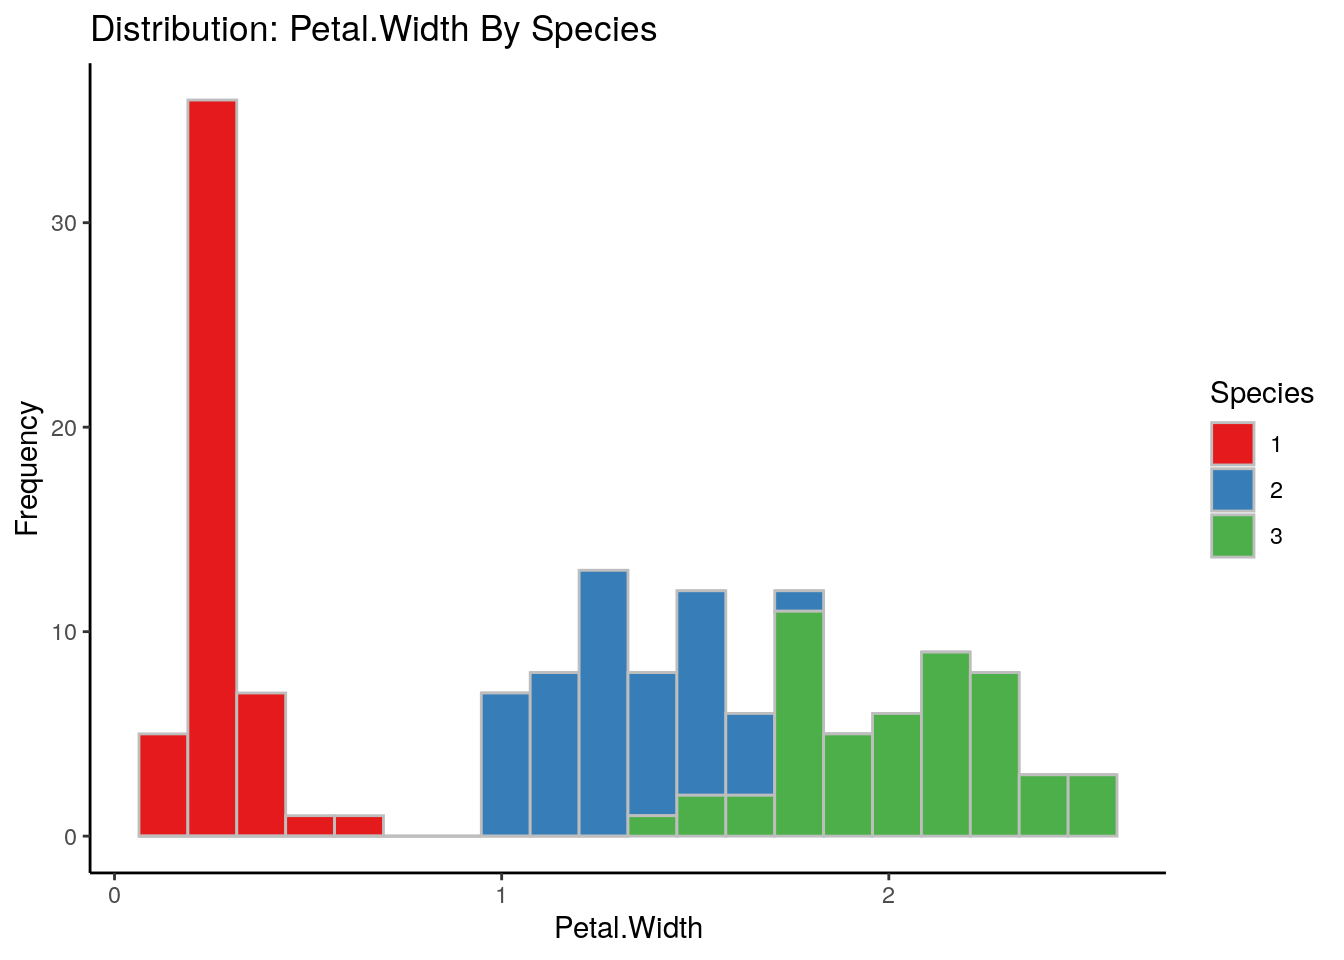
## 2             0             1.3      0.1           0.3   1.30 1.20    0.2
## 3             0             5.8      4.3           5.1   5.80 5.84      5
## 4             3               3      2.0           2.8   3.00 3.06      3
## 5             0          SETOSA      0.0           0.0   0.00 0.00 SETOSA
##   ThirdQuartile MaxValue LowerOutlierValue UpperOutlierValue
## 1           5.1      6.9             -3.65             10.35
## 2           1.8      2.5             -1.95              4.05
## 3           6.4      7.9              3.15              8.35
## 4           3.3      4.4              2.05              4.05
## 5           0.0      0.0              0.00              0.00
##   PredictivePowerPercentage PredictivePower
## 1                        86            High
## 2                        88            High
## 3                        46          Medium
## 4                        24             Low
## 5                         0             Low