ProteoMill
2021-05-18
Module 1 Introduction
The analysis of protein enrichment and knowledge of protein-protein interactions have become essential tools in many proteomics studies. We developed ProteoMill, an analysis platform with the purpose to enable researchers to quickly gain insights about the molecular events in their data. ProteoMill is unique in that it is a free, open-source, always up-to-date and easily accessible web tool that renders a complete pipeline from data upload to differential expression-, enrichment- and network analysis.
1.1 Intended audience
A common requirement for performing downstream proteomic analyses is to know a programming or scripting language, and having the computational experience to convert between data formats. ProteoMill offers codeless analysis of protein expression datasets and is designed to be an easy to use alternative to script-based analyses for life science researchers.
1.2 Limitations
Currently ProteoMill only supports three species: Homo sapiens, Mus musculus and Rattus norvegicus. If you have data from another organism you can still use the initial sections of ProteoMill, as they do not require annotation data, but pathway analysis and network analysis will be unavailable. In order to upload data from an unsupported organism, select Other under Select organism in the Data import wizard.
Some functionality may be somewhat slow (take a few seconds to load) when using very large datasets (>50k rows). See Performance for details. If a function takes longer to load, you have probably encountered a bug. Please submit it as explained here.
1.3 Terminology
- Proteome: the set of all expressed proteins in an organism (or sometimes a more narrow biological context; tissue, cell etc).
- Proteomics: the study of the proteome.
- LC-MS: liquid chromatography–mass spectrometry.
- PCA: principal component analysis, a dimensionality reduction method
- Missing values: absence of counts/intensities in an expression matrix, often due to peptide intensity below detection limit in LC-MS.
- Differential expression: statistical analysis method used to estimate quantitative changes in expression levels between treatments.
- Contrast: the experimental groups we want to compare.
- Pathway: defined lists of proteins with common biological function.
- Enrichment: over-representation of a set of proteins in a pathway.
- Reactome: a pathway database
- STRINGdb: a protein-protein interaction database
- Network: protein-protein interaction network is the network that is formed by biochemical events of interacting proteins.
- Interactome: the set of all molecular interactions in an organism (or sometimes a more narrow biological context; tissue, cell etc).
- Identifiers: protein labels or accession number that uniquely identifies a protein.
1.4 Performance
Most ProteoMill functions make use of data.table operations, which scales well with large datasets. Therefore, unless there are hickups with the server, most features available in ProteoMill should take a few seconds to run at the most. Let’s break out a some functions from ProteoMill to evaluate their performance.
1.4.1 Benchmarking
# In this example we look at the pathway enrichment function. First we'll read the Reactome database file.
library(data.table)

database <- fread("ProteoMill-examples/9606_REACTOME_low.tsv.gz", sep = '\t', header = T)

# How many rows are in the database?
database[, .N]
## [1] 39910# Next, we need a list of protein identifiers.
proteins <- fread("ProteoMill-examples/donors.uniprot.csv", sep = ';', header = T)[[1]]
# Show first 10
head(proteins, 10)## [1] "A1L4H1" "A5A3E0" "A6NMZ7" "A8TX70" "O00142" "O00299" "O00300" "O00339" "O00391" "O00622"## [1] 638# Next, we define the function to test for over-representation.
ora <- function(proteins, database, pAdjMethod = "BH") {
proteins <- proteins[proteins %in% database$UniprotID]
if(length(proteins) == 0) {
return (NULL)
} else {
# Genes and their counts in input and background, for each pathway
dt <- database[, list(proteins = list(UniprotID[UniprotID %in% proteins]),
background = list(UniprotID),
q = length(UniprotID[UniprotID %in% proteins]),
m = length(UniprotID)),
by = .(ReactomeID, Pathway_name, TopReactomeName)]
dt <- dt[q > 0]
# Total number of proteins
dtN = database[!duplicated(UniprotID), .N]
# Calculate and format p-values
dt[ , p := mapply(phyper, q - 1, m, n = (dtN - m), k = length(proteins), lower.tail = F)]
dt$p.adj <- p.adjust(dt$p, method = pAdjMethod)
dt$p <- formatC(dt$p, format = "e", digits = 2)
dt$p.adj <- formatC(dt$p.adj, format = "e", digits = 2)
dt <- dt[order(as.numeric(p.adj))]
return(dt)
}
}# We call the function using our protein vector and database.
res <- ora(proteins, database)
# Let's take a quick peek at the results
res[1:4, c(2, 9)]## Pathway_name p.adj
## 1: Collagen chain trimerization 5.88e-26
## 2: Collagen biosynthesis and modifying enzymes 6.36e-23
## 3: Regulation of Complement cascade 6.36e-23
## 4: Assembly of collagen fibrils and other multimeric structures 5.15e-22# Then we call the function again using a package called microbenchmark to evaluate the performance.
library(microbenchmark)
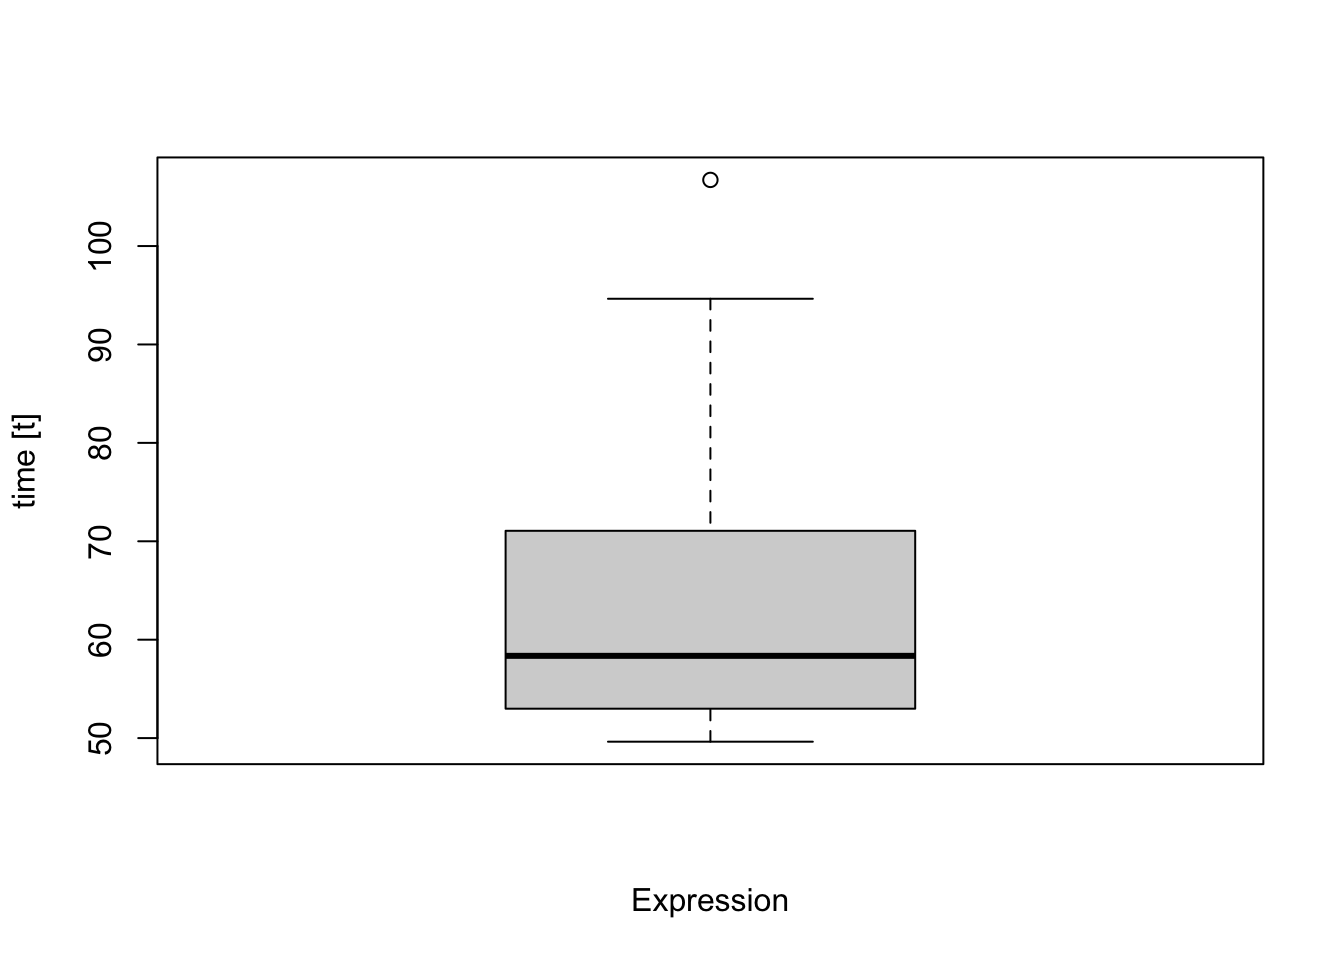
res <- microbenchmark(ora(proteins, database), times=100L)
# Show time in seconds
options(microbenchmark.unit="ms")
print(res)## Unit: milliseconds
## expr min lq mean median uq max neval
## ora(proteins, database) 49.63545 52.98792 63.00007 58.35898 71.06504 106.7212 100