2 Survey Description
2.1 Survey Methodology
Groups of farms that closely match the average regional herd size, hectares and milksolids production, as described in the New Zealand Dairy Statistics 2018-19 were selected for this publication. The initial pool of herds included 515 Owner-operator and 204 50:50 Sharemilker (herd owning Sharemilker) herds, validated and committed to the DairyBase® database for the 2018-19 financial year. This excluded:
multiple herds operating under one business identity, and
herds with less than 100 cows.
Businesses were then excluded for the following reasons:
businesses with a significant change in land area during the year, and
extreme outlier data.
The aim of the sample was to align the regional and national average herd sizes, hectares and milksolids production for each of these two ownership structures while retaining a reasonable number of farm businesses in each region. These regional and national averages are available in New Zealand Dairy Statistics 2018-19 publication.
The final number of herds included in this survey comprised 260 owner-operator and 122 50:50 sharemilker herds. Of the owner-operator herds, 193 (74%) were North Island herds and 67 (26%) from the South Island. Of the sharemilker herds, 87 (71%) were from the North Island and 35 (29%) were South Island herds.
2.2 Ownership Structure Definitions
An owner-operator receives 100% of the milk revenue and either owns, or leases, both the herd and the land. In contrast, a 50:50 sharemilker owns the herd but not the milking land, and receives 50% of the milk revenue. Although the definition of sharemilkers used in this survey is 50:50, in practice they may receive between 40 percent and 60 percent of the milk revenue. Herds with variable order sharemilkers, and farm owners with sharemilking arrangements, were not included in this survey.
2.3 Sample Unit
The data used in this survey reflects the total dairying enterprise of each business. Where businesses have multiple ownership types, such as partnerships and trusts, the accounts of all entities are consolidated and entered as one.
2.4 Survey Weights
National averages in this report have been weighted by the regional proportion of herds reported in the New Zealand Dairy Statistics 2018-19. Simply averaging the regional data shown in this document will not produce the same result as that shown for New Zealand. Herd size is defined as the peak number of cows milked at any time during the year. Total herds are used as the weight for owner operators, because owner operators represent the whole business unit. The national average for 50:50 sharemilkers is weighted by the regional proportions of sharemilkers.
| New Zealand herds | % of all herds | Owner-operator herds | % of Owner-operator herds | 50:50 Sharemilker herds | % of 50:50 Sharemilker herds | |
|---|---|---|---|---|---|---|
| Northland | 947 | 8.3% | 615 | 9.5% | 221 | 6.6% |
| Waikato | 3745 | 32.9% | 1960 | 30.1% | 1215 | 36.5% |
| Bay of Plenty | 858 | 7.5% | 502 | 7.7% | 217 | 6.5% |
| Taranaki | 1588 | 14.0% | 863 | 13.3% | 533 | 16.0% |
| Lower North Island | 1018 | 9.0% | 656 | 10.1% | 234 | 7.0% |
| West Coast-Tasman | 513 | 4.5% | 379 | 5.8% | 94 | 2.8% |
| Marlborough-Canterbury | 1273 | 11.2% | 786 | 12.1% | 343 | 10.3% |
| Otago-Southland | 1430 | 12.6% | 746 | 11.5% | 474 | 14.2% |
2.5 Herd Size Distributions
The average DairyNZ Economic Survey owner-operator herd of 424 cows was eleven less than the New Zealand Dairy Statistics 2018-19 national average herd size of 435 cows.
A comparison of the owner-operator herd distribution between the DairyNZ Economic Survey and the New Zealand Dairy Statistics 2018-19 shows the DairyNZ survey:
excludes herds under 100 cows;
is over represented by herds between 200 and 600 cows; and
is under represented by herds between 100 and 200 cows, between 700 and 900 cows, and 1200+.
Refer to Figure 2.1.
Figure 2.1: 2018-19 New Zealand Owner-operator Herd Size Distributions
The DairyNZ Economic Survey national average herd size for 50:50 Sharemilkers of 452 cows is larger than the 398 cows recorded in the New Zealand Dairy Statistics 2018-19.
Compared with the New Zealand Dairy Statistics 2018-19 the DairyNZ Economic Survey:
excludes herds under 100 cows;
is over represented by herds between 400 and 700 cows;
is under-represented by herds between 100 and 200 cows and between 700 and 900 cows.
Refer to Figure 2.2.
Figure 2.2: 2018-19 New Zealand 50:50 Sharemilker Herd Size Distributions
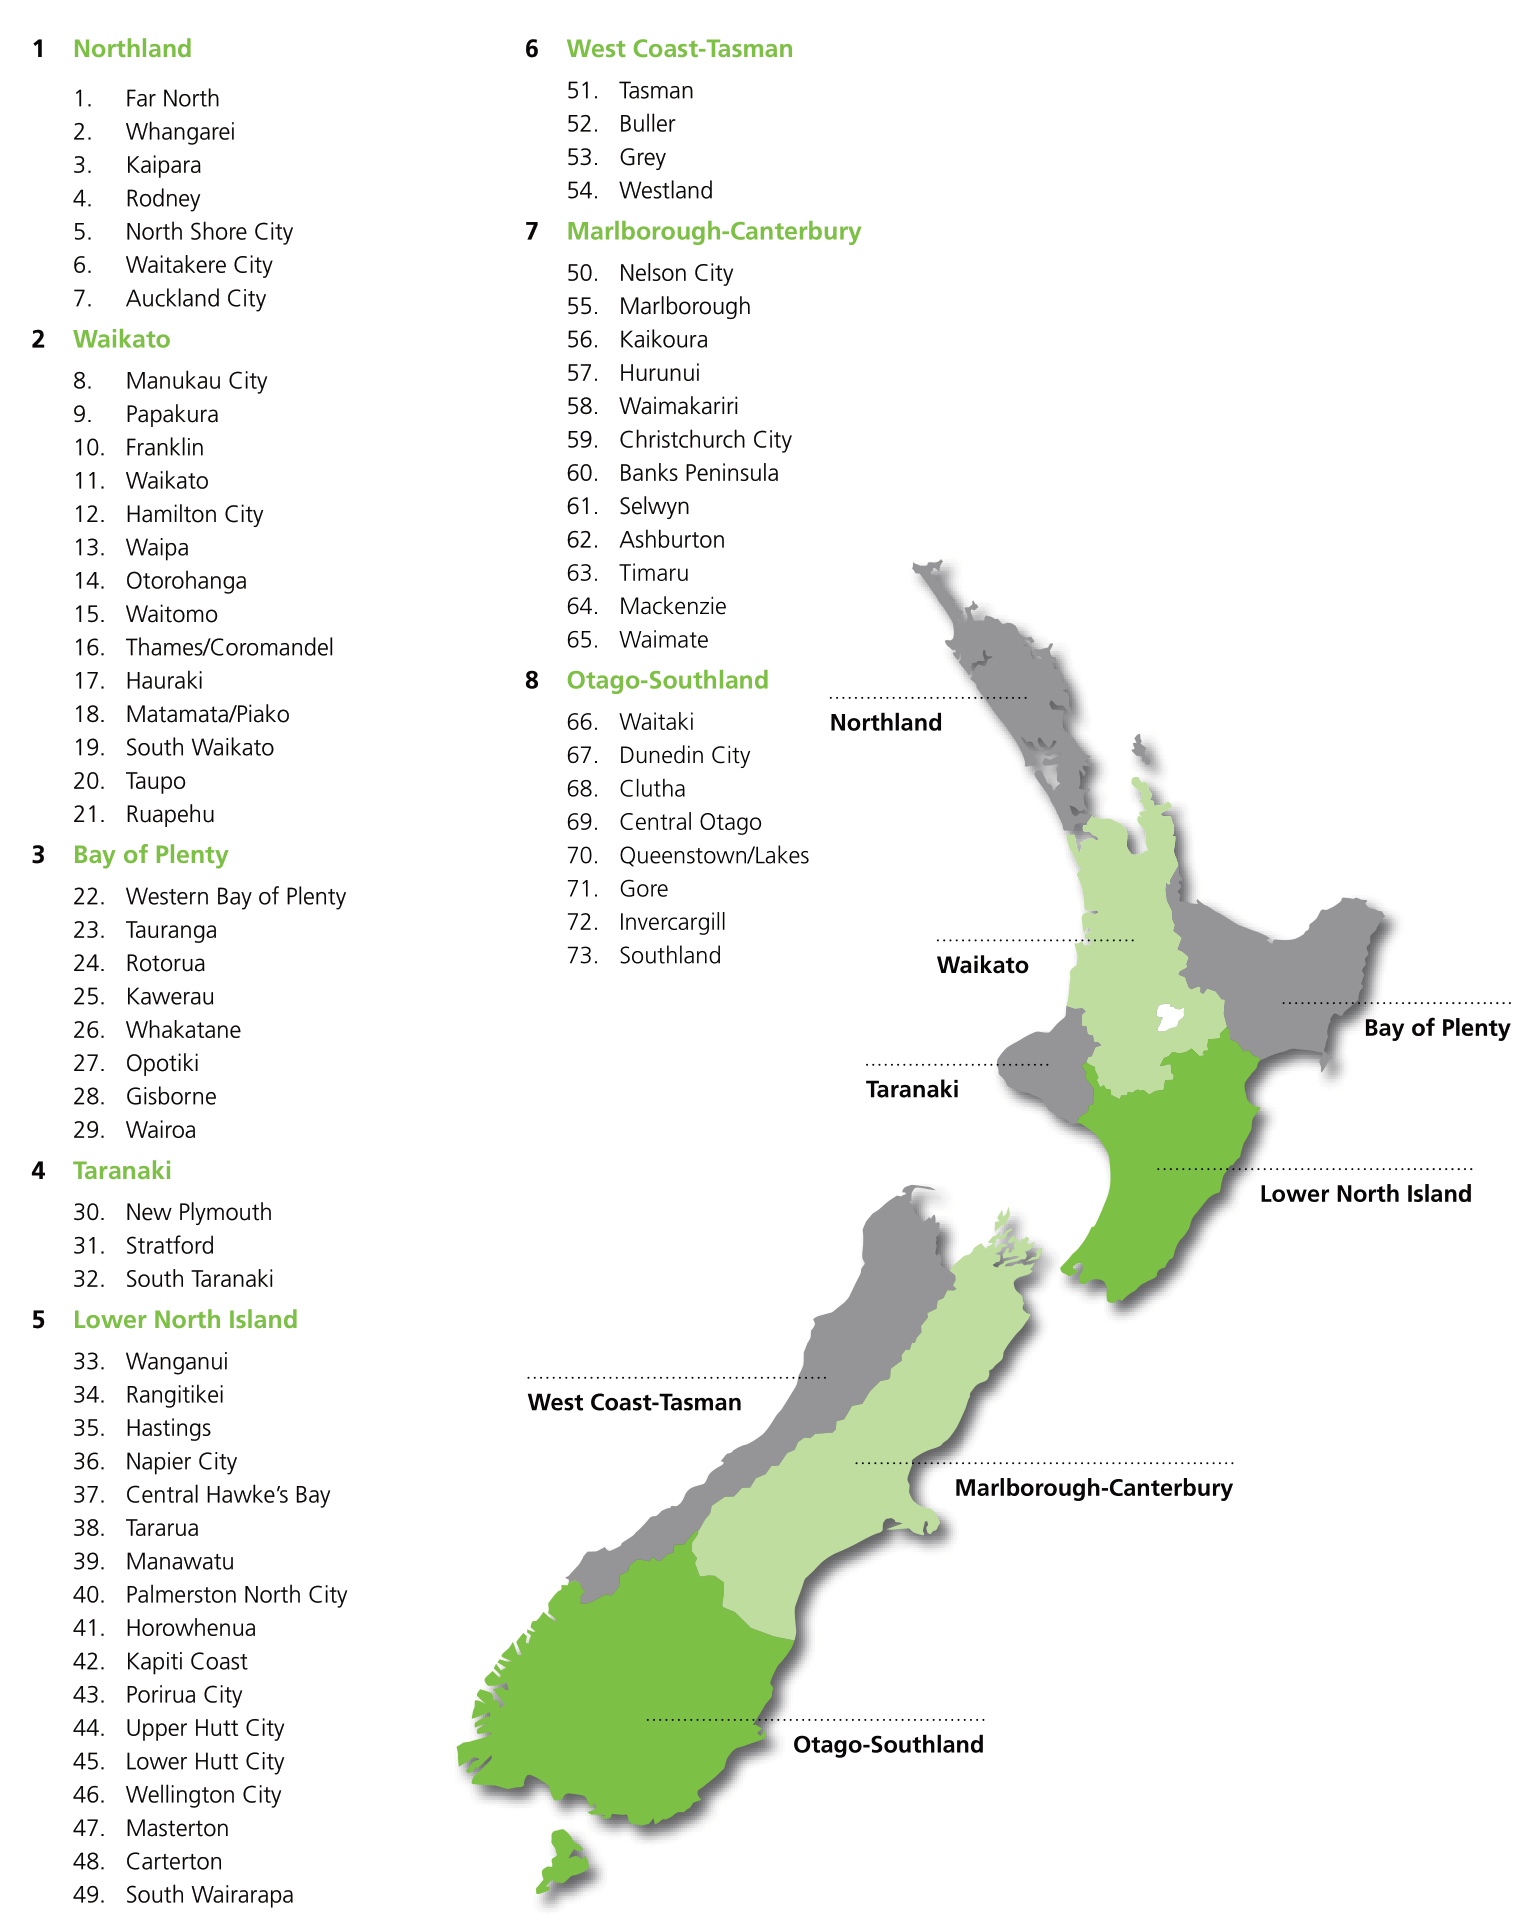
2.6 Survey Regions
This survey uses geographic regions and districts as defined by the 73 Territorial Local Authorities. These districts are amalgamated into eight regions, five in the North Island and three in the South Island.
2.7 Production Systems
Farms are categorised into one of five production systems based on the timing, purpose and amount of imported feed use, both purchased as supplements and grazing off for dry cows. Young stock grazing policies are excluded when categorising herds into the five production systems described below.
System 1: All grass, self-contained, all adult stock on the dairy platform
- No feed is imported. No supplement fed unless harvested off the effective milking area and dry cows are not grazed off the effective milking area. Approximately five percent of owner-operator herds.
System 2: Feed imported, either supplement or grazing off, fed to dry cows
- 90-99% of total feed is home grown feed. Variation in percentage as most cows are wintered off in high rainfall areas or cold climates. Approximately 25 percent of owner-operator herds.
System 3: Feed imported to extend lactation and for dry cows
- 80-89% of total feed is home grown feed. Approximately 40 percent of owner-operator herds.
System 4: Feed imported and used at both ends of lactation and for dry cows
- 70-79% of total feed is home grown feed. Approximately 20 percent of owner-operator herds.
System 5: Imported feed used all year
- 50-69% of total feed is home grown feed, though could be less than 50% in some cases. Approximately 10 percent of owner-operator herds.
This publication makes reference to low, medium and high input systems. These are defined as:
Low: system 1 and system 2,
Medium: system 3,
High: system 4 and system 5.
2.8 Operating Profit Adjustments
Non-cash adjustments for resources used but not accounted for by cash income or expenditure are made when calculating the operating profit. A summary of these adjustments is shown below. For more detail refer to the DairyBase® Operating Profit Adjustments document. The value of change in dairy livestock numbers is calculated and added to net dairy cash income to form gross farm revenue. Note: this is the value due to change in livestock numbers. The reason for this adjustment is that the revenue from net dairy cash income can be affected by decisions to change the herd size due to adverse events. For example, in drought years more stock are sold and therefore revenue through net livestock sales will be considerably higher. Similarly, in years following a drought livestock will be purchased to increase numbers to a more normal level. The adjustment offsets these changes with a value for change in livestock on hand.
The value of change in dairy livestock is calculated as follows: closing less opening livestock numbers, valued at closing herd scheme values (Inland Revenue).
Labour adjustment – comprising two components: unpaid management based on the size of the herd and time worked, and unpaid labour valued at a market hourly rate.
Feed inventory adjustment – closing less opening supplementary feed on hand, valued at a standard 34 cents per kilogram dry matter in 2018-19.
Owned support block adjustment – valued on an assessed regional market lease rate per hectare.
Depreciation – as recorded in the annual set of accounts.
2.9 Asset Values
DairyBase® calculates market values for land and buildings by using the most recent rateable valuations for each farm and adjusting these to 1 June 2018 and 1 June 2019 market values using sales data supplied by Quotable Value and REINZ plus discussions with regional real estate agents and valuers.
Opening and closing livestock values for each year are calculated using the Inland Revenue herd value scheme NAMV (National Average Market Values) for the appropriate age group of animals.
Plant, machinery and vehicle values are recorded at book value.
Off-farm assets and investments are shown as market values.
2.10 GST
The financial data is GST exclusive as these transactions are neutral to the farm operation.