3 Physical Analysis
3.1 Introduction
The DairyNZ Economic Survey reports the trends in financial performance of dairy farms but not all the trends in physical performance. While not presented, there are key physical indicators of milk production such as days in milk, cow condition, reproductive performance, soil fertility, and fertiliser use data available from DairyBase®. It is the combination of the physical performance of the farm reflected through milksolids production, the cost of production and milk prices that drives the financial results.
3.2 Rainfall Summary
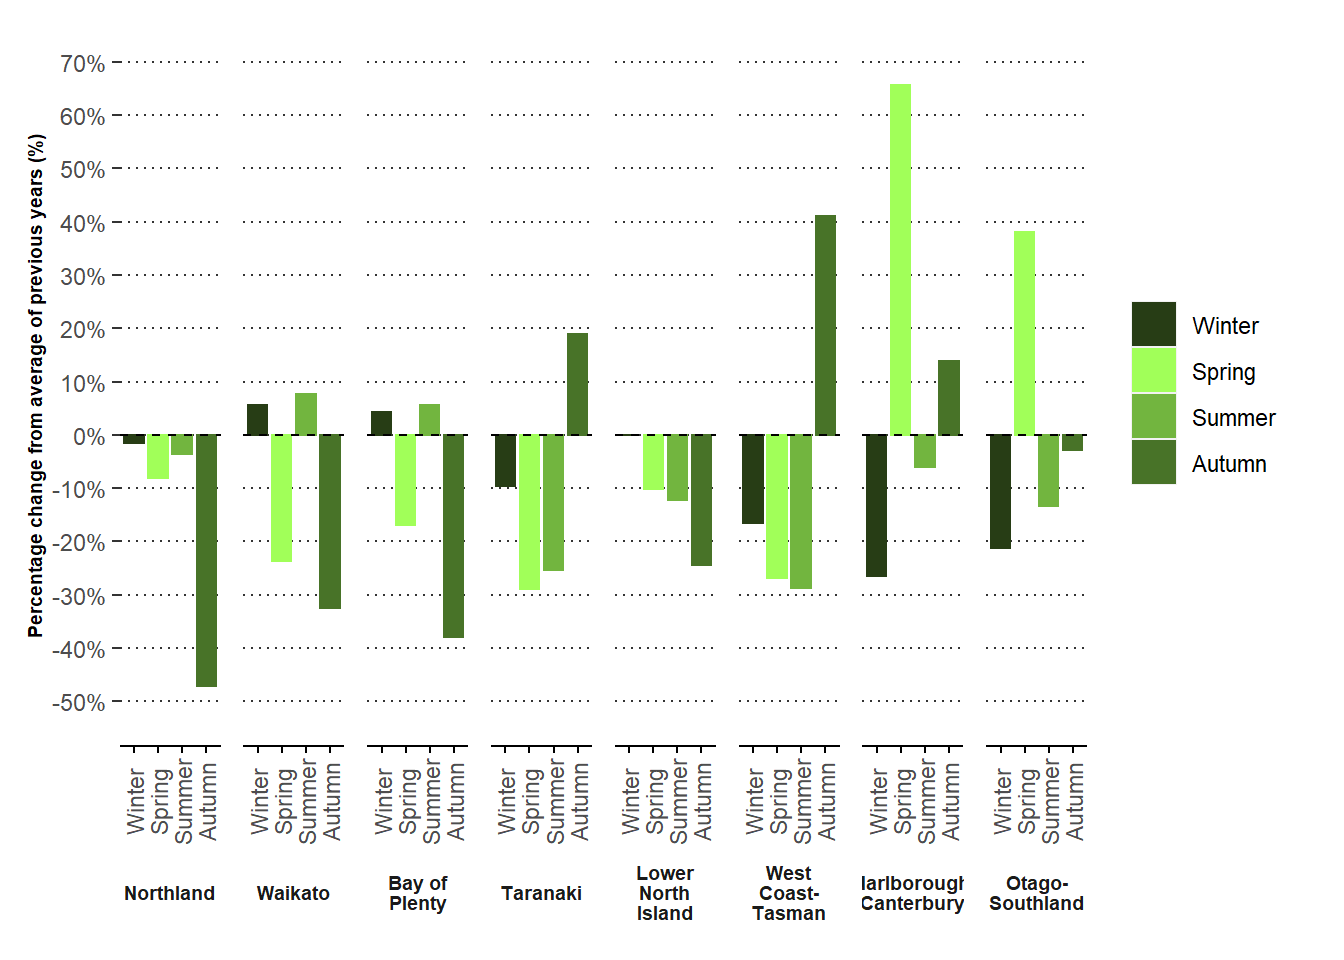
NIWA supplies daily climate data for various points across New Zealand with their Virtual Climate Station Network. These data are collated into district-level averages for each month, weighted for areas where more farms are located. Within each region, mean rainfall for the October to December (spring), January to March (summer), April to June (autumn) and July to September (winter) periods was calculated. The variation in the mean regional rainfall from ten-year-weighted averages is shown in Figure 3.1. Overall, New Zealand experienced a drier year than the ten-year average. Marlborough-Canterbury and Otago-Southland had a wetter spring than recent years. The North Island regions, with the exception of Taranaki, experienced a drier than normal autumn.
Figure 3.1: Variation in rainfall
3.3 Feed Use
Pasture and crop eaten, grazing off farm, and imported feed were estimated from DairyBase data. Pasture eaten has been relatively constant for the last decade while grazing off farm has tended to increase slowly. Imported supplements have shown more variation from year to year as farmers adjust behaviour on-farm in response to volatility in milk prices and seasonal conditions, though costs have trended upwards (Figure 3.2).
Increases in milk production have occurred from increased feed levels, particularly palm kernel extract (PKE), maize silage and in recent years fodder beet. In 2018-19, grazing off accounted for approximately 6 percent of total feed eaten, imported supplement (14%) and pasture and crops (80%) are the primary feed components in the diet of dairy cows.
Figure 3.2: Trends in feed use
3.4 Partial Productivity
Milk production on the average Economic Survey dairy farm increased 5 percent (kg MS per cow) in 2018-19 to 395 kilograms milksolids. Figure 3.3 and 3.4 show that milk production per cow and per hectare both increased from last season.
Figure 3.3: Milksolids production per cow
Figure 3.4: Milksolids production per hectare
Since 1990 the number of peak cows milked per full time equivalent (FTE) labour unit has increased from 83 to 146, a rate of about 2.5 additional cows per year. The increased use of technology, large South Island dairy herds and labour-saving techniques have driven this trend. In 2018-19, the number of cows per FTE decreased slightly to 146 from the previous season, refer to Figure 3.5.
Figure 3.5: Cows per FTE
3.5 Profit from Productivity
Productivity improvements over time are essential to sustain or grow business profits and therefore to compete successfully with alternative uses for resources. DairyNZ has developed a measure for productivity based on operating profits. Operating profit from productivity (PFP) is defined as the difference between actual operating profit and the operating profit that would have occurred with no productivity changes since a base year (i.e. in the absence of milksolids production increases and with operating expenses per kilogram milksolids increasing annually at the rate of dairy farm input price inflation), see Figure 3.6. In essence, PFP is a measure of cost-efficient milksolids production increases since the base year valued at the end of year operating profit margin per kilogram milksolids. It excludes the cost of capital, although depreciation and changes in hectares are accounted for. The three main contributory components of PFP are milksolids production increases since the base year, operating expenses savings in inflation adjusted terms since the base year, and end year operating profit per kilogram milksolids (influenced by milk prices). DairyNZ and dairy farmers must increasingly focus on achieving cost-efficient milksolids production and PFP provides a means for monitoring the value of productivity gains over time.
PFP increased from $614 per hectare in 2017-18 to $810 in 2018-19 (1998-99 base year PFP = $0/ha). Figure 3.6 shows the gains made in PFP were relatively steady from 1990-91 to 2006-07. However, sharper fluctuations in both milk prices and seasonal rainfall have caused PFP to be more volatile since.
Figure 3.6: Profit from Productivity: Gains from 98/99