Section 1 Getting started with R

Artwork by @allison_horst
1.1 Installing R
R, on its own, is basically just a command-line: you send it commands and it sends back output. It comes with a “GUI” (graphical user interface), but it’s pretty ugly and I wouldn’t recommend it.
To install R, go to the CRAN website and click the download link for either Windows or Mac OS X.
1.1.1 Windows instructions
- Click Download R for Windows
- Click
"base", and download. - Run the installer and install - you shouldn’t need to change any of the options.
1.1.2 Mac OS X instructions
- Click Download R for (Mac) OS X
- Download the
.pkgfile for the latest release - Open the installer and go through it:
- “Install for all users” (the default) should be fine (if you have install rights on your machine)
1.2 Installing RStudio
It’s best to work with R through RStudio: it’s a nice interface that makes it easy to save and run scripts, and see all the output and plots presented in the same window.
Head to the RStudio website to download the free version of RStudio Desktop: the free version is 100% fine and isn’t missing any important features.
1.2.1 Mac OS X notes
RStudio offers to install some “command line tools” the first time you
open it - go ahead and install them. You won’t need them right now
but they do contain some useful tools like git.
1.3 Running RStudio
Open up RStudio and you should see the standard 4-pane layout:
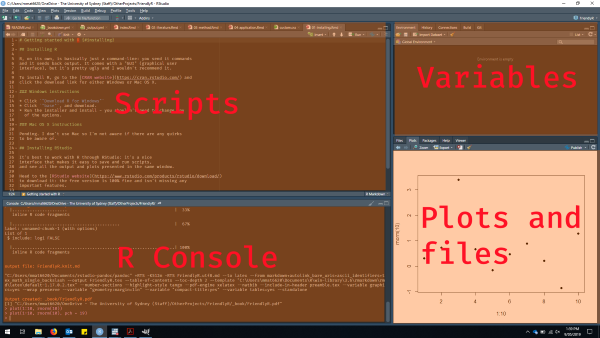
This may look like information overload at first, but most of the time, you’ll just be looking at the “Scripts” section where you’ve written your code.
Optional: Go to Tools -> Global options -> Appearance and switch to a dark theme - it’s easier on the eyes and it looks cool.
You should now be able to run your first R command
by clicking in the console and typing 1 + 1 and hitting
<Enter>:
## [1] 2Or for something a bit more interesting, copy and paste these lines into the console and hit <Enter>:
plot(iris$Petal.Length, iris$Petal.Width,
     xlab = "Length", ylab = "Width",
     main = "Petals of different flower species",
     col = c("green", "purple", "orange")[iris$Species],
     pch = 16)
Don’t worry if this code looks a bit complicated: some of the default plots in R are ugly, and they need tweaking to look halfway presentable. We’ll see better ways to produce nice plots later.
1.4 Installing your first packages
A lot of the most useful tools in R come from third-party packages. Thankfully
they’re easy to install, through the install.packages() command. Try
installing the ggplot2 package (an excellent plotting package) to make
sure everything is working:
The install process should be automatic, and it will also install
other packages that ggplot2 needs. Just in case, you should check
the last few lines of the output that install.packages() produces,
and look for messages like:
package ‘ggplot2’ successfully unpacked and MD5 sums checked1.4.1 The tidyverse
This is Hadley.

Hadley Wickham
Hadley is your friend. As well as creating ggplot2, Hadley is the mastermind
behind the tidyverse, a set of R packages designed to make processing
and analysing your data easier, and to smooth out some of R’s quirks.
We’ll be using the tidyverse packages throughout this tutorial, so let’s
install them now:
This will install multiple packages, but again the process should be automatic.
1.4.2 The tidyverse in action
Now that we have some basic packages set up, let’s see what they can do for us:
# Load the ggplot2 library into our R session
library(ggplot2)

ggplot(iris, aes(x = Petal.Length, y = Petal.Width, colour = Species)) +
    geom_point(size = 3) +
    scale_colour_viridis_d() +
    labs(title = "A nicer looking plot",
         x = "Petal length", y = "Petal width") +
    theme_bw()
1.4.3 Installing other packages
As you try out different analyses and tasks in R, you’ll come across recommendations for other packages - there are no major drawbacks to trying them out, so feel free to install and have a look - there are some great packages out there.
However, it’s worth trying to keep the number of packages in a single analysis low to avoid overlap and keep things simple (you do also get occasional conflicts between packages where they don’t play nice with each other). If you’re loading a lot of packages in your analysis it’s worth checking if you can get rid of some of them.