2 Facility Information Example
2.1 RAM Pharma, Inc.
2.1.1 Table 1
Each 503B facility entry contains similar information. The first table contains information on location, registration, and some key information about facility size, sales estimates, and a head count estimate.
Sales and head count are derived from the Dun & Bradstreet company database, unless specific information about head count was available on a facilities website. Square footage was estimated based on Google Maps images.
| Facility | City | State | InitialRegistration | EstSales | FacilitySqFt | Employees |
|---|---|---|---|---|---|---|
| RAM Pharma, Inc. | Idaho Falls | ID | 2016-07-21 | 149000 | NA | 5 |
2.1.2 Table 2
The second table contains information including a facility size estimate, product specific information, and services offered. The column Product count represents the number of unique products reported by a facility in the years of 2019 and 2020. The column Competing is the number of those products that RAM/Compound Preferred has produced and reported in the past.
| Facility | EstFacilitySize | ProductCount | Competing | Services | 503A |
|---|---|---|---|---|---|
| RAM Pharma, Inc. | Small | 35 | 31 | Compounding | NA |
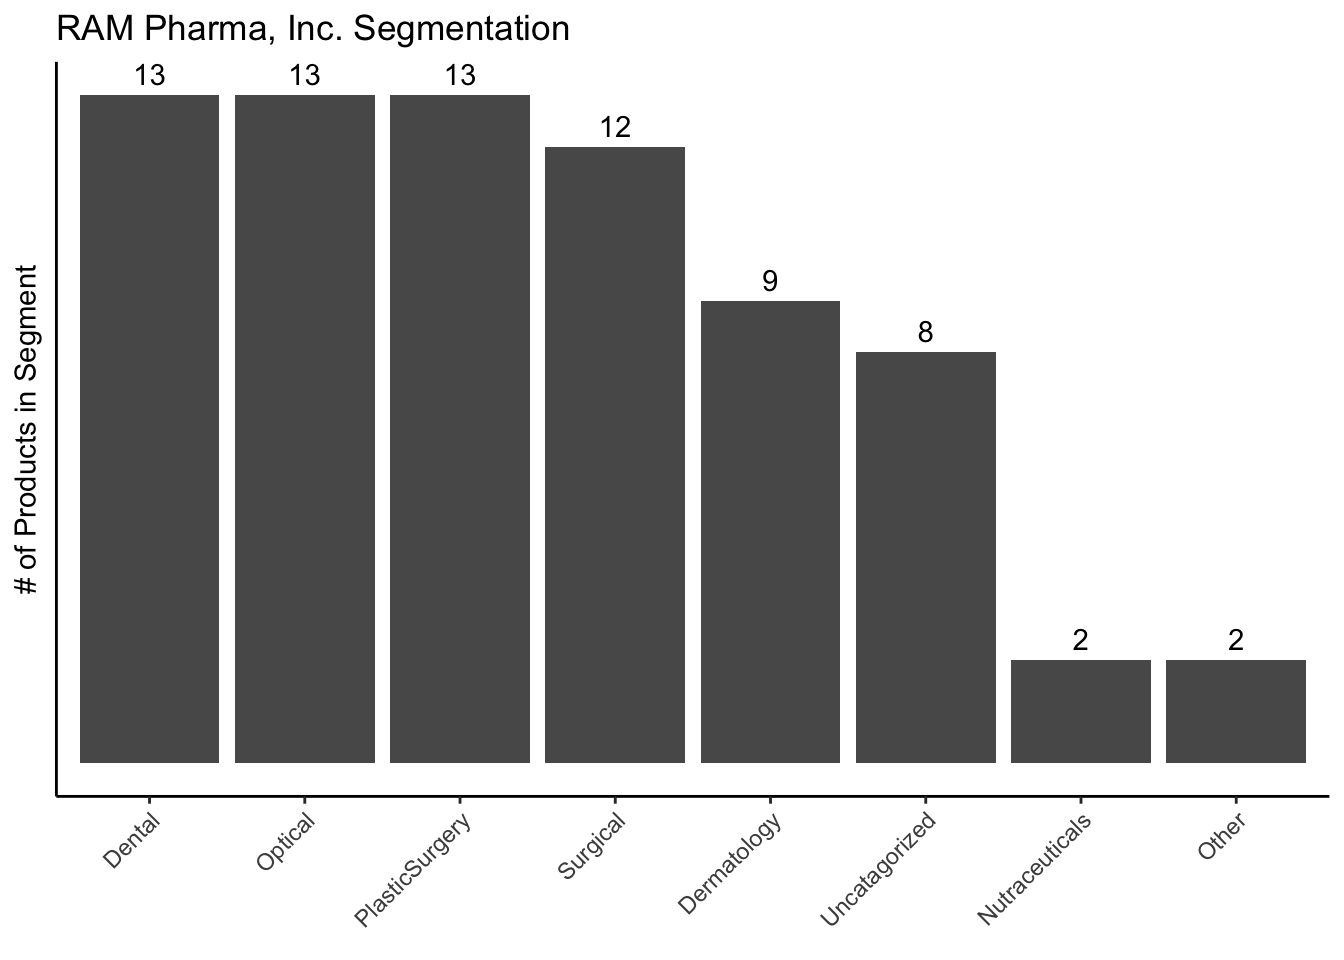
2.1.3 Segment Chart
The final graph that will appear on each facility page is a segmentation bar chart. This chart shows the number of products in each facilities product mix that fall into a particular segment.
For example, BLT Cream is categorized into two segments, Dental and PlasticSurgery. In the chart below, BLT Cream will be counted twice, once in Dental and once in PlasticSurgery.
If we wanted to know exactly which products made up the the PlasticSurgery segment for RAM, we could use the Segmentation Data Excel document.