2 Lake Water Quality Profiles
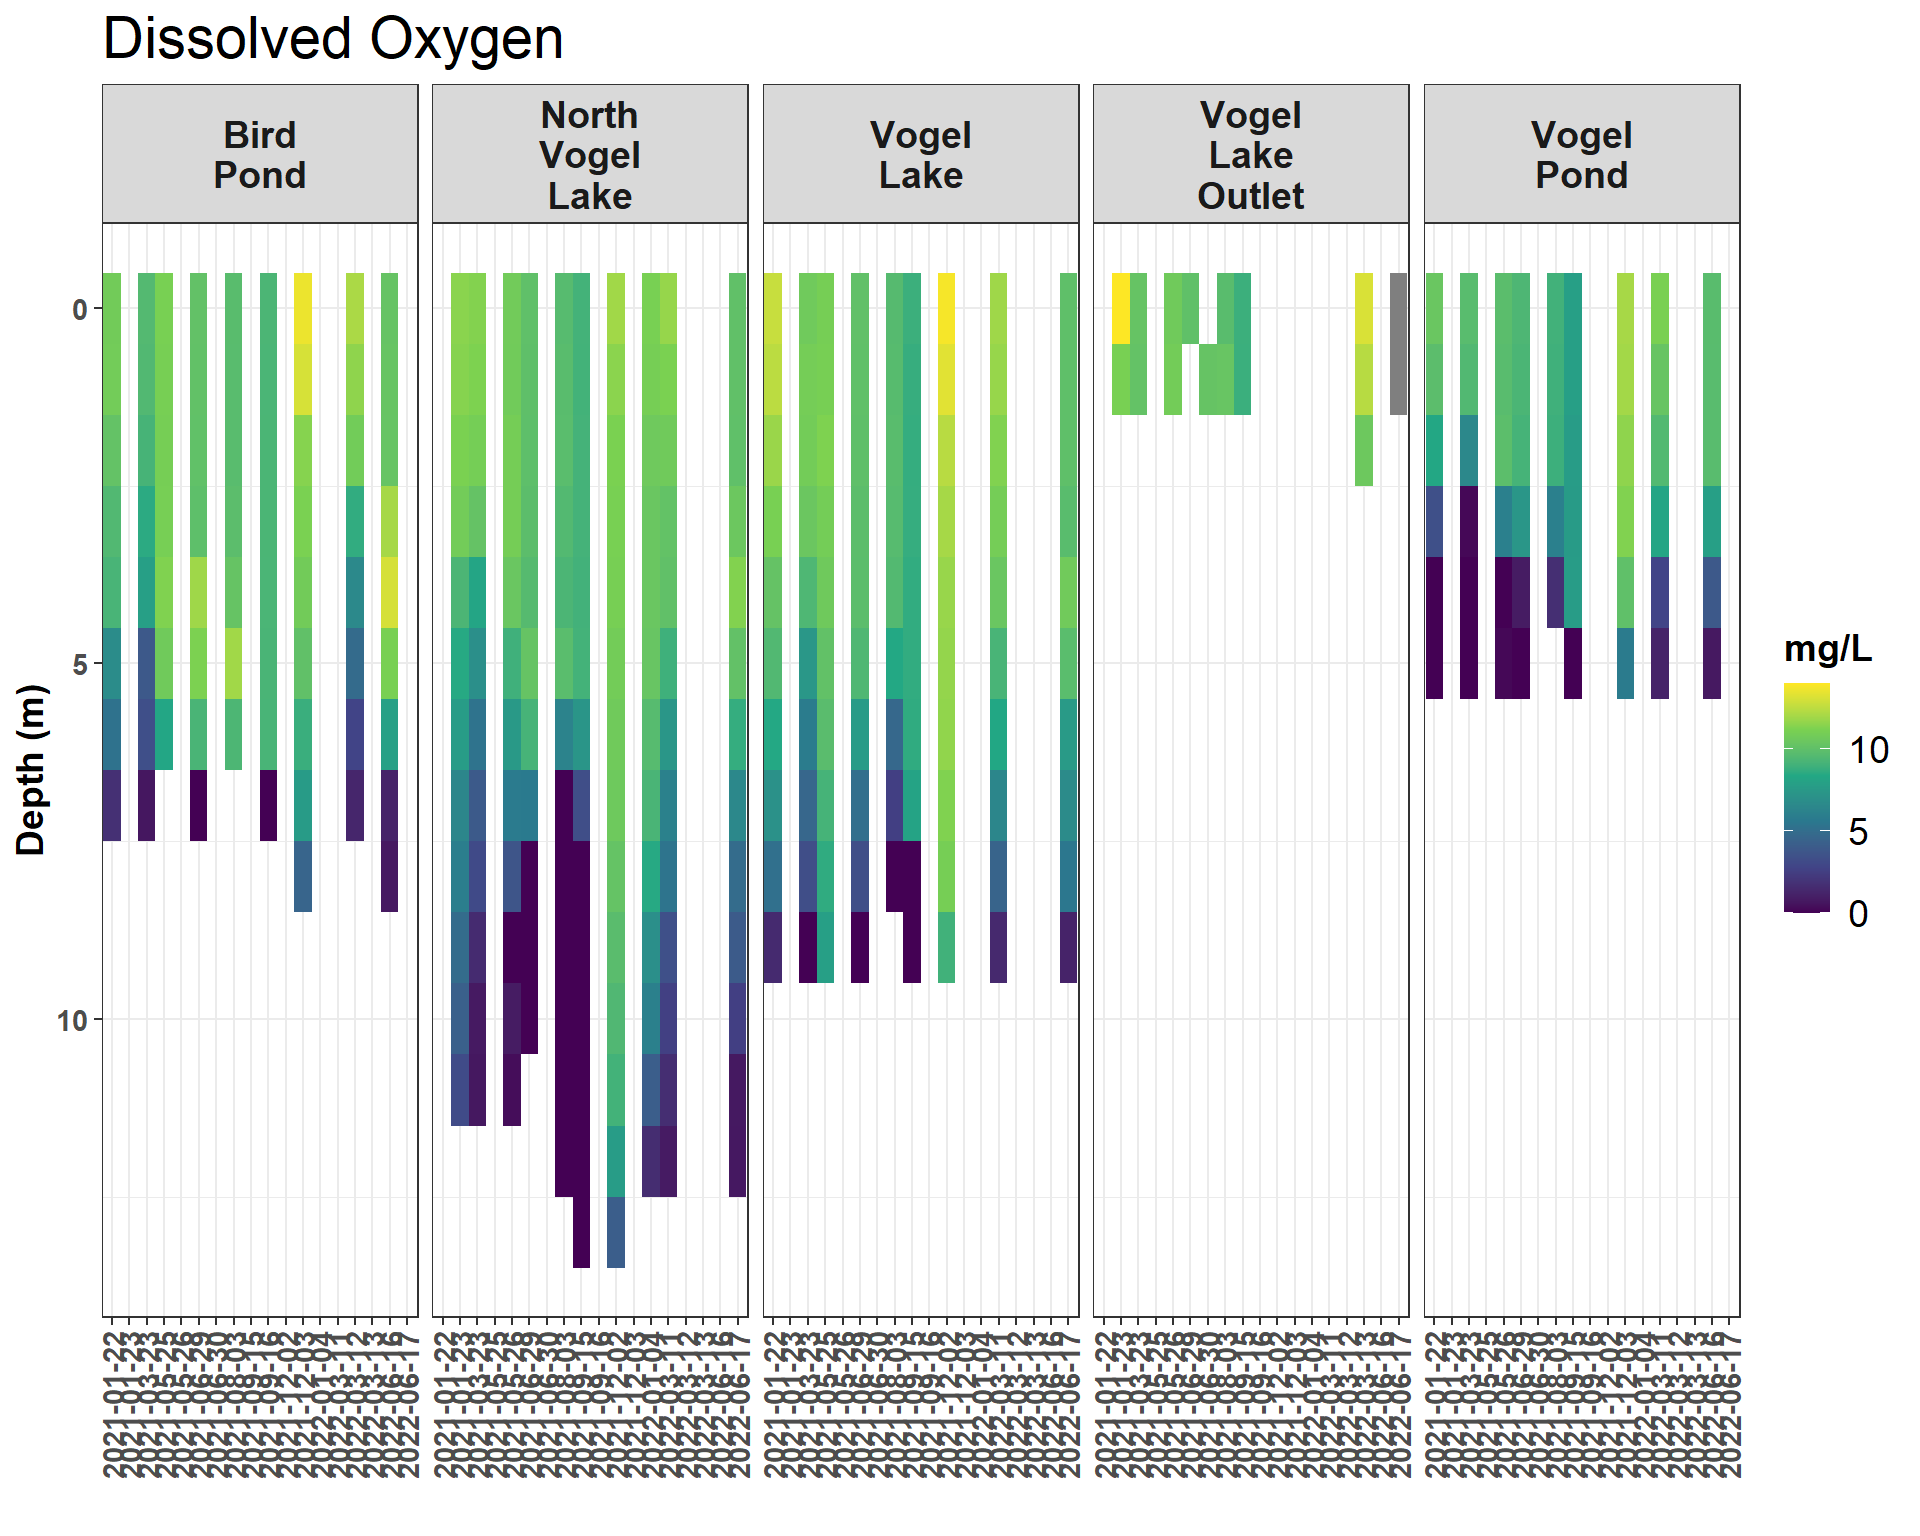
Lake water quality profiles were collected at generally 1-2 month intervals at five sites at 1 meter depth intervals. Hydrolab MS5 sondes were descended from an anchored boat centered over the deepest point of each lake, and parameter values were recorded from a handheld reader once stabilized after 30-60 seconds.
Raw water quality field data is stored in a Google Sheet that can be viewed at https://tinyurl.com/kwf-vogel-wqx-data.
Data visualizations are provided for each site visit here.
2.1 Data by Month
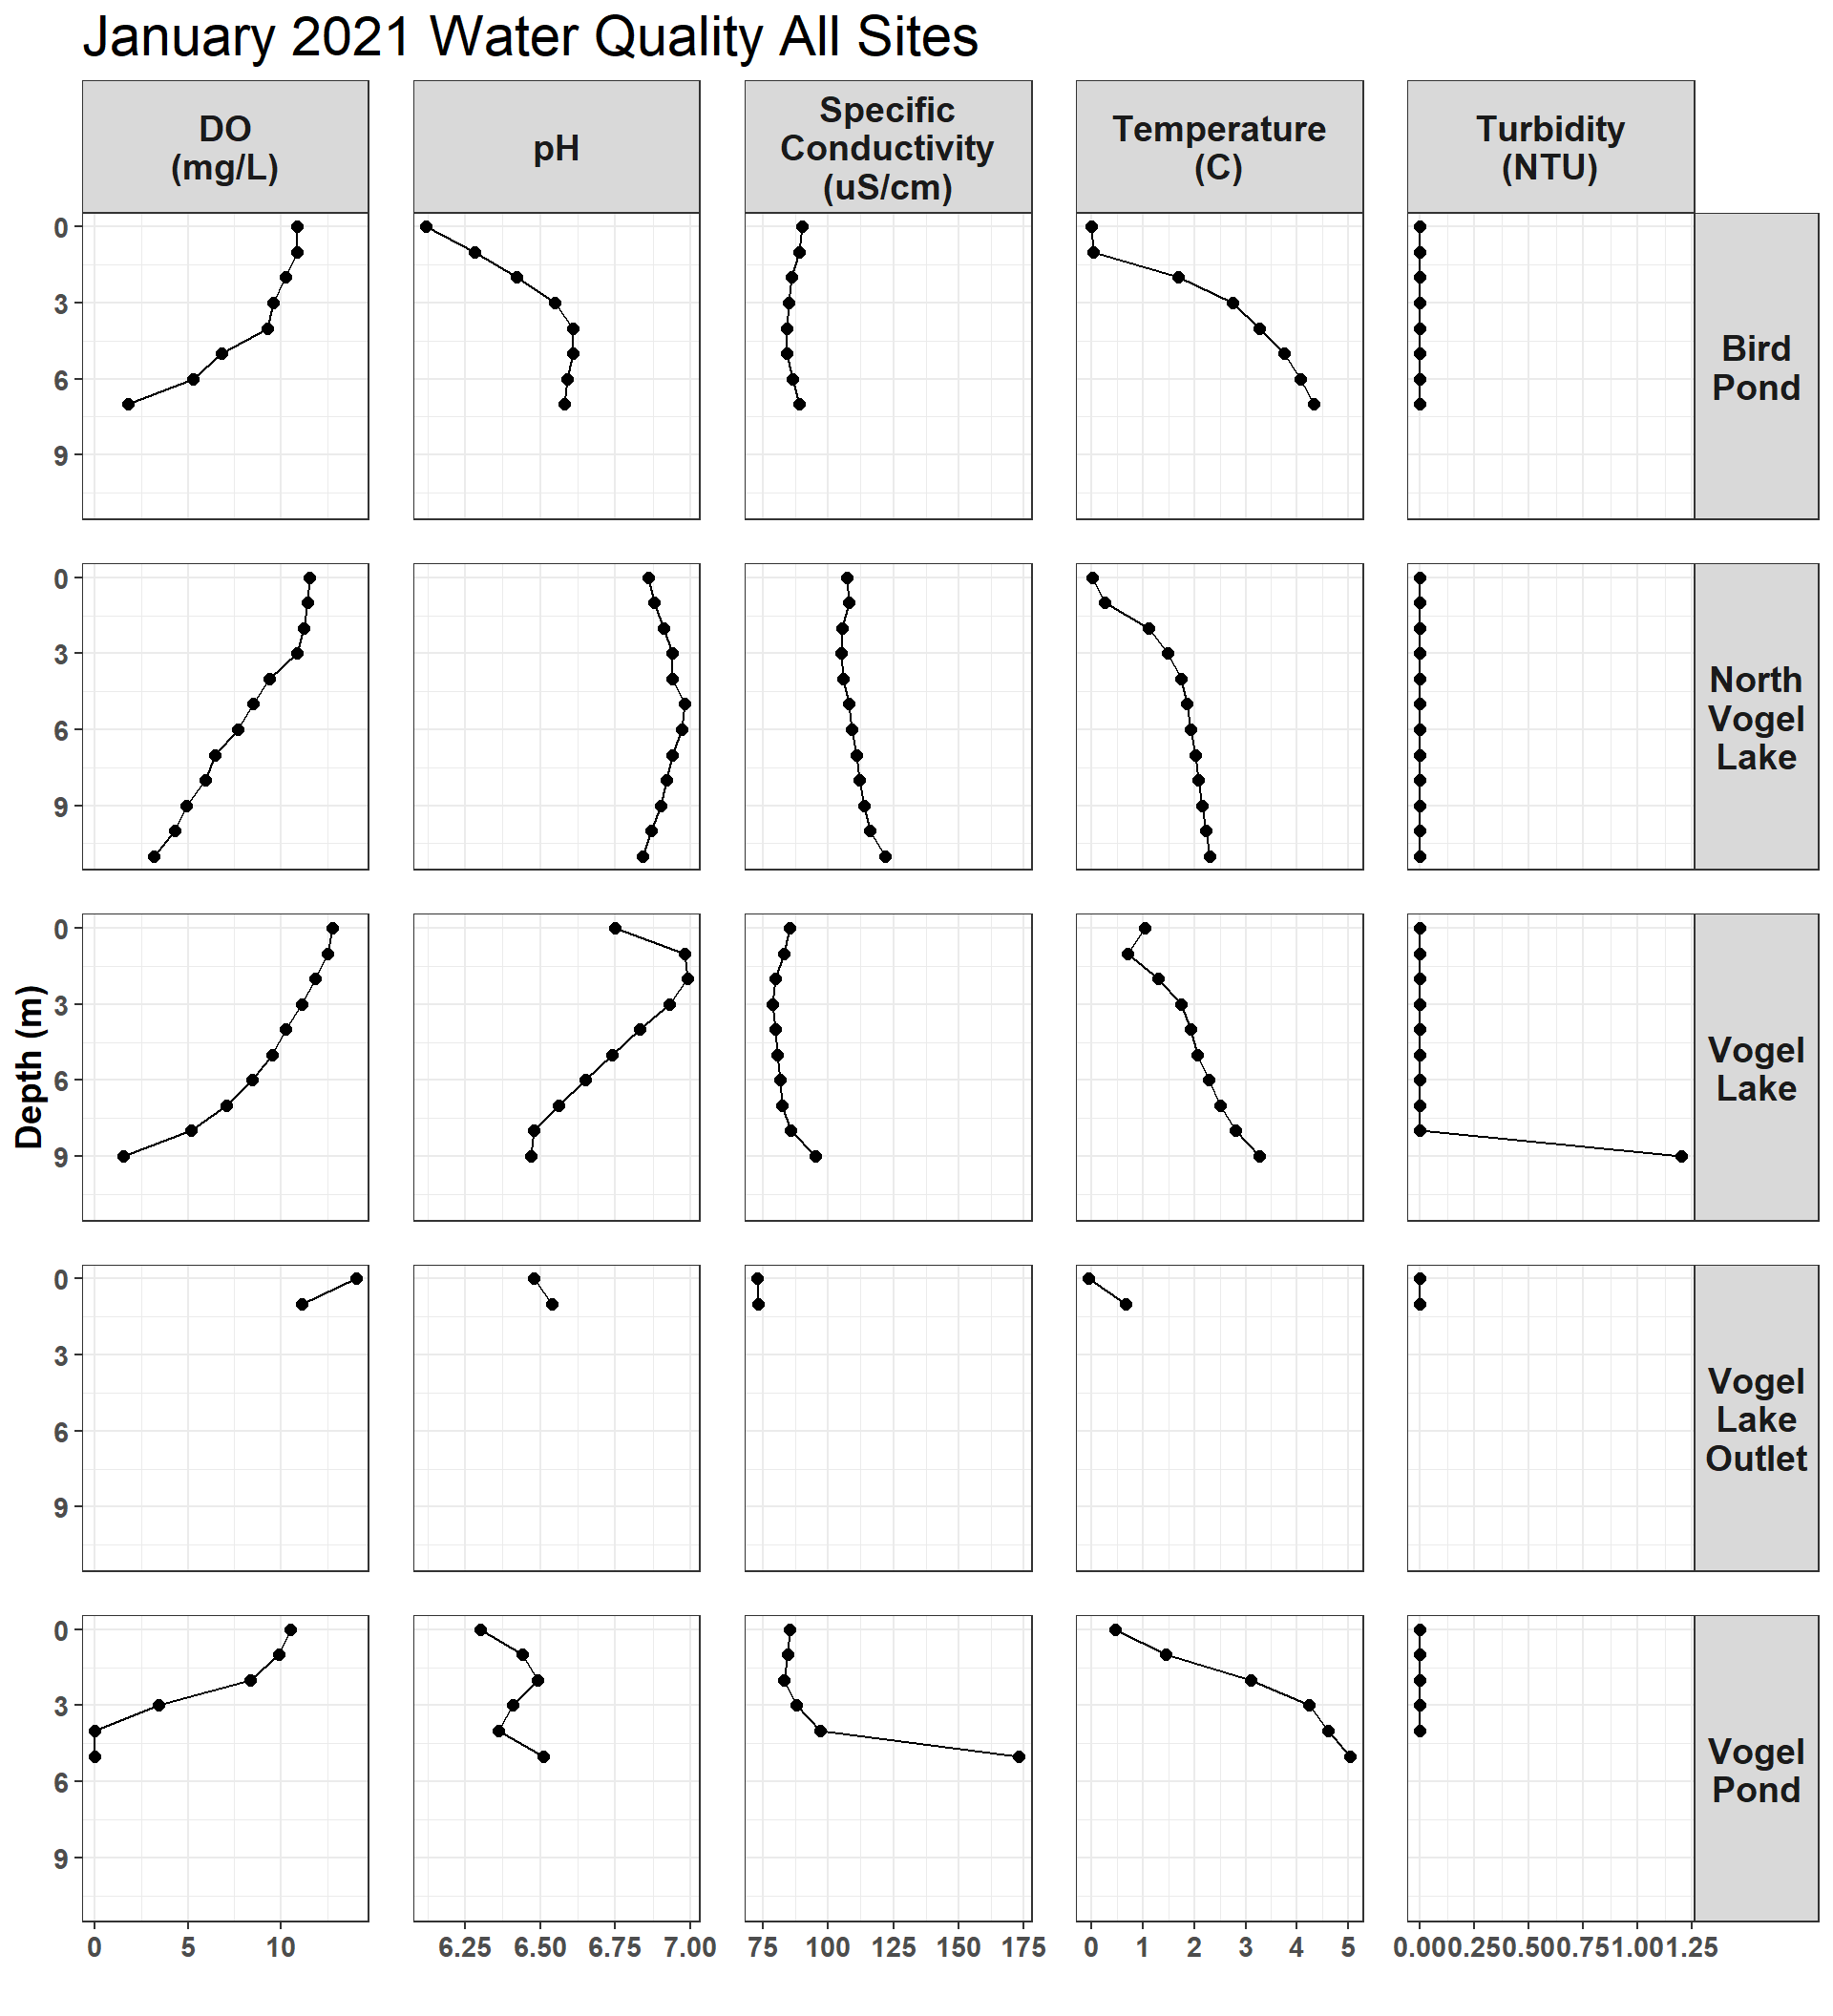
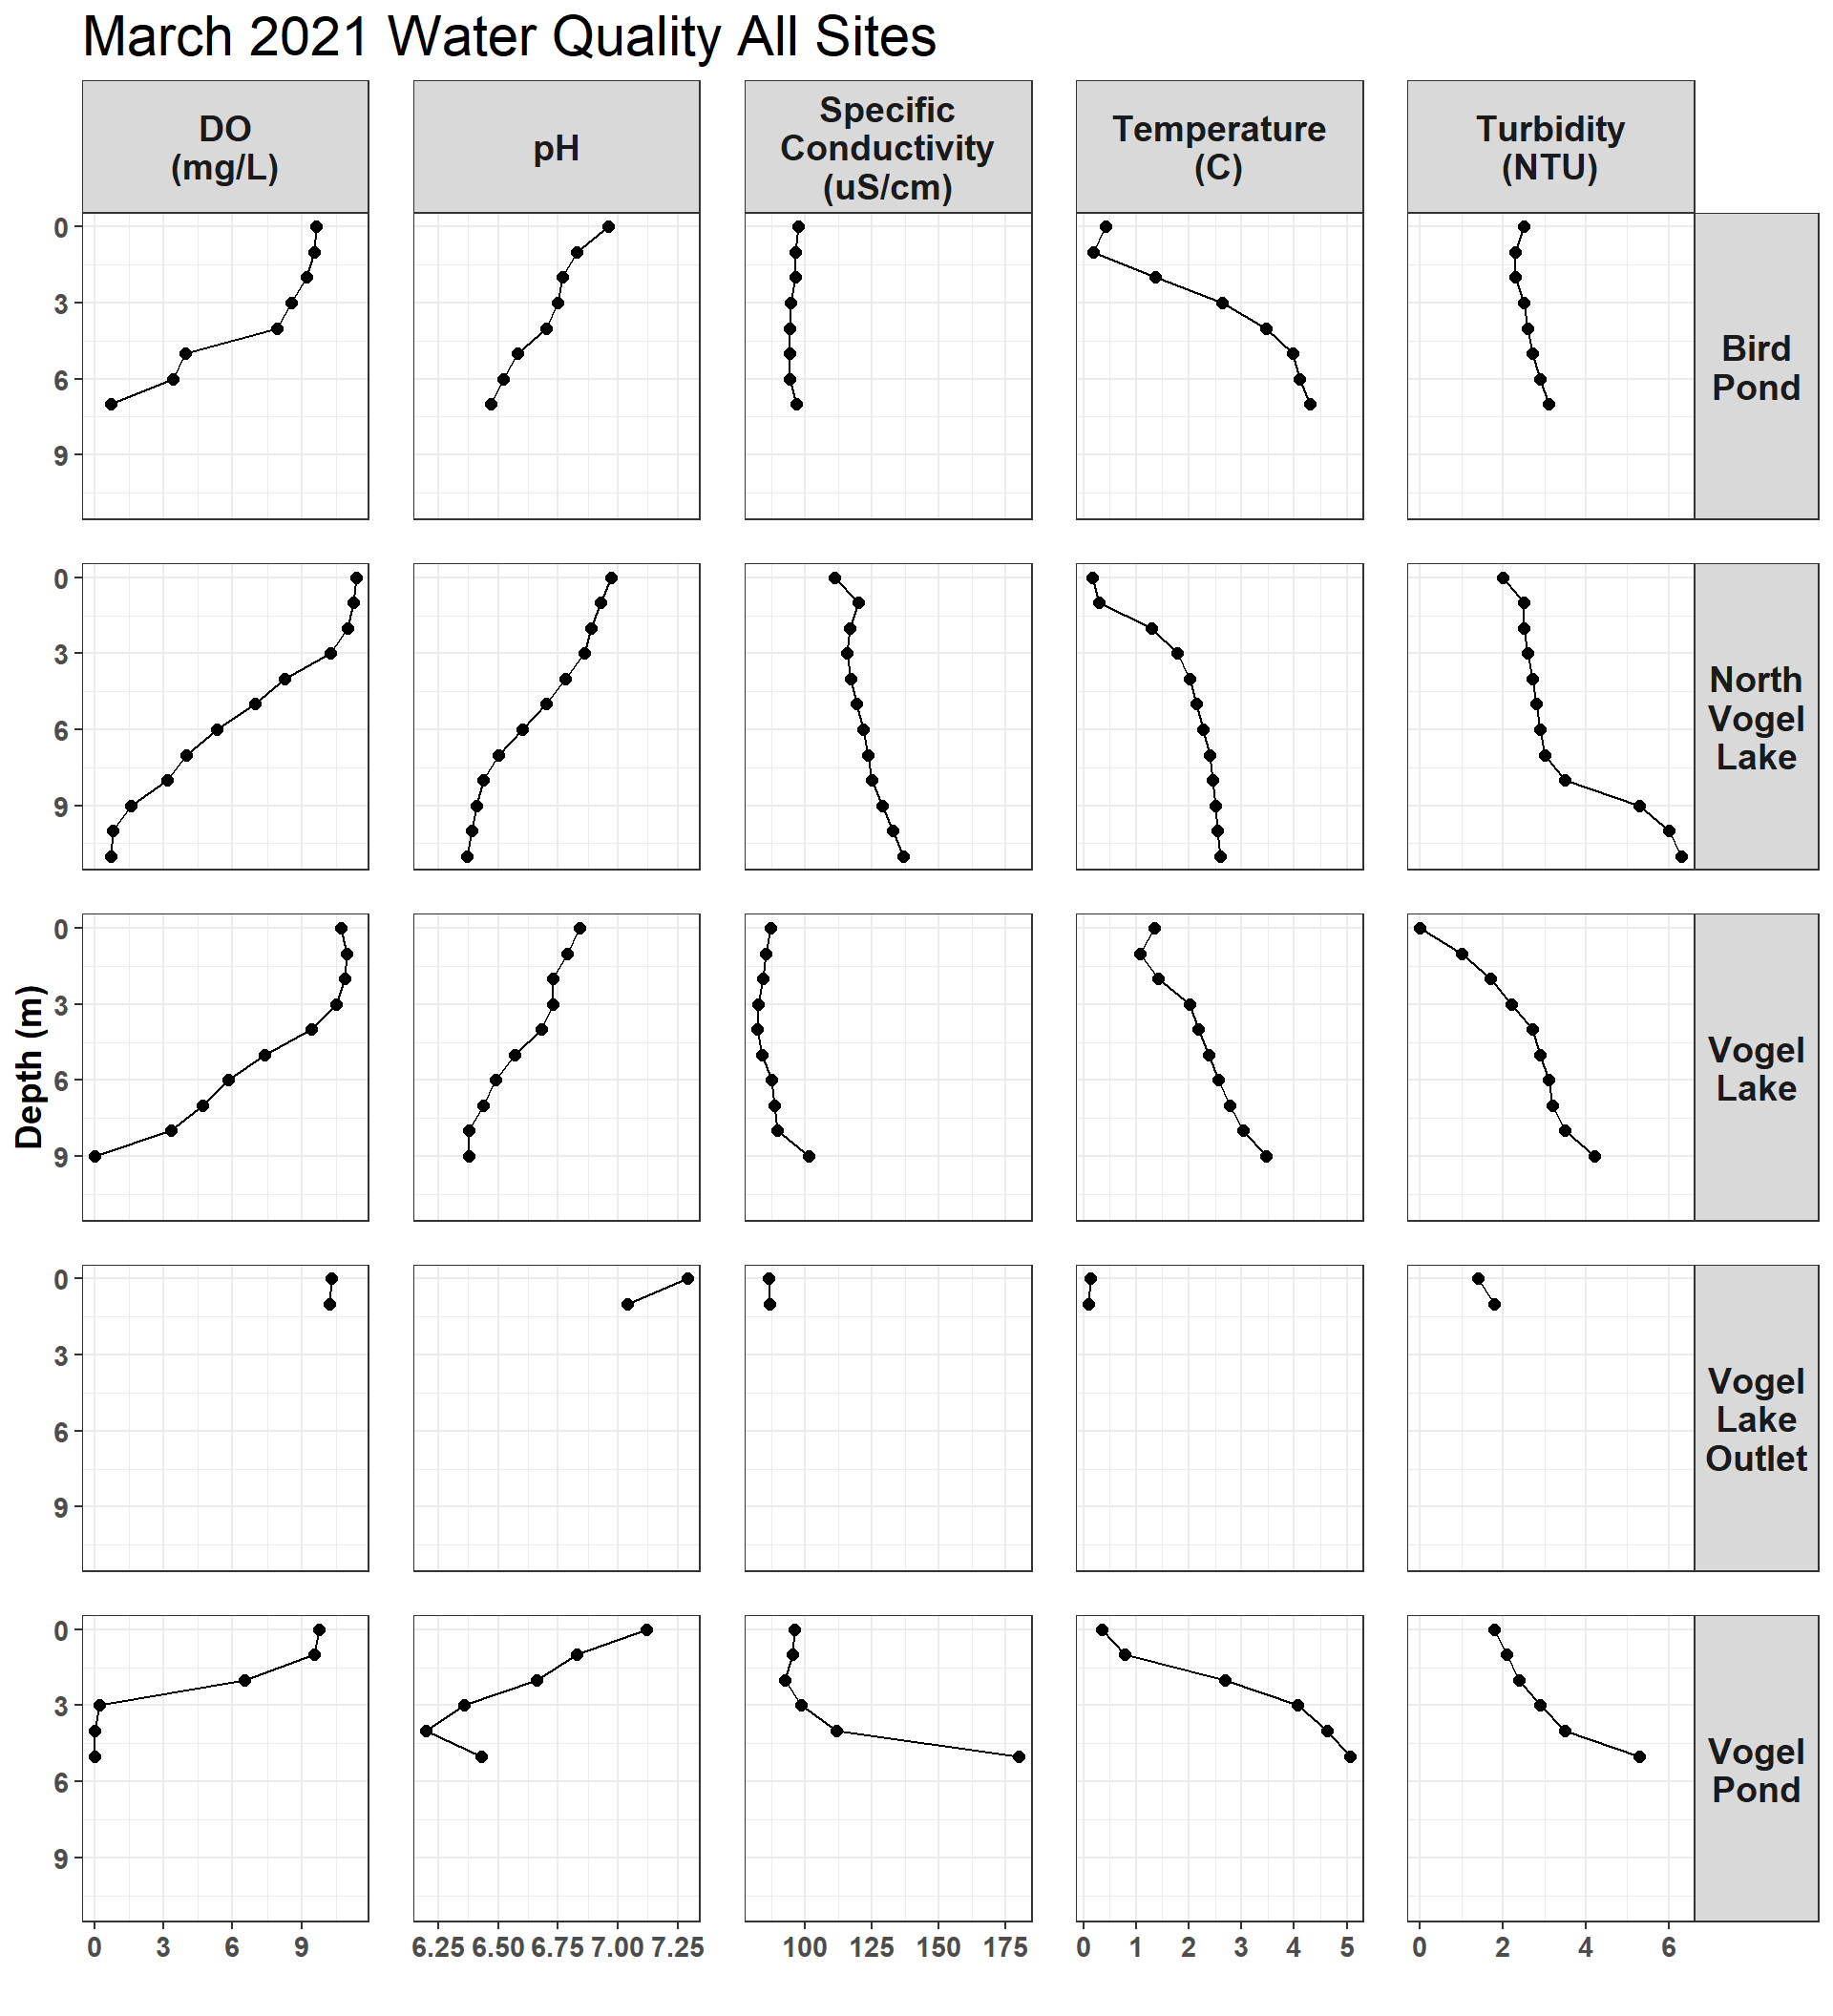
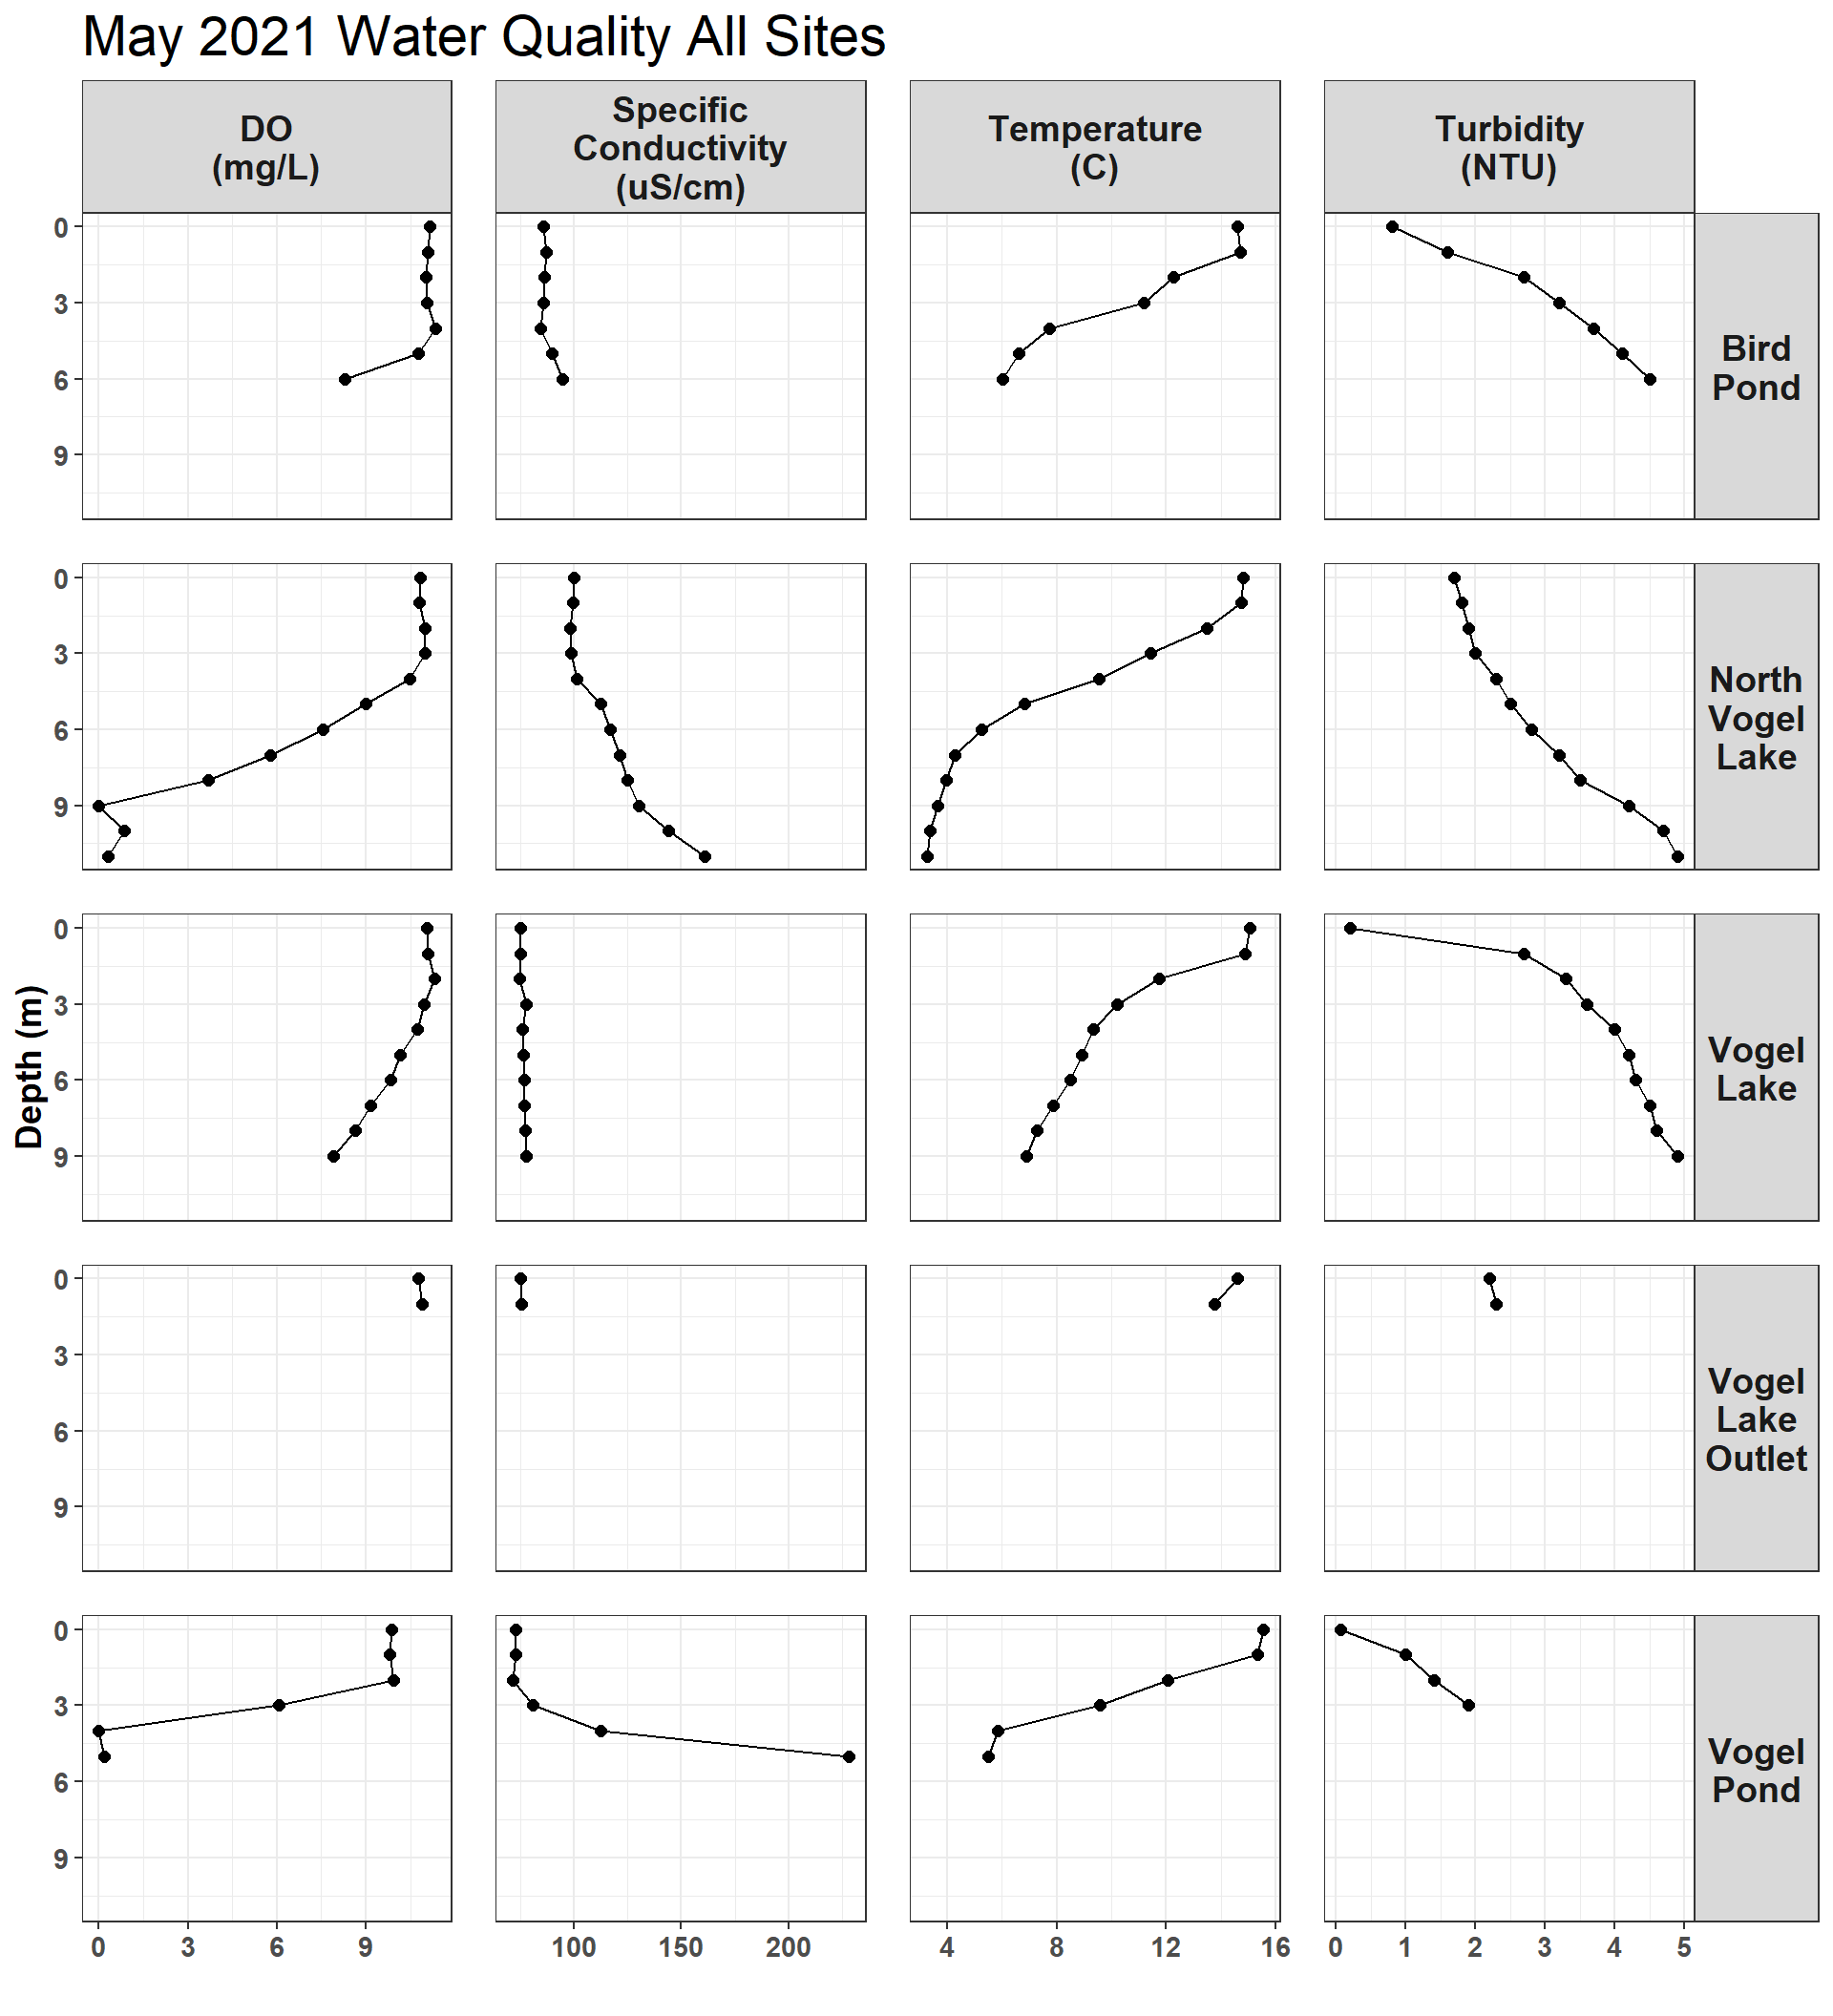
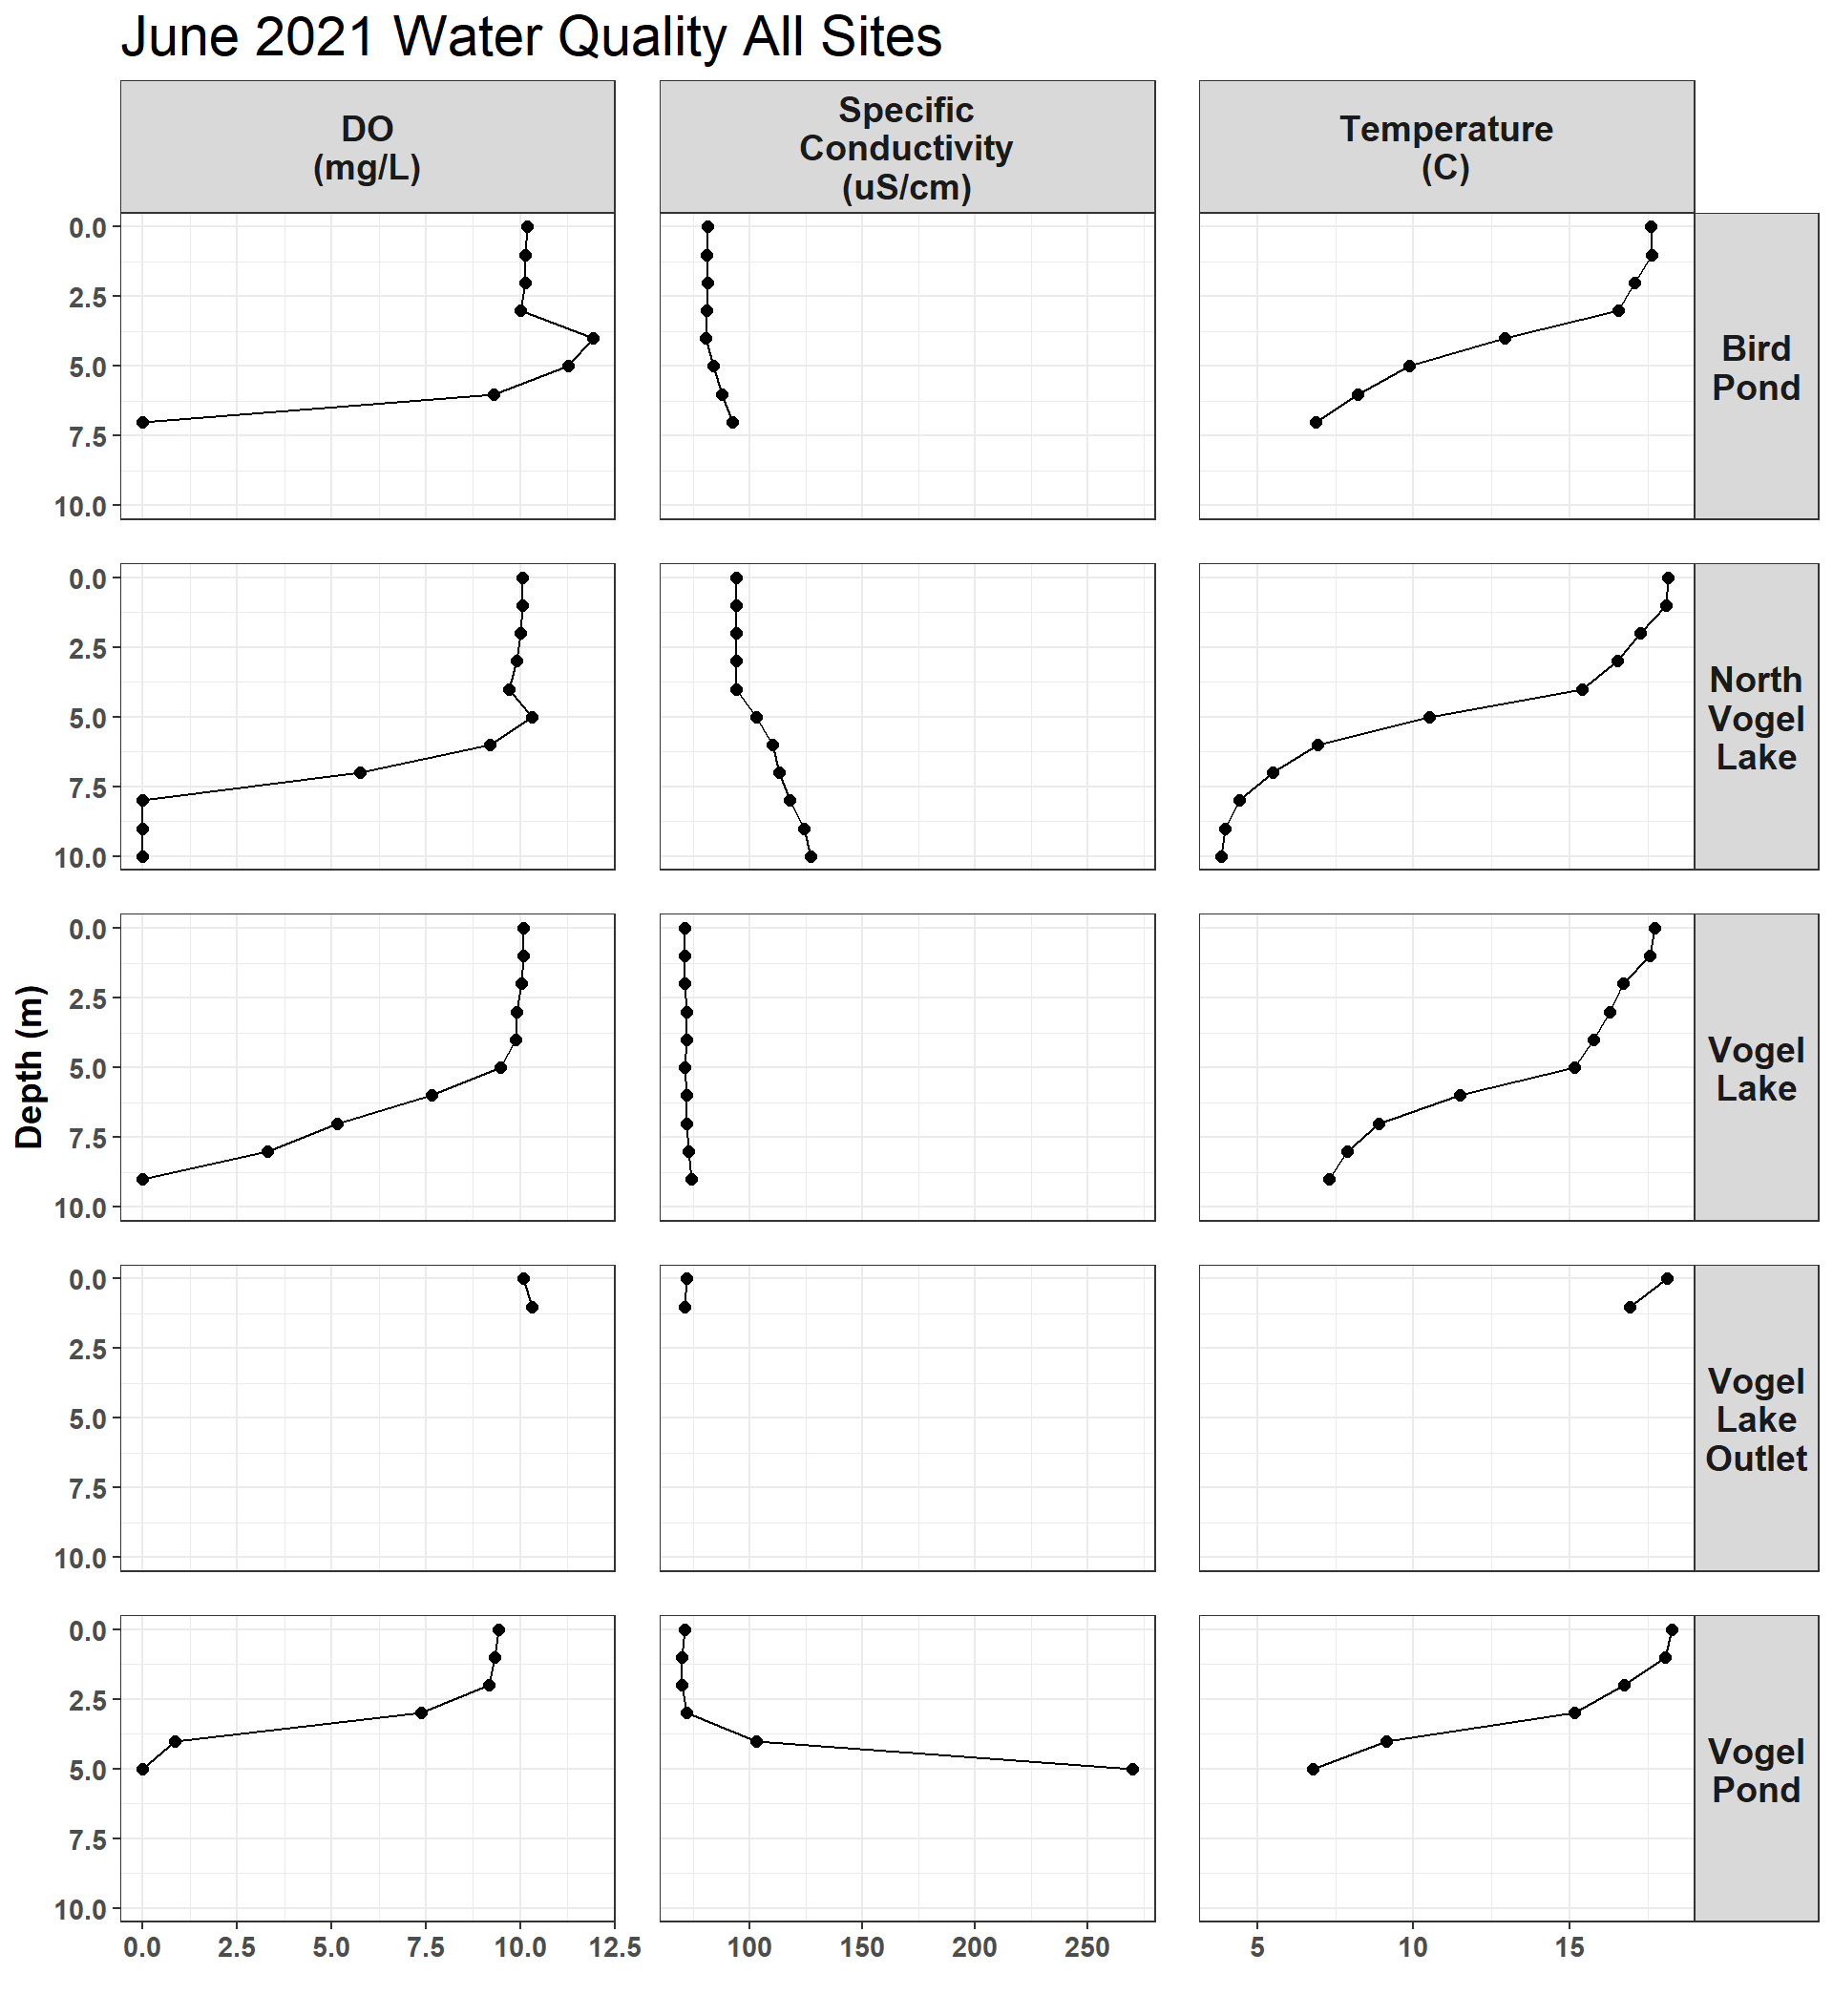
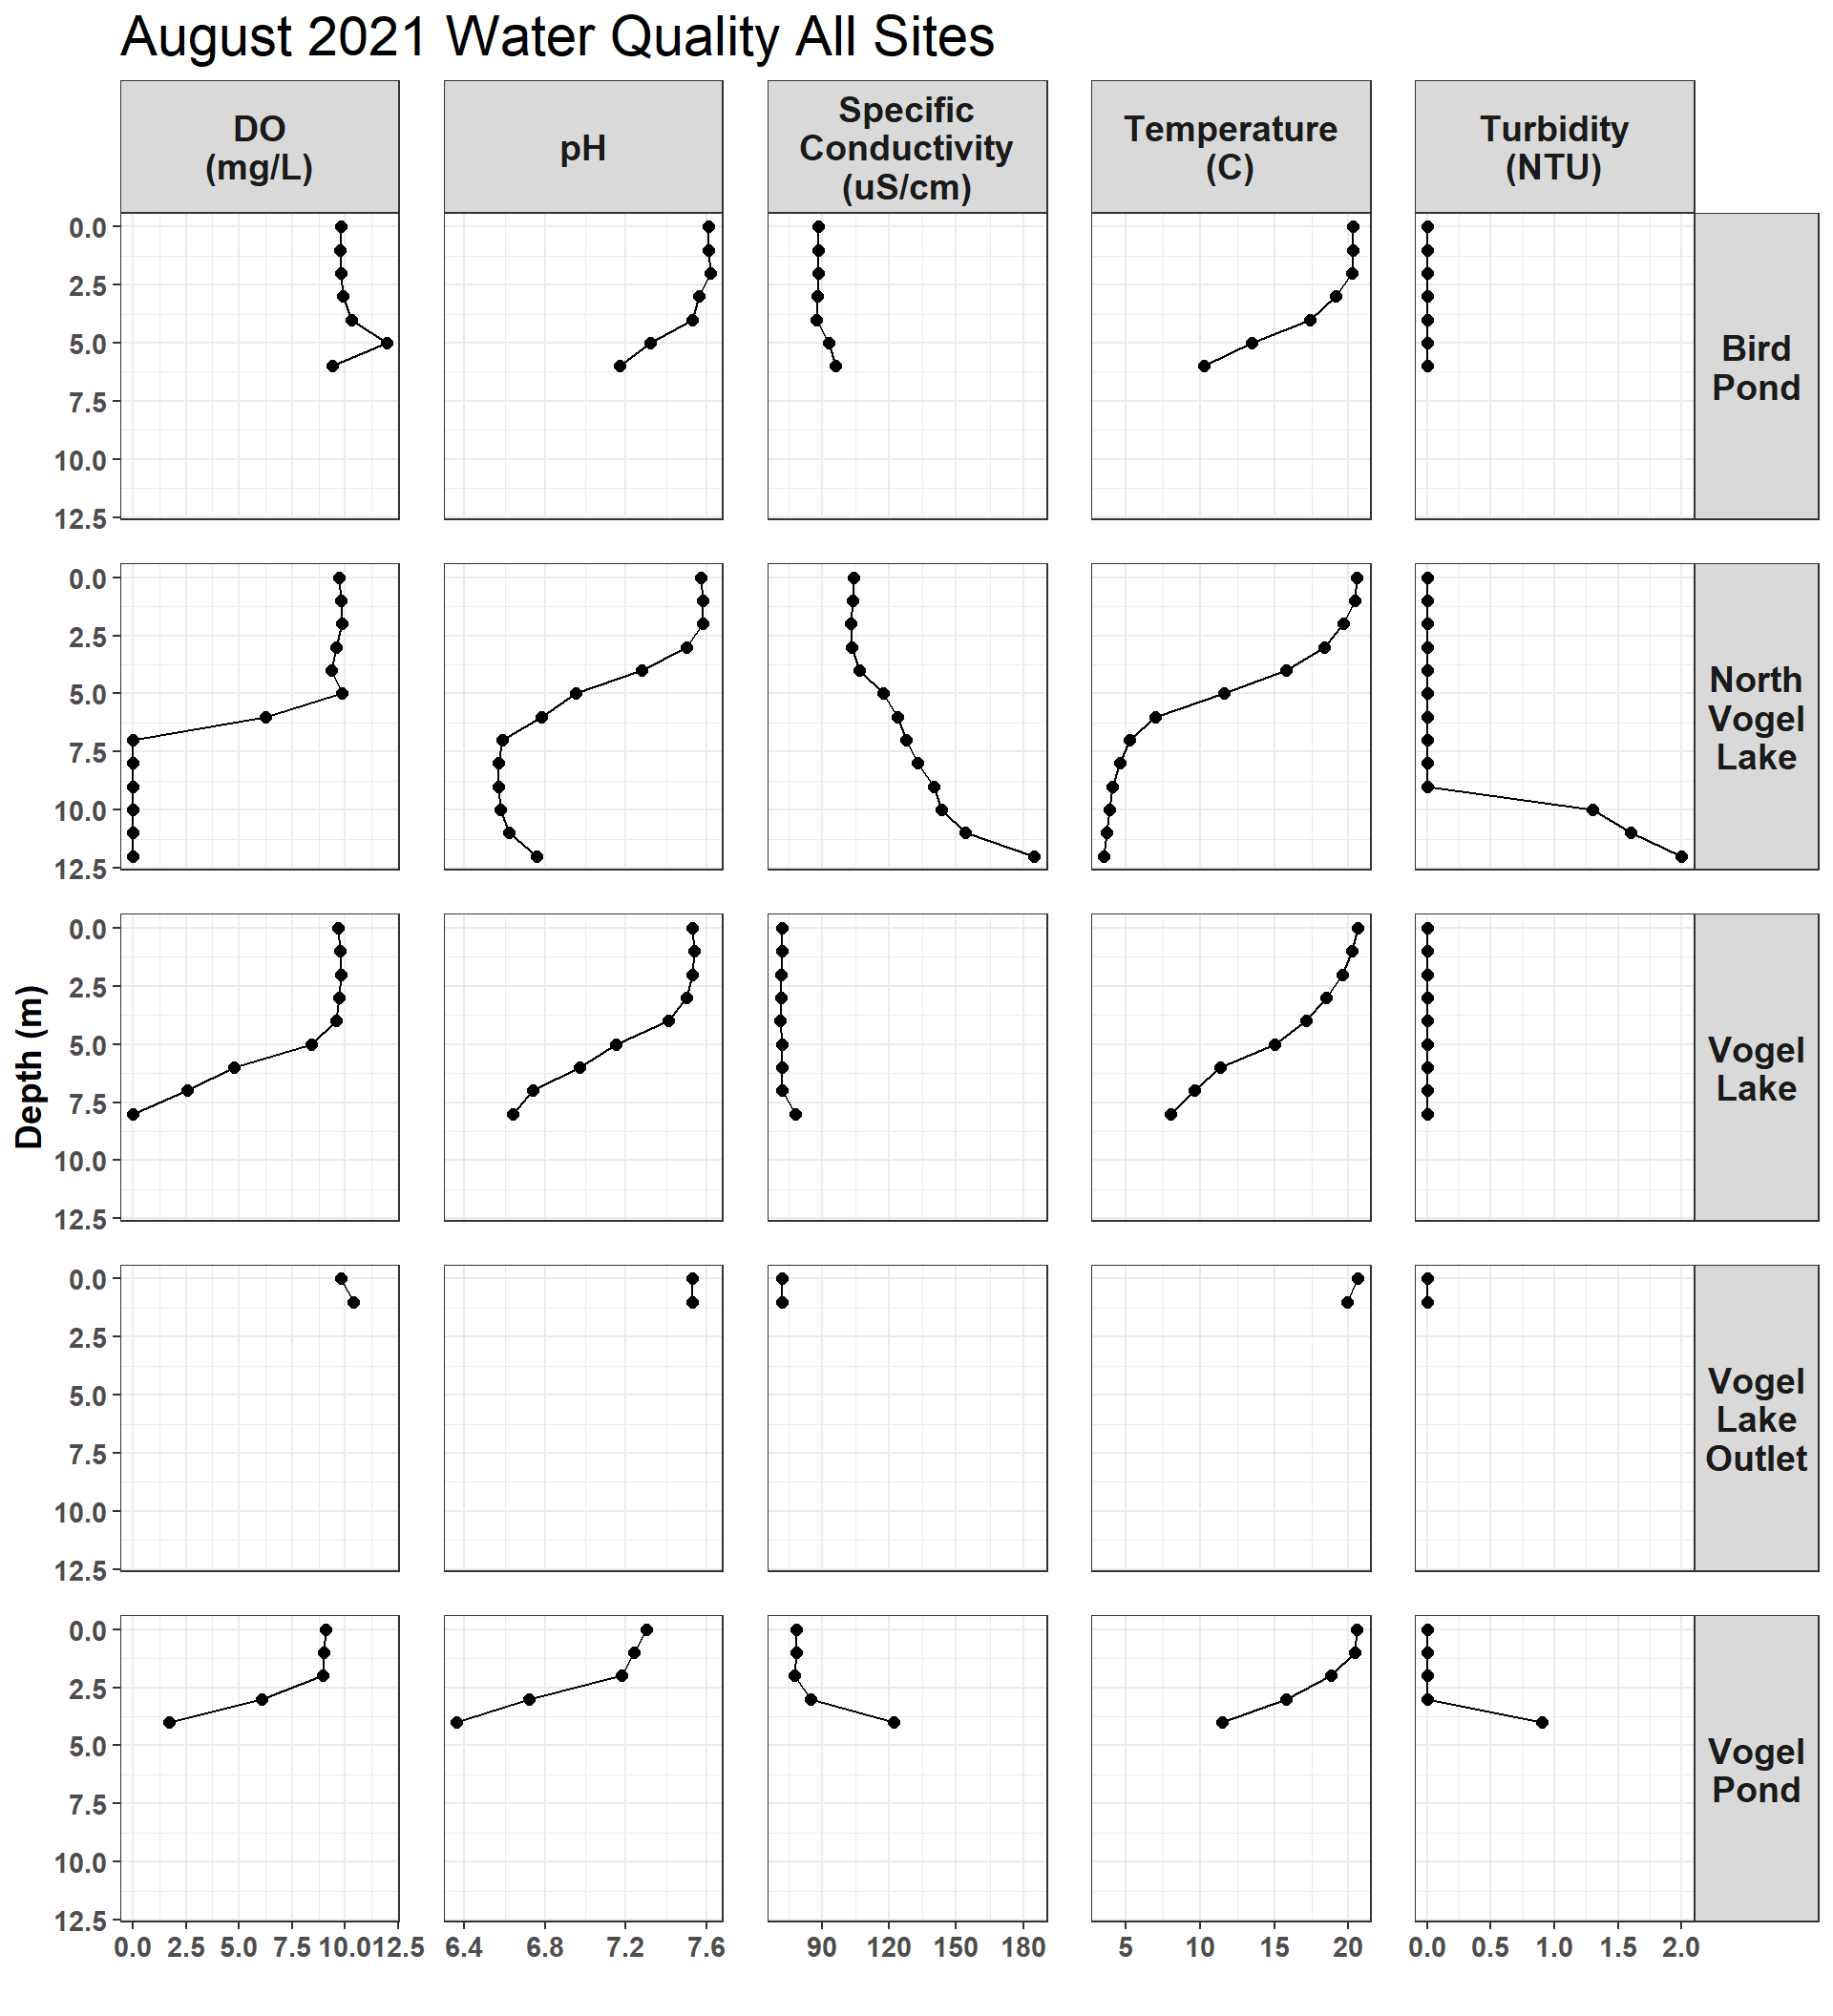
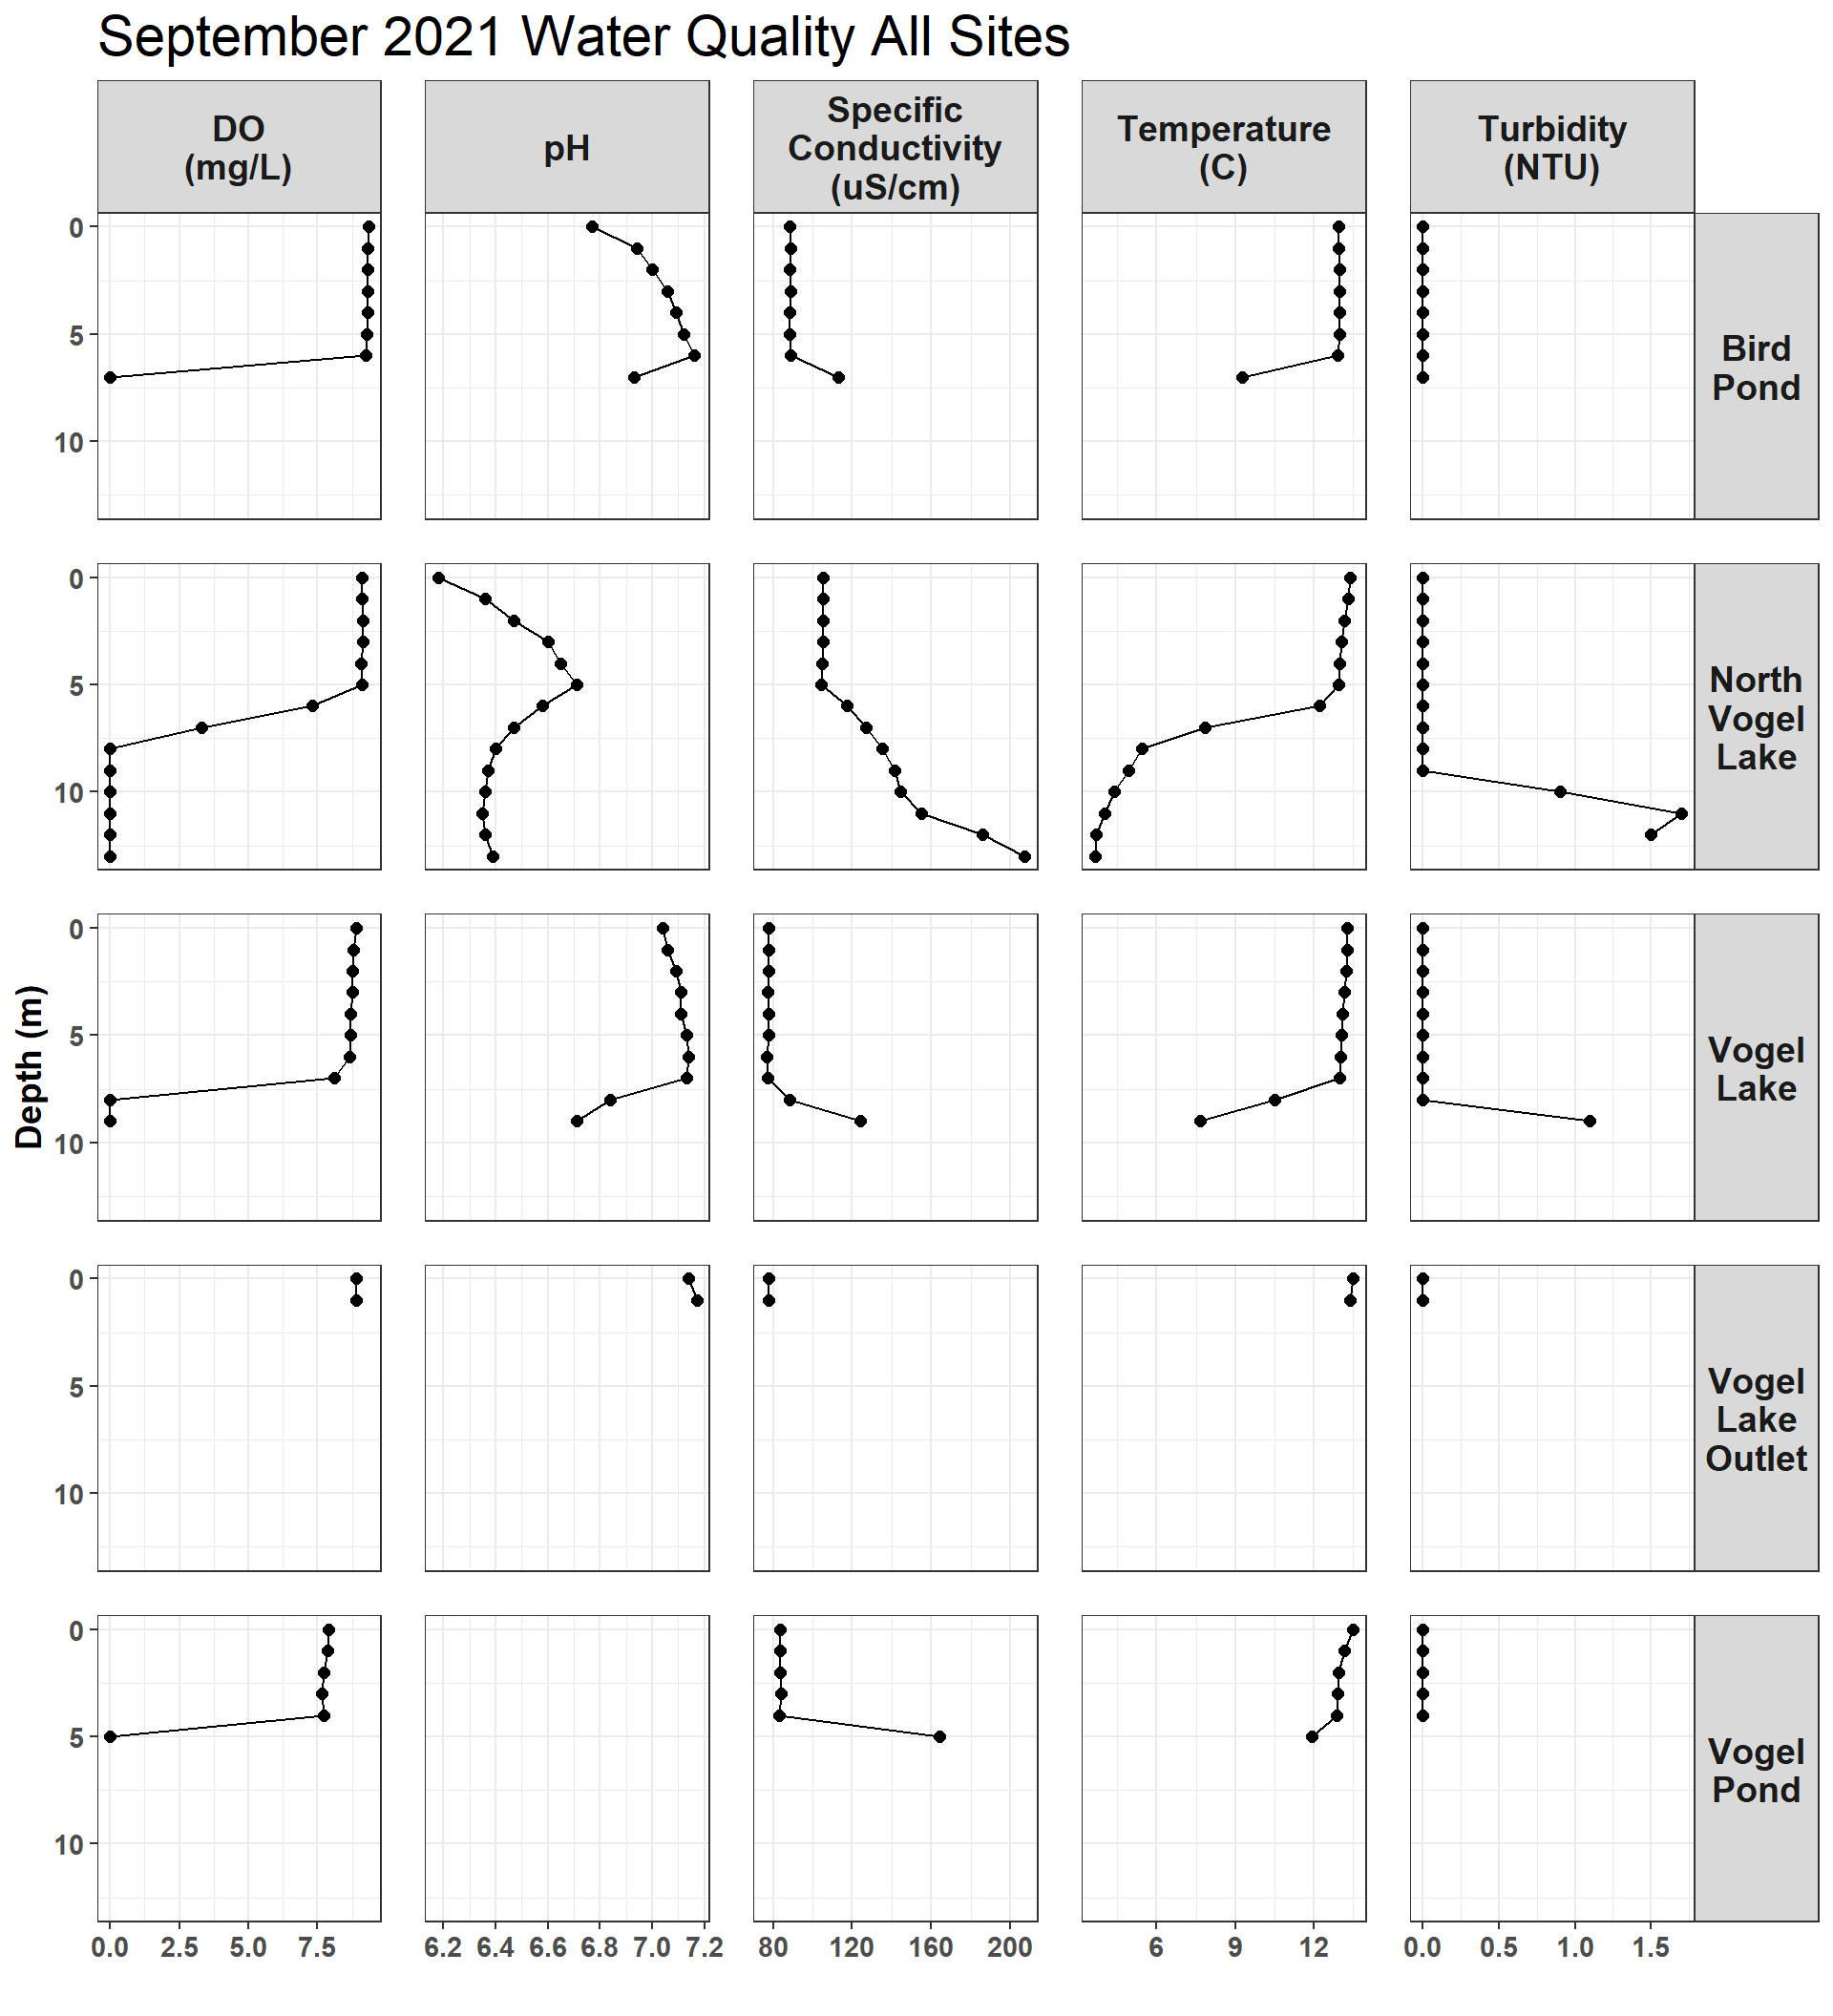
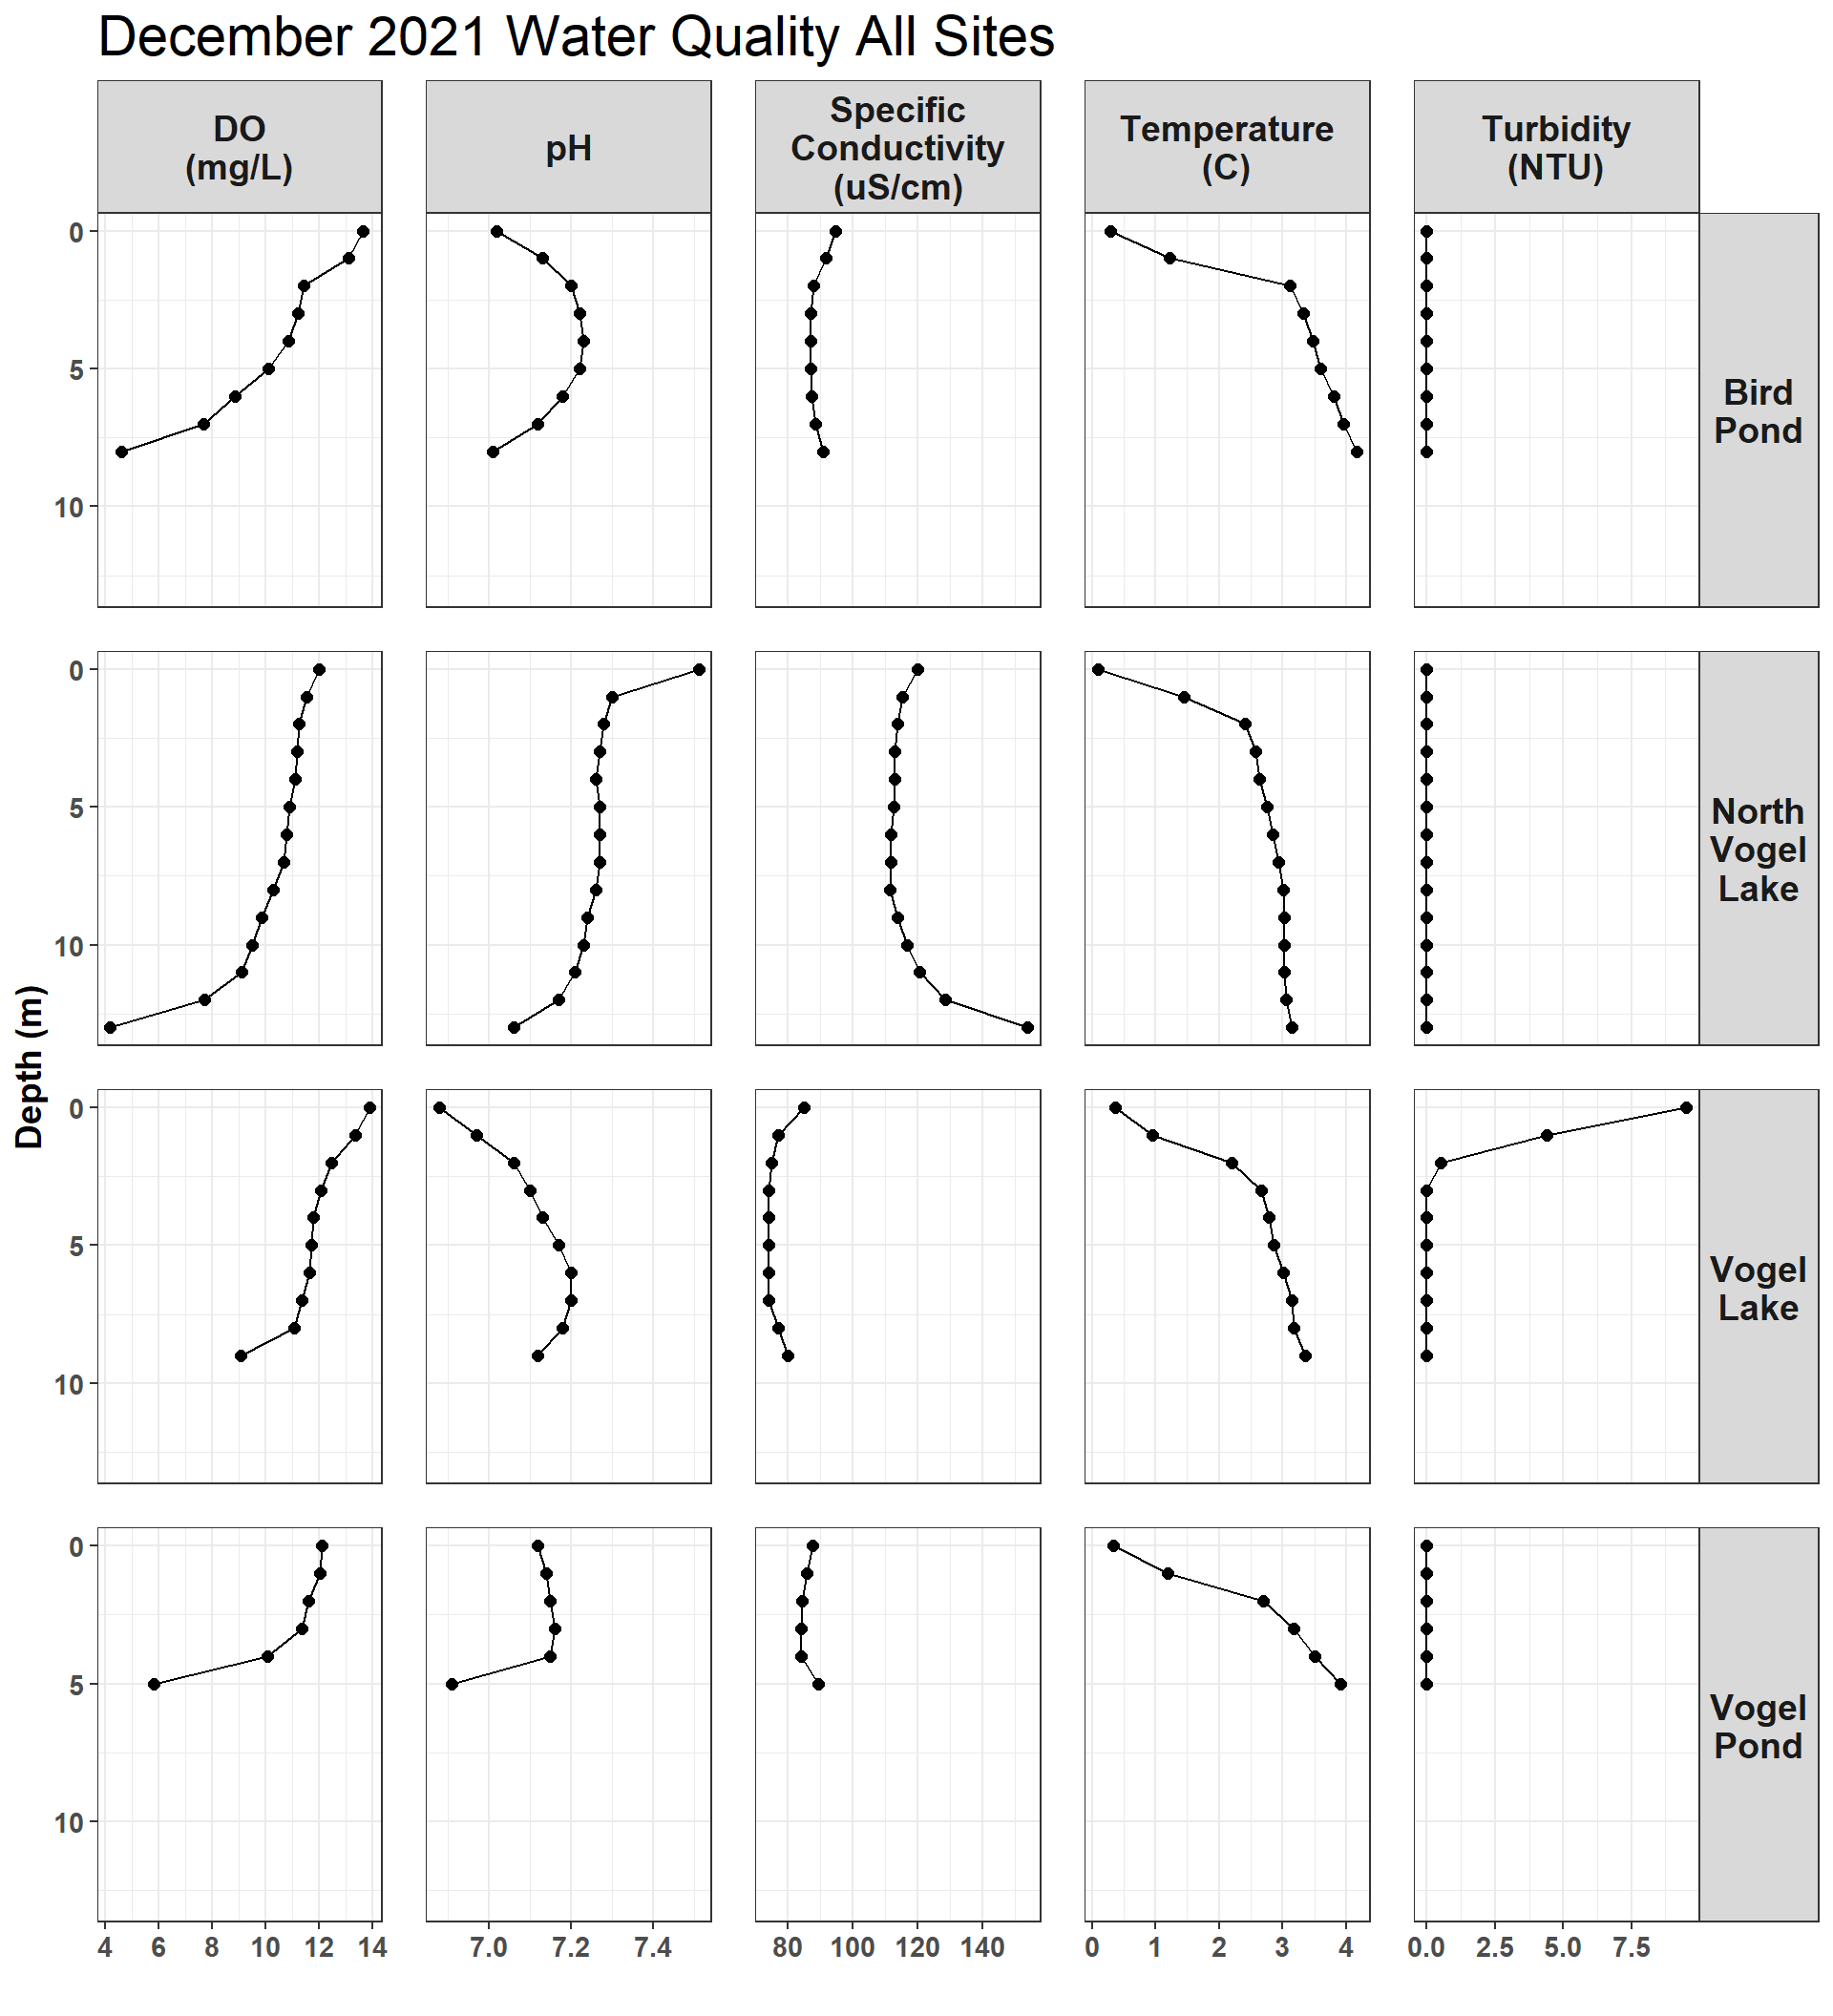
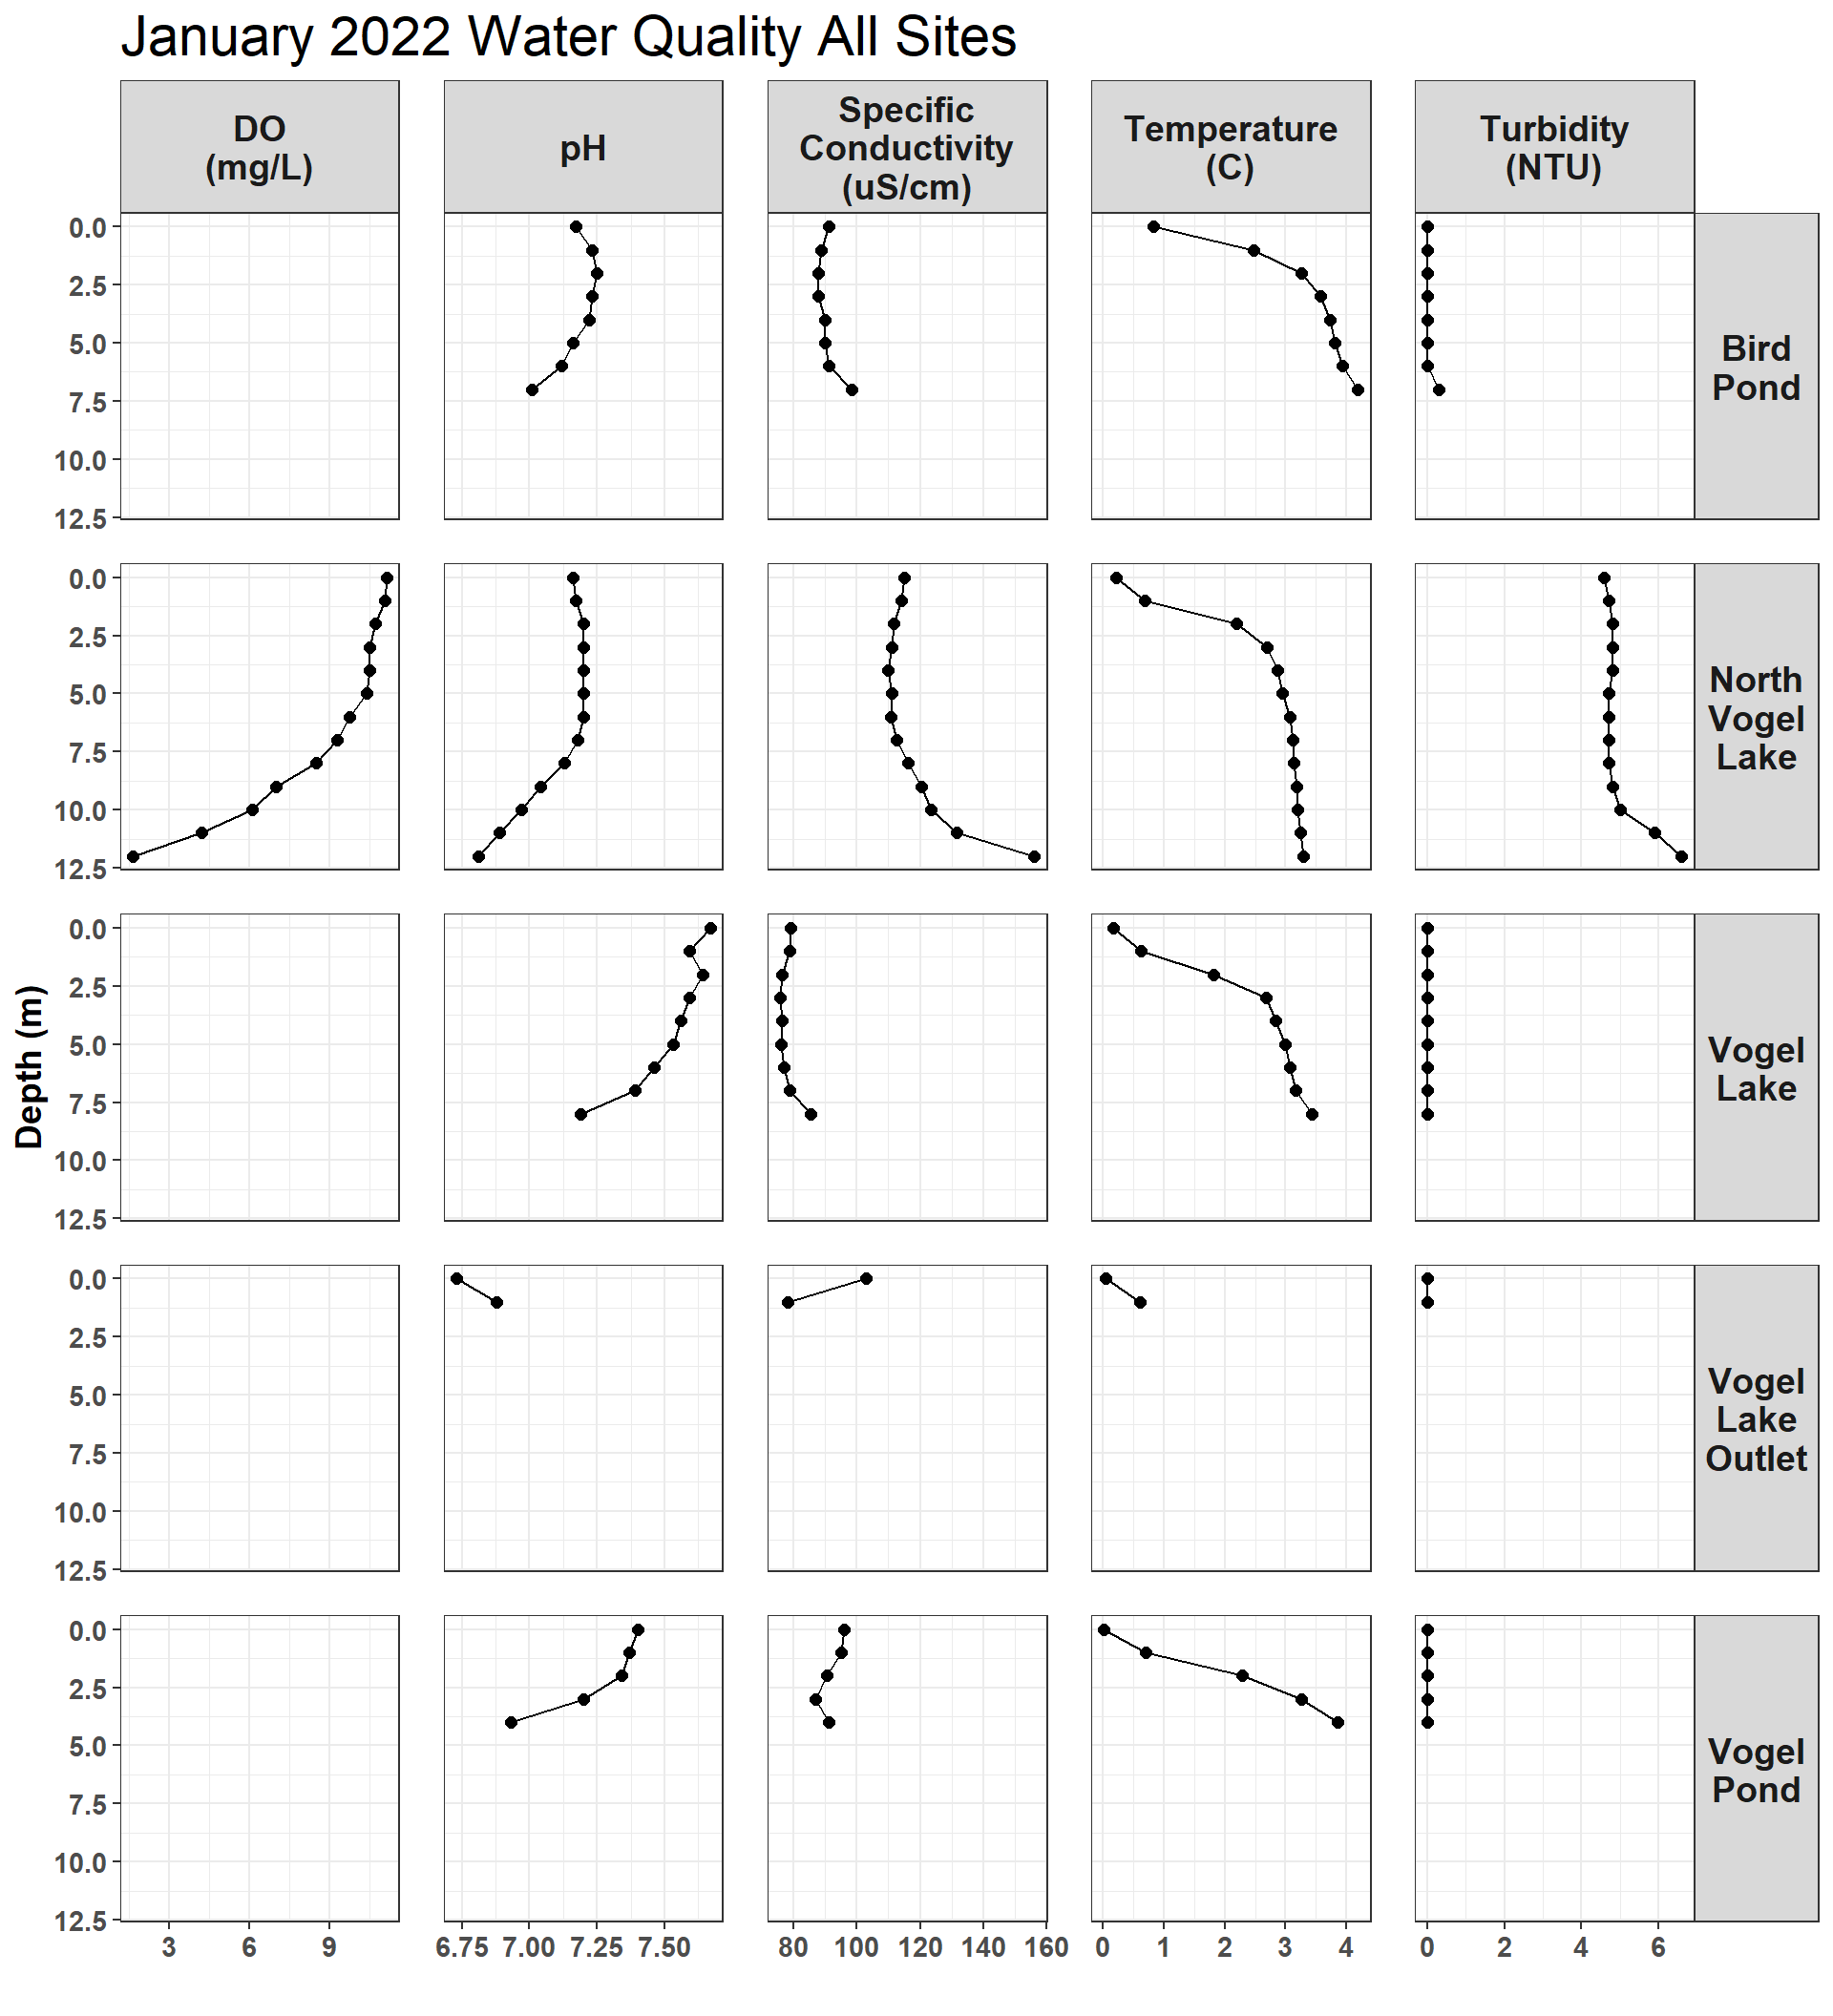
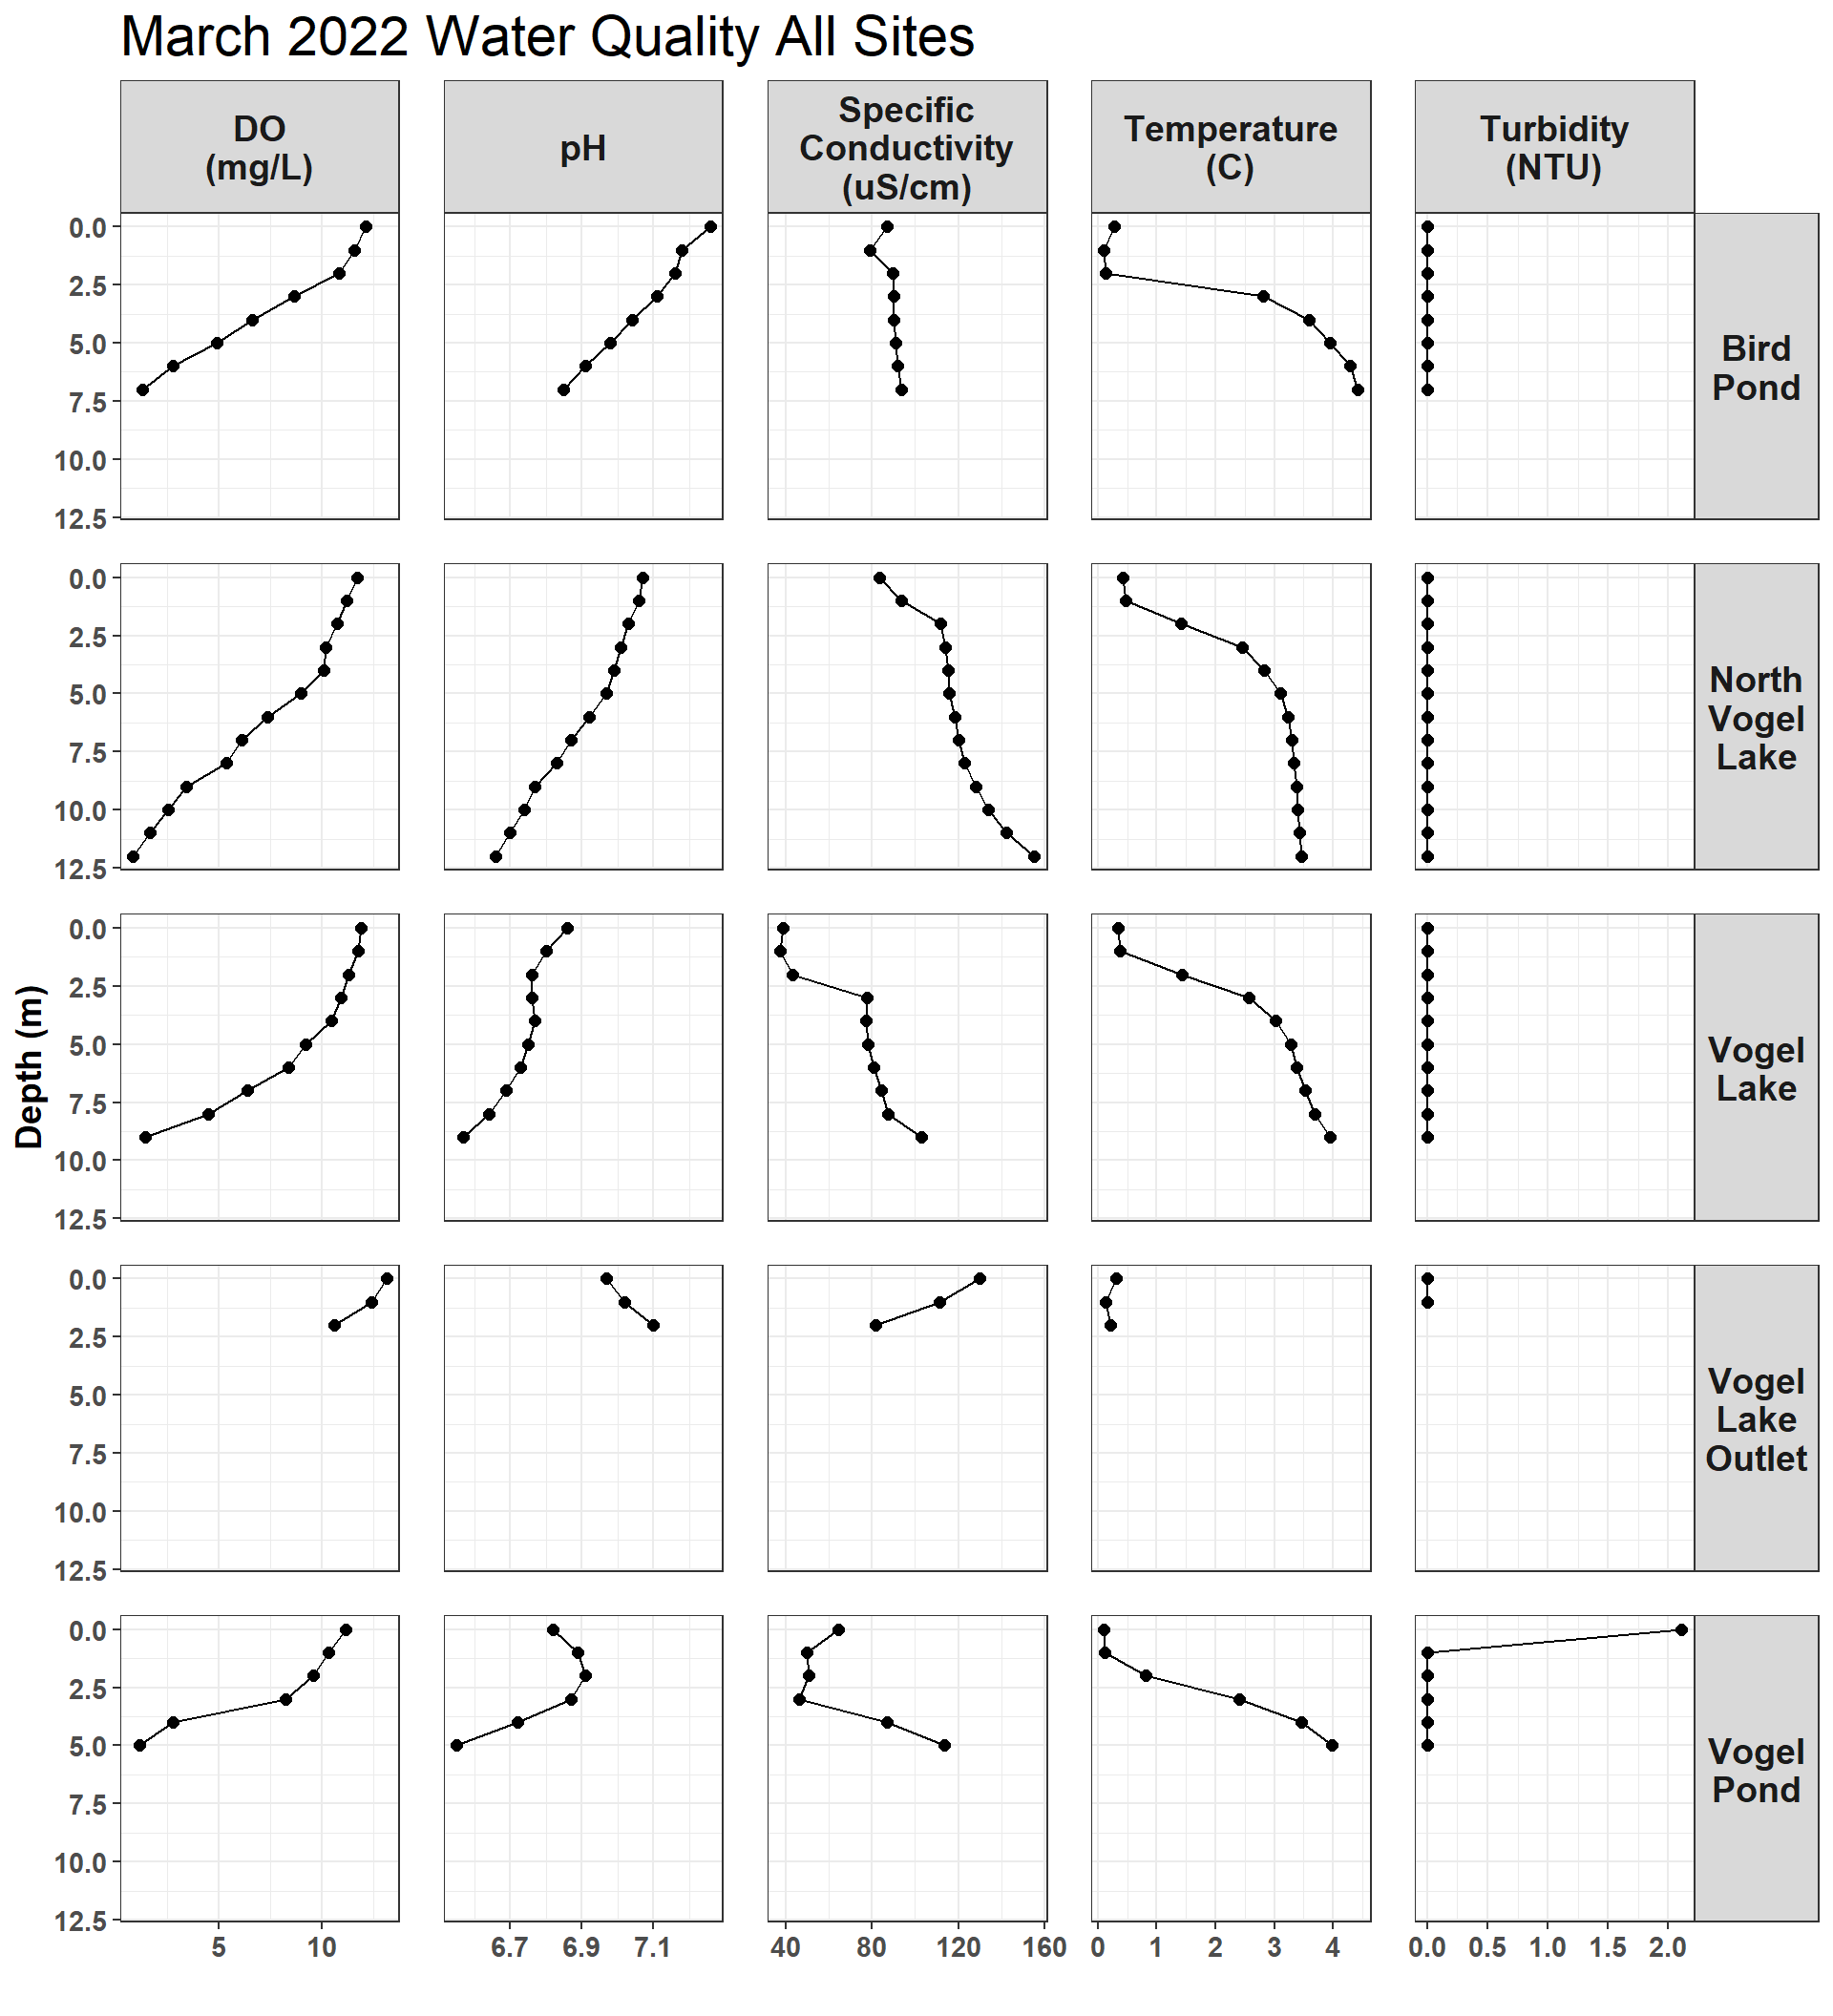
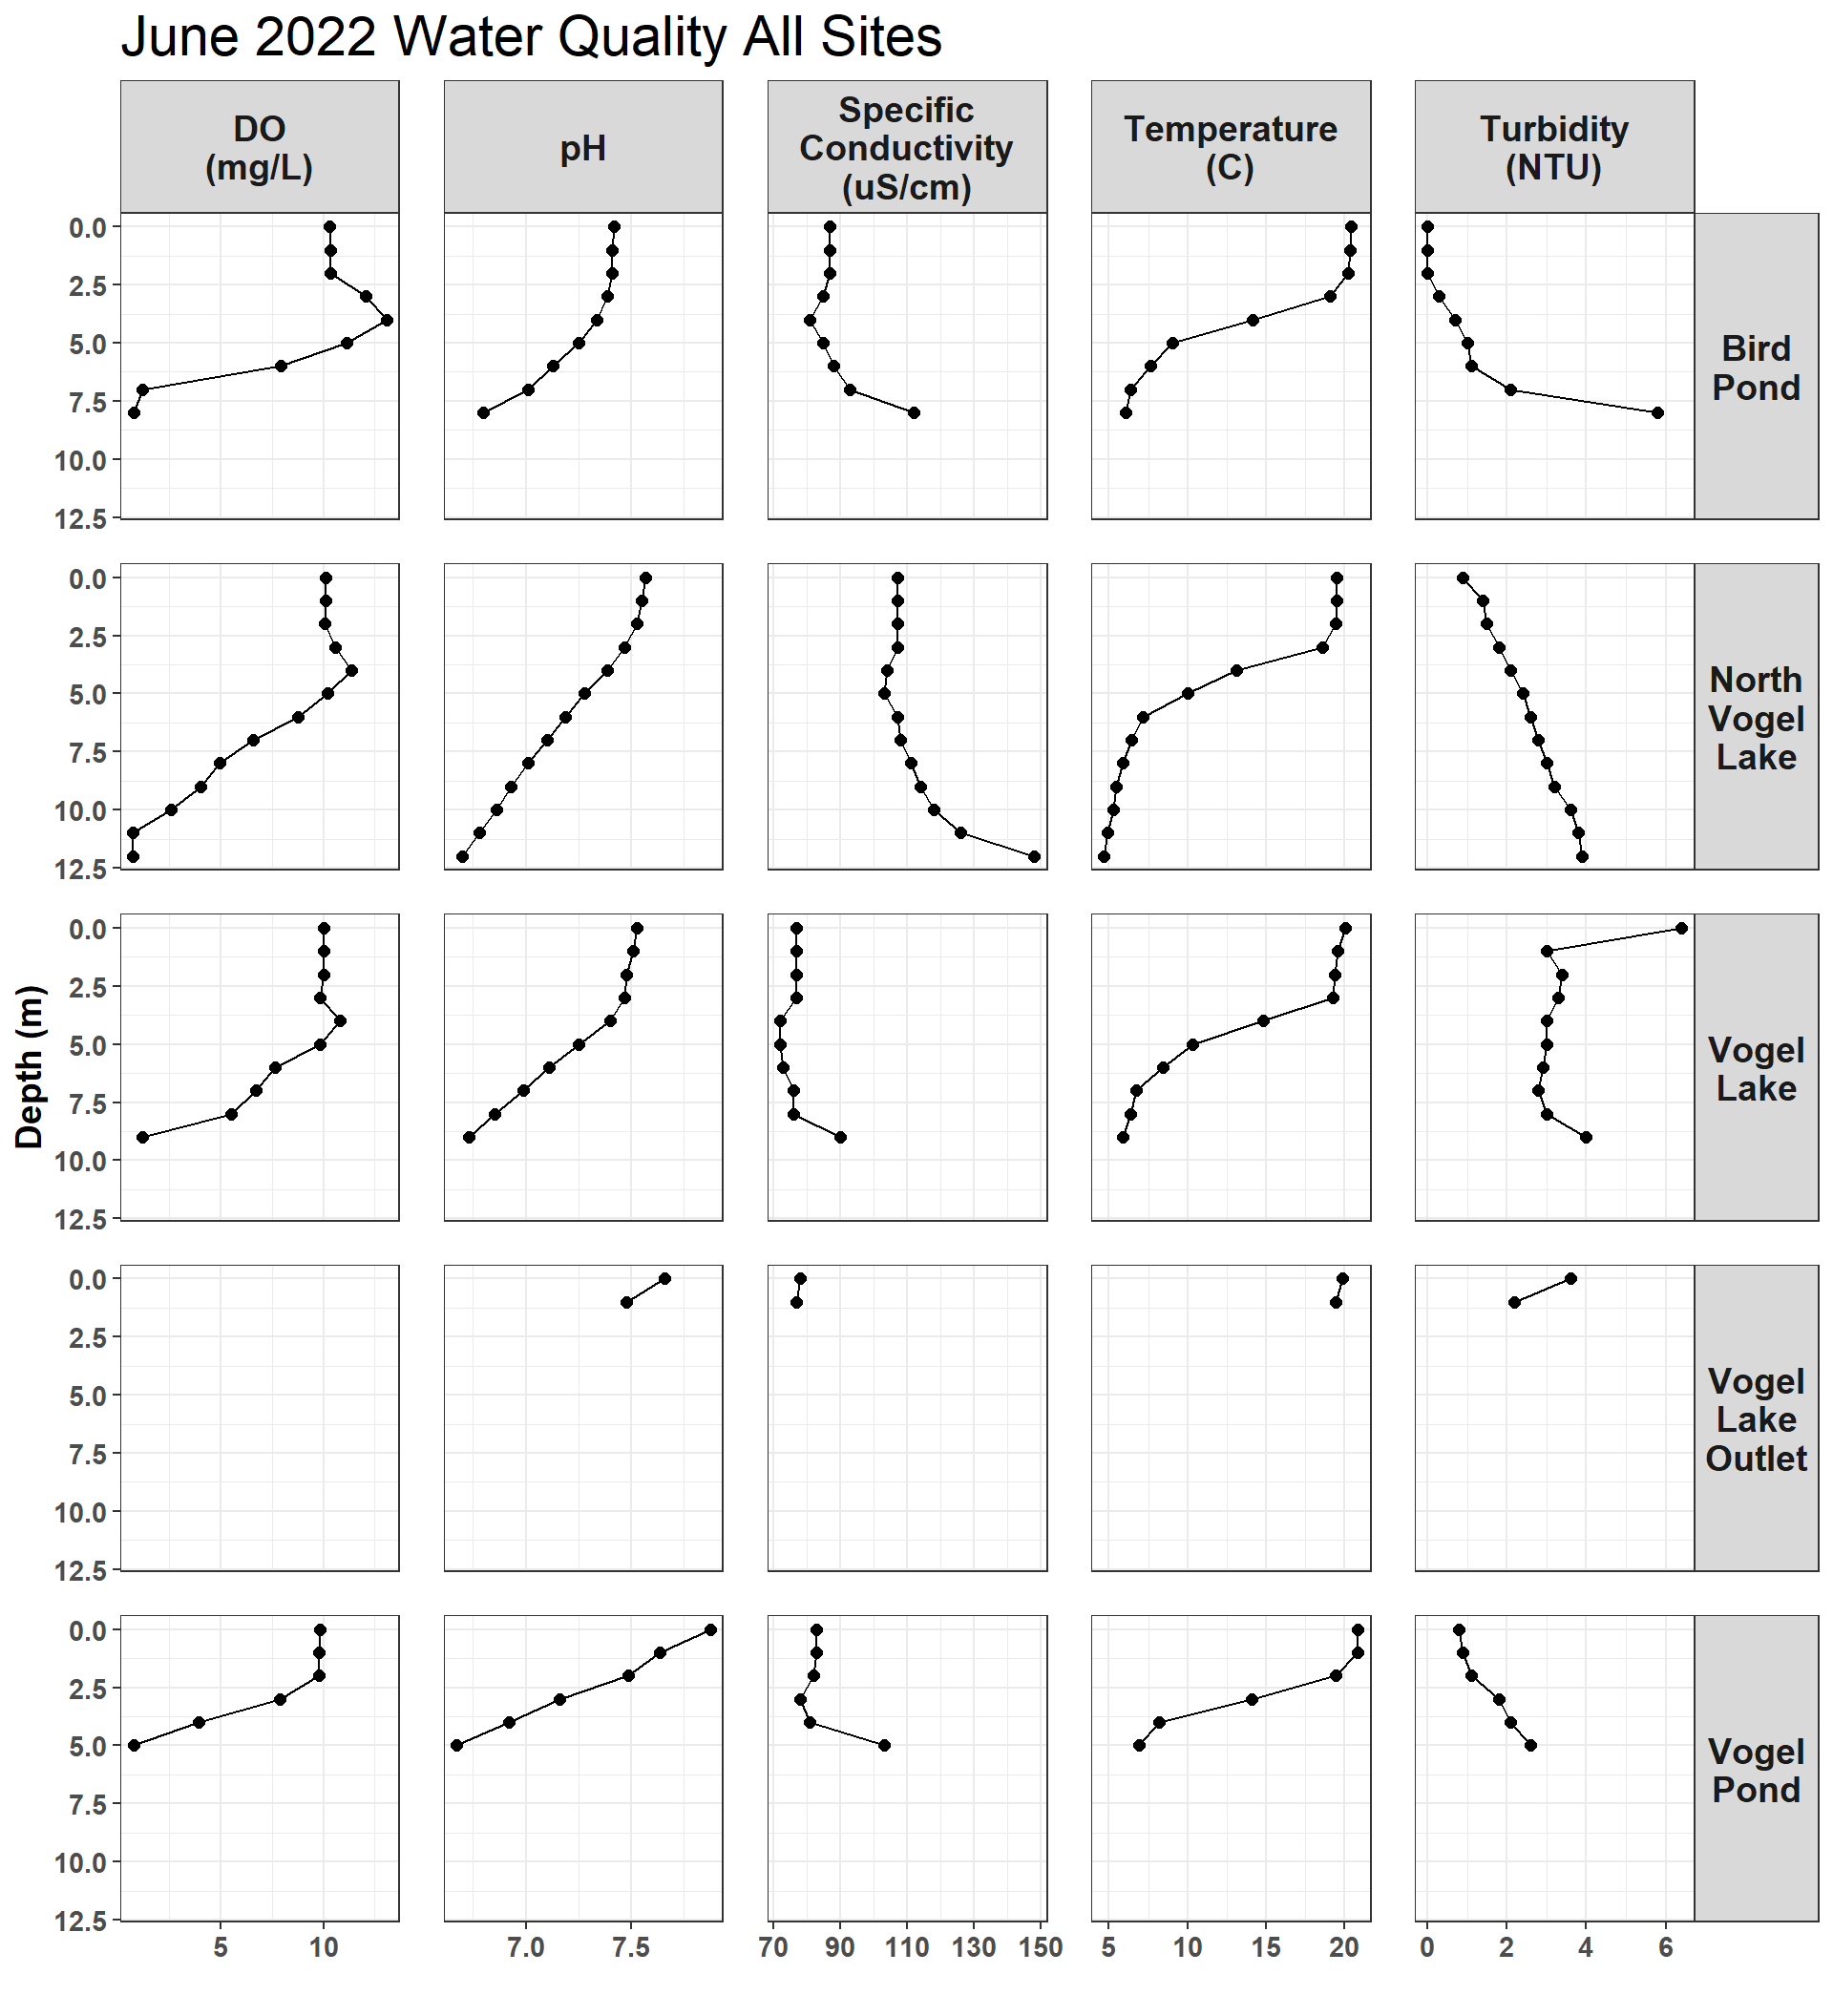
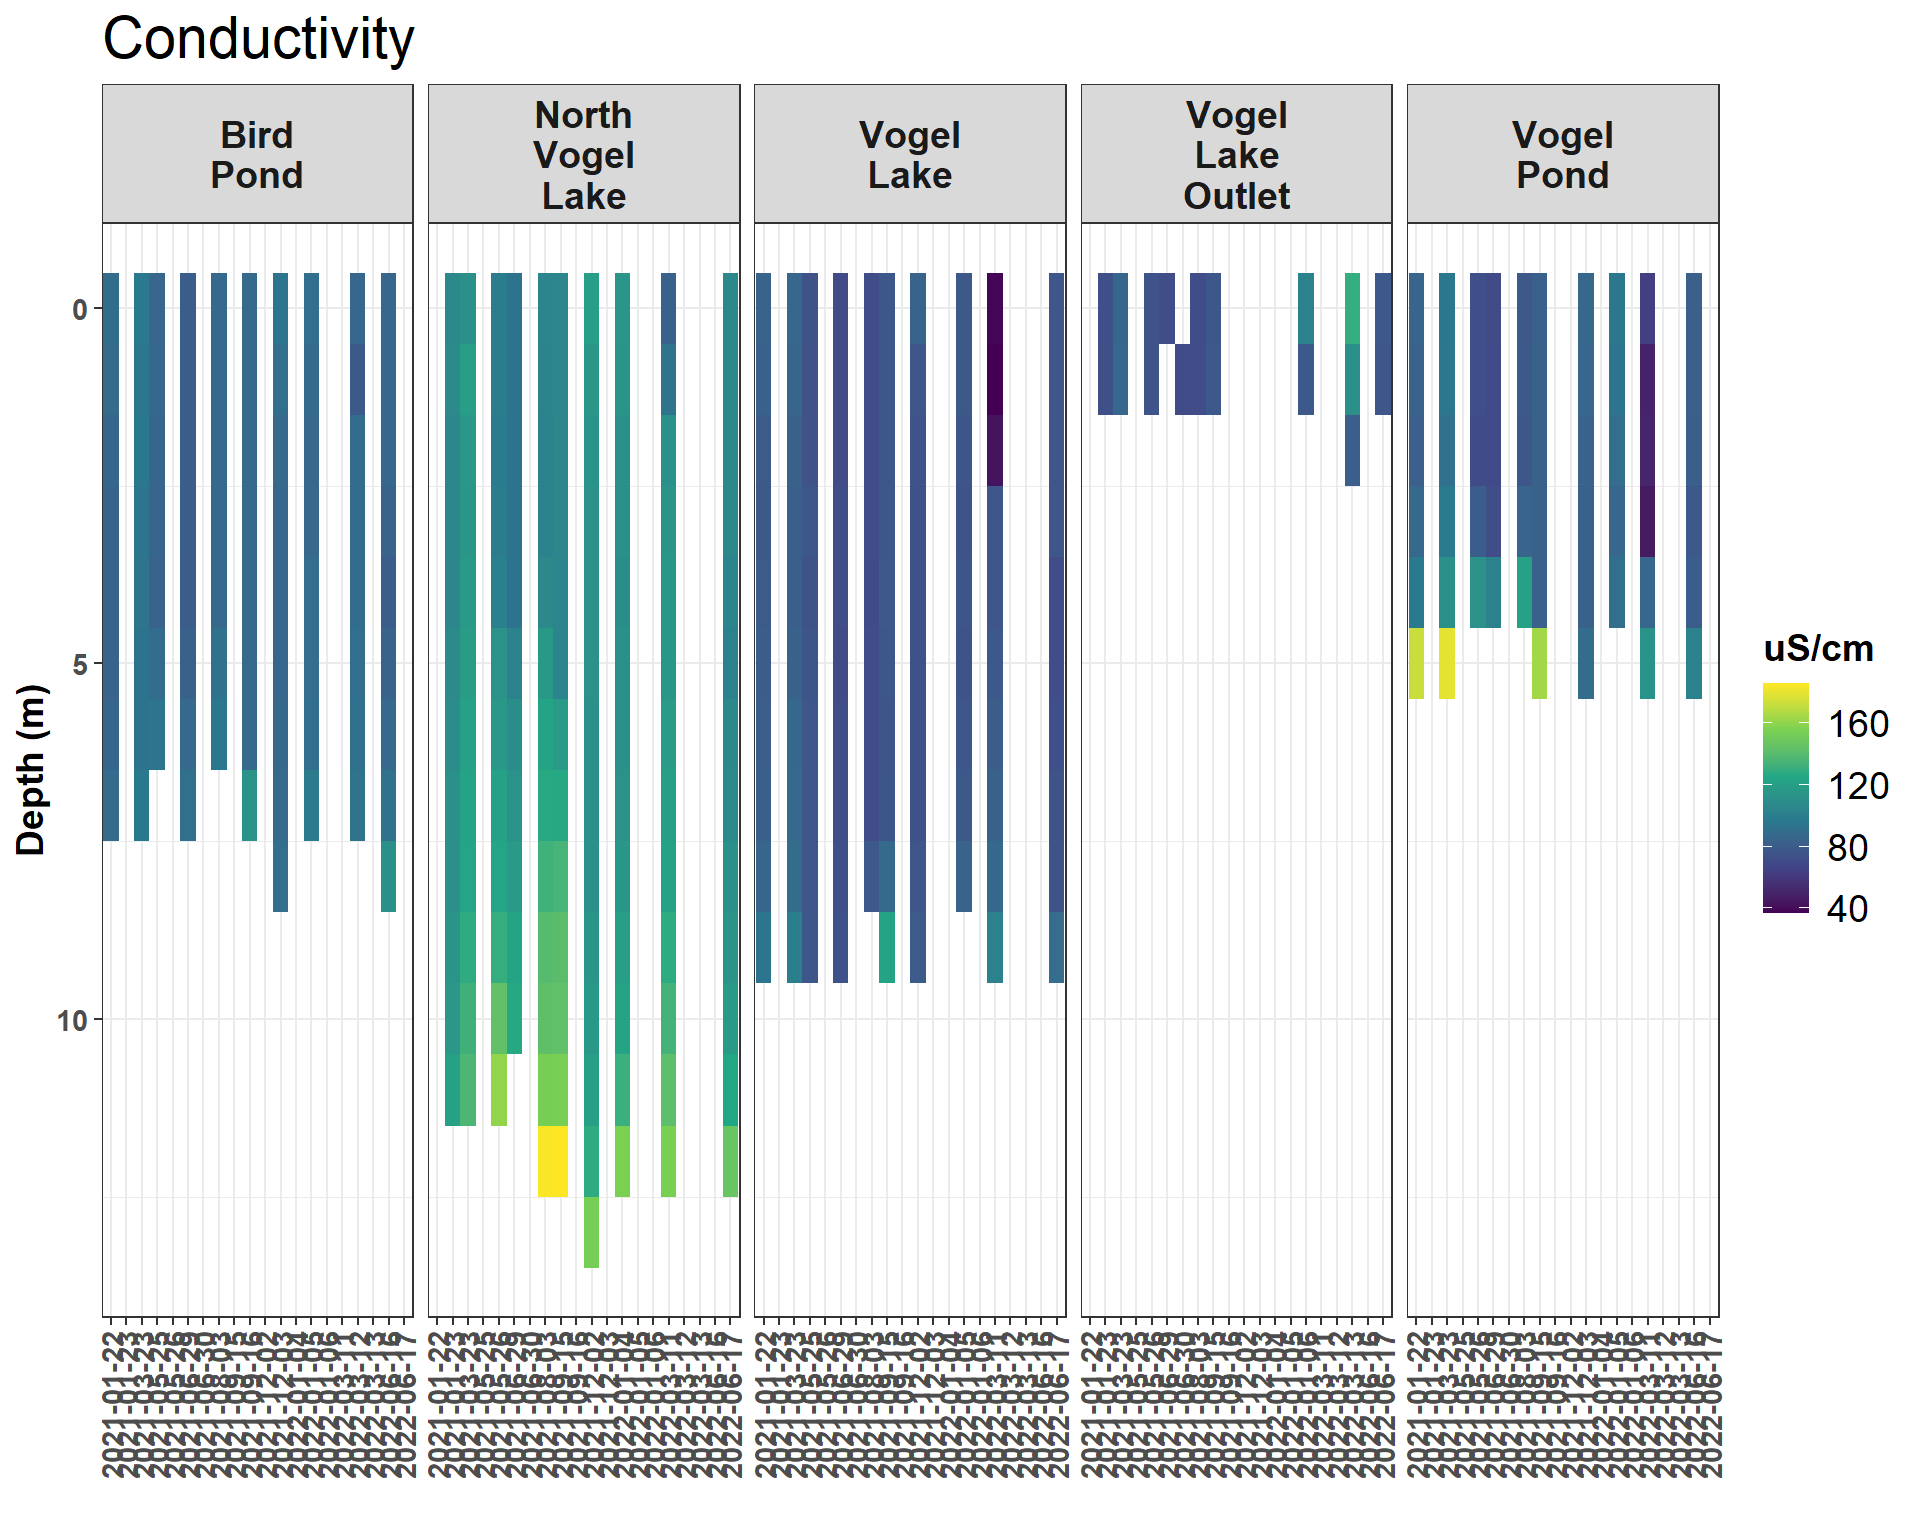
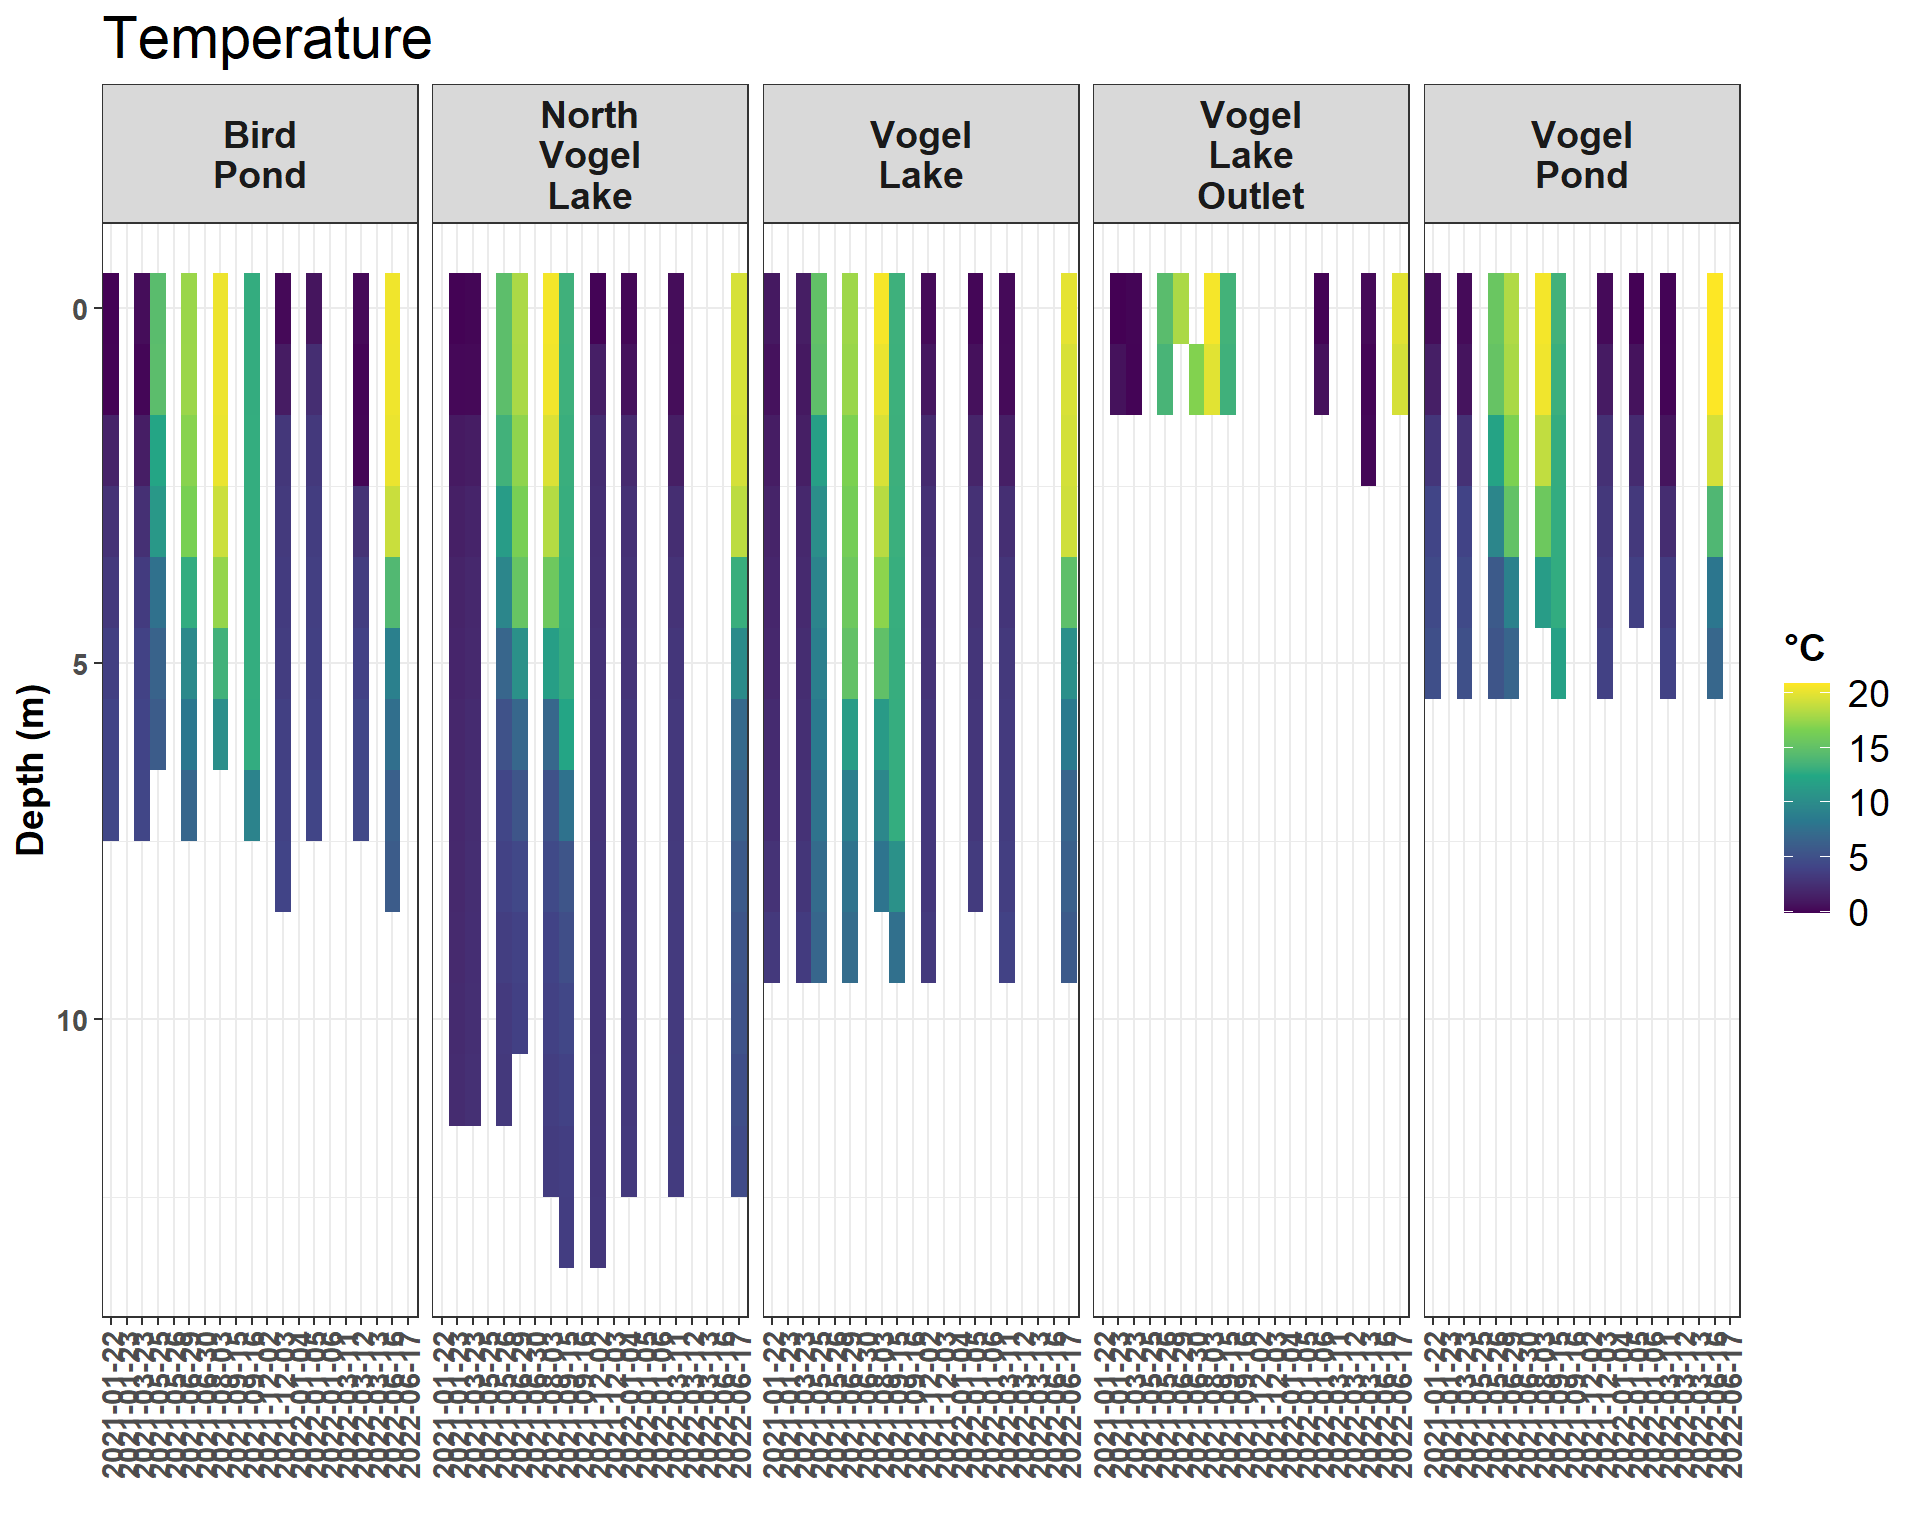
2.2 Overall Data
2.2.0.2 pH
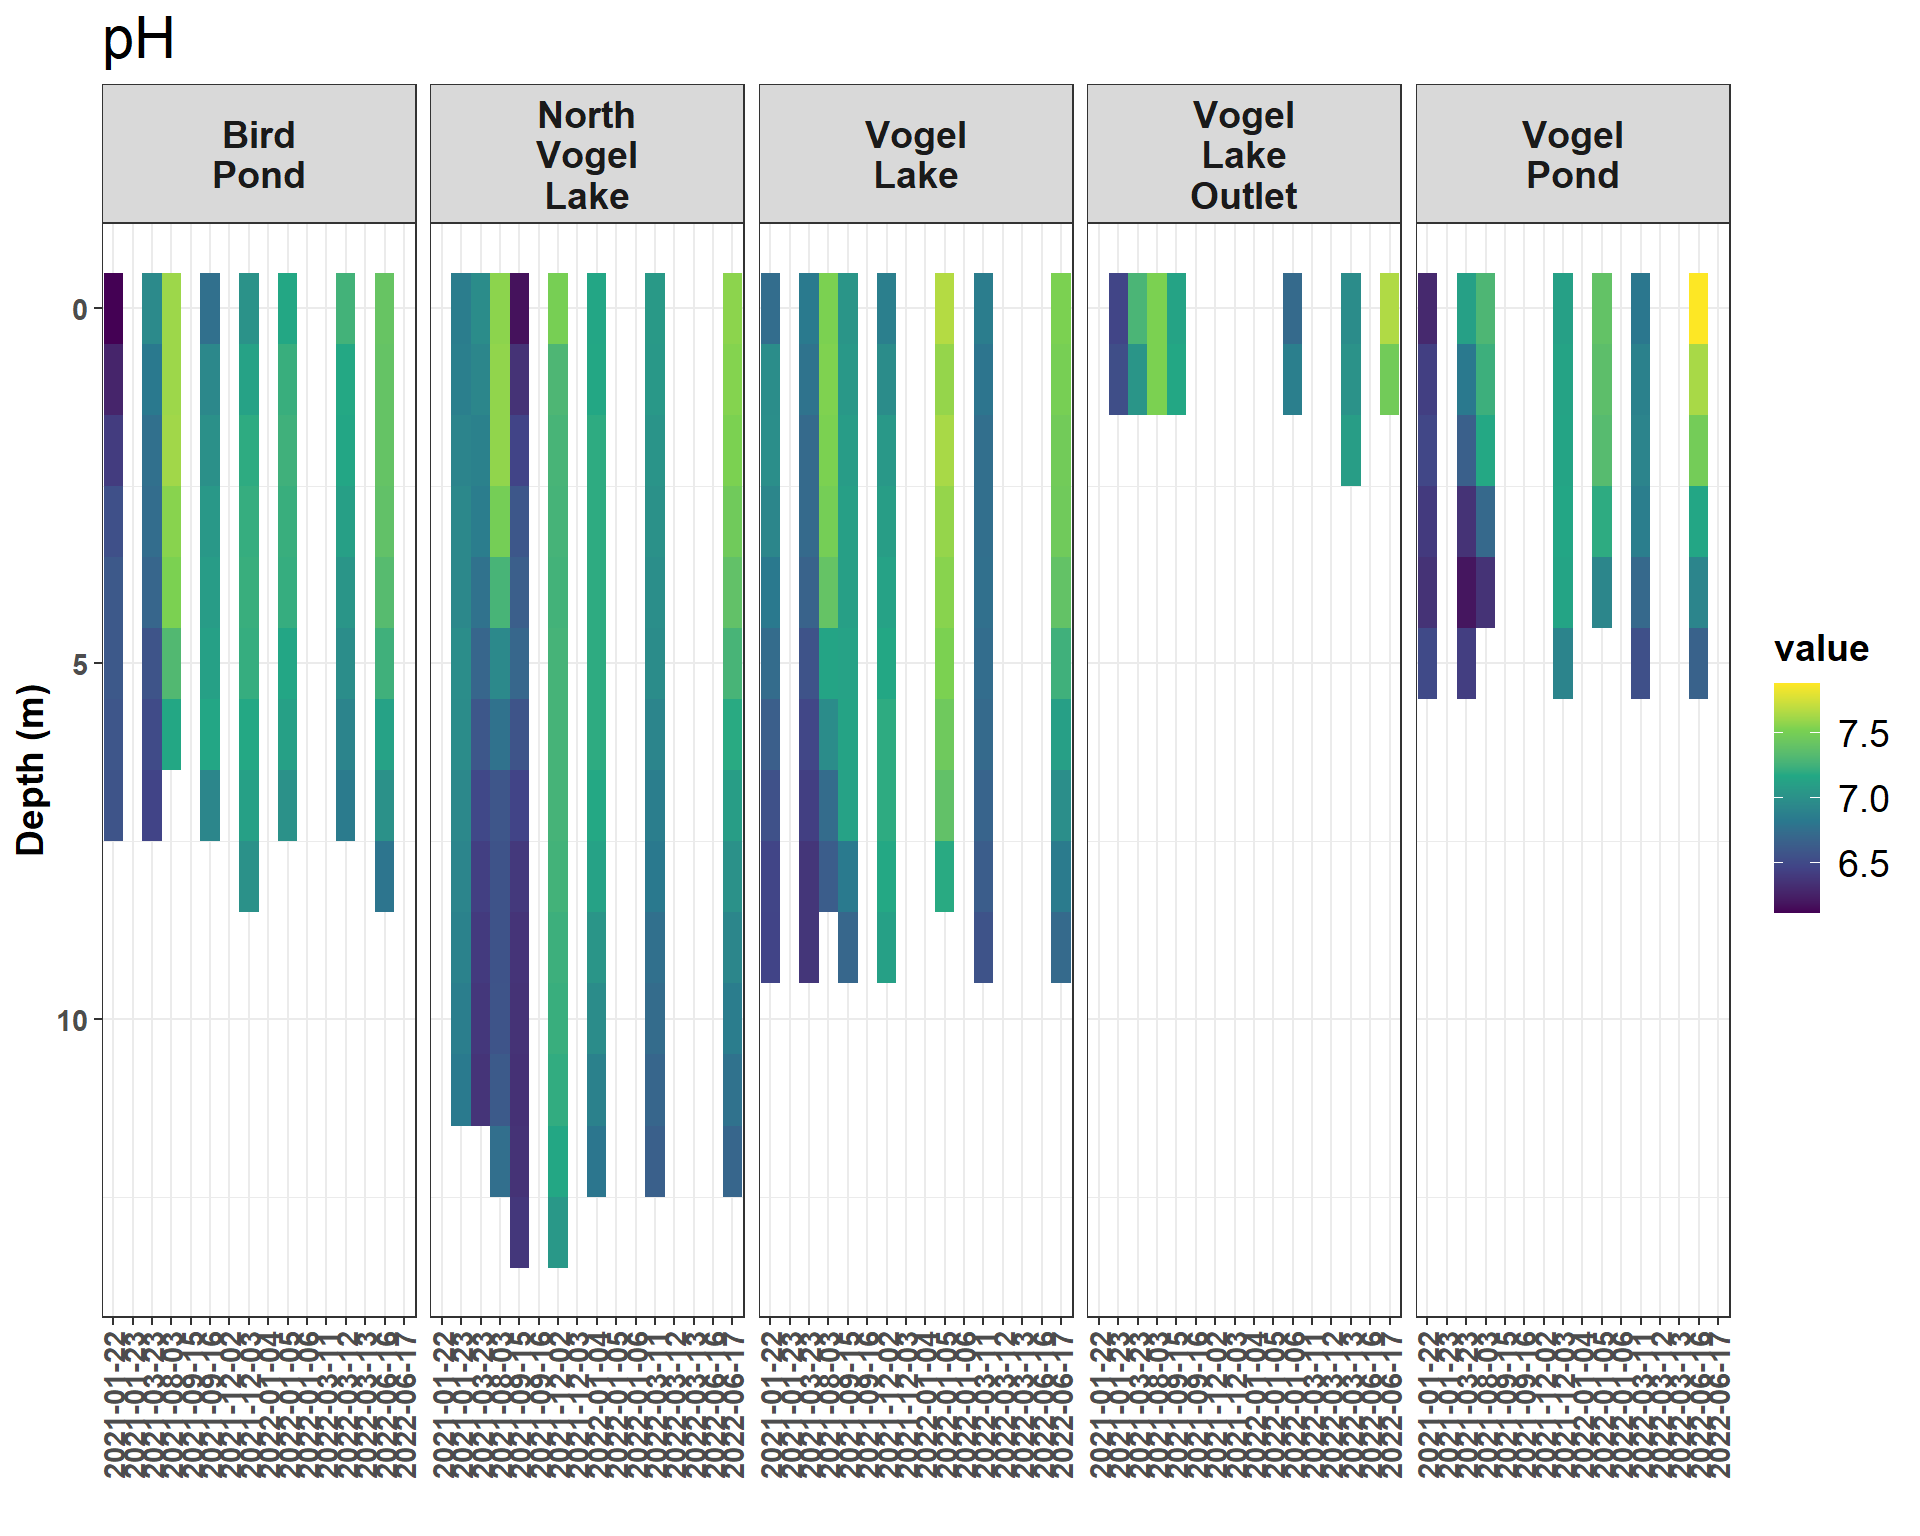
Figure 2.12: pH
Note: pH values are excluded from the May and June 2021 site visits due to an instrument error.
2.2.0.3 Turbidity
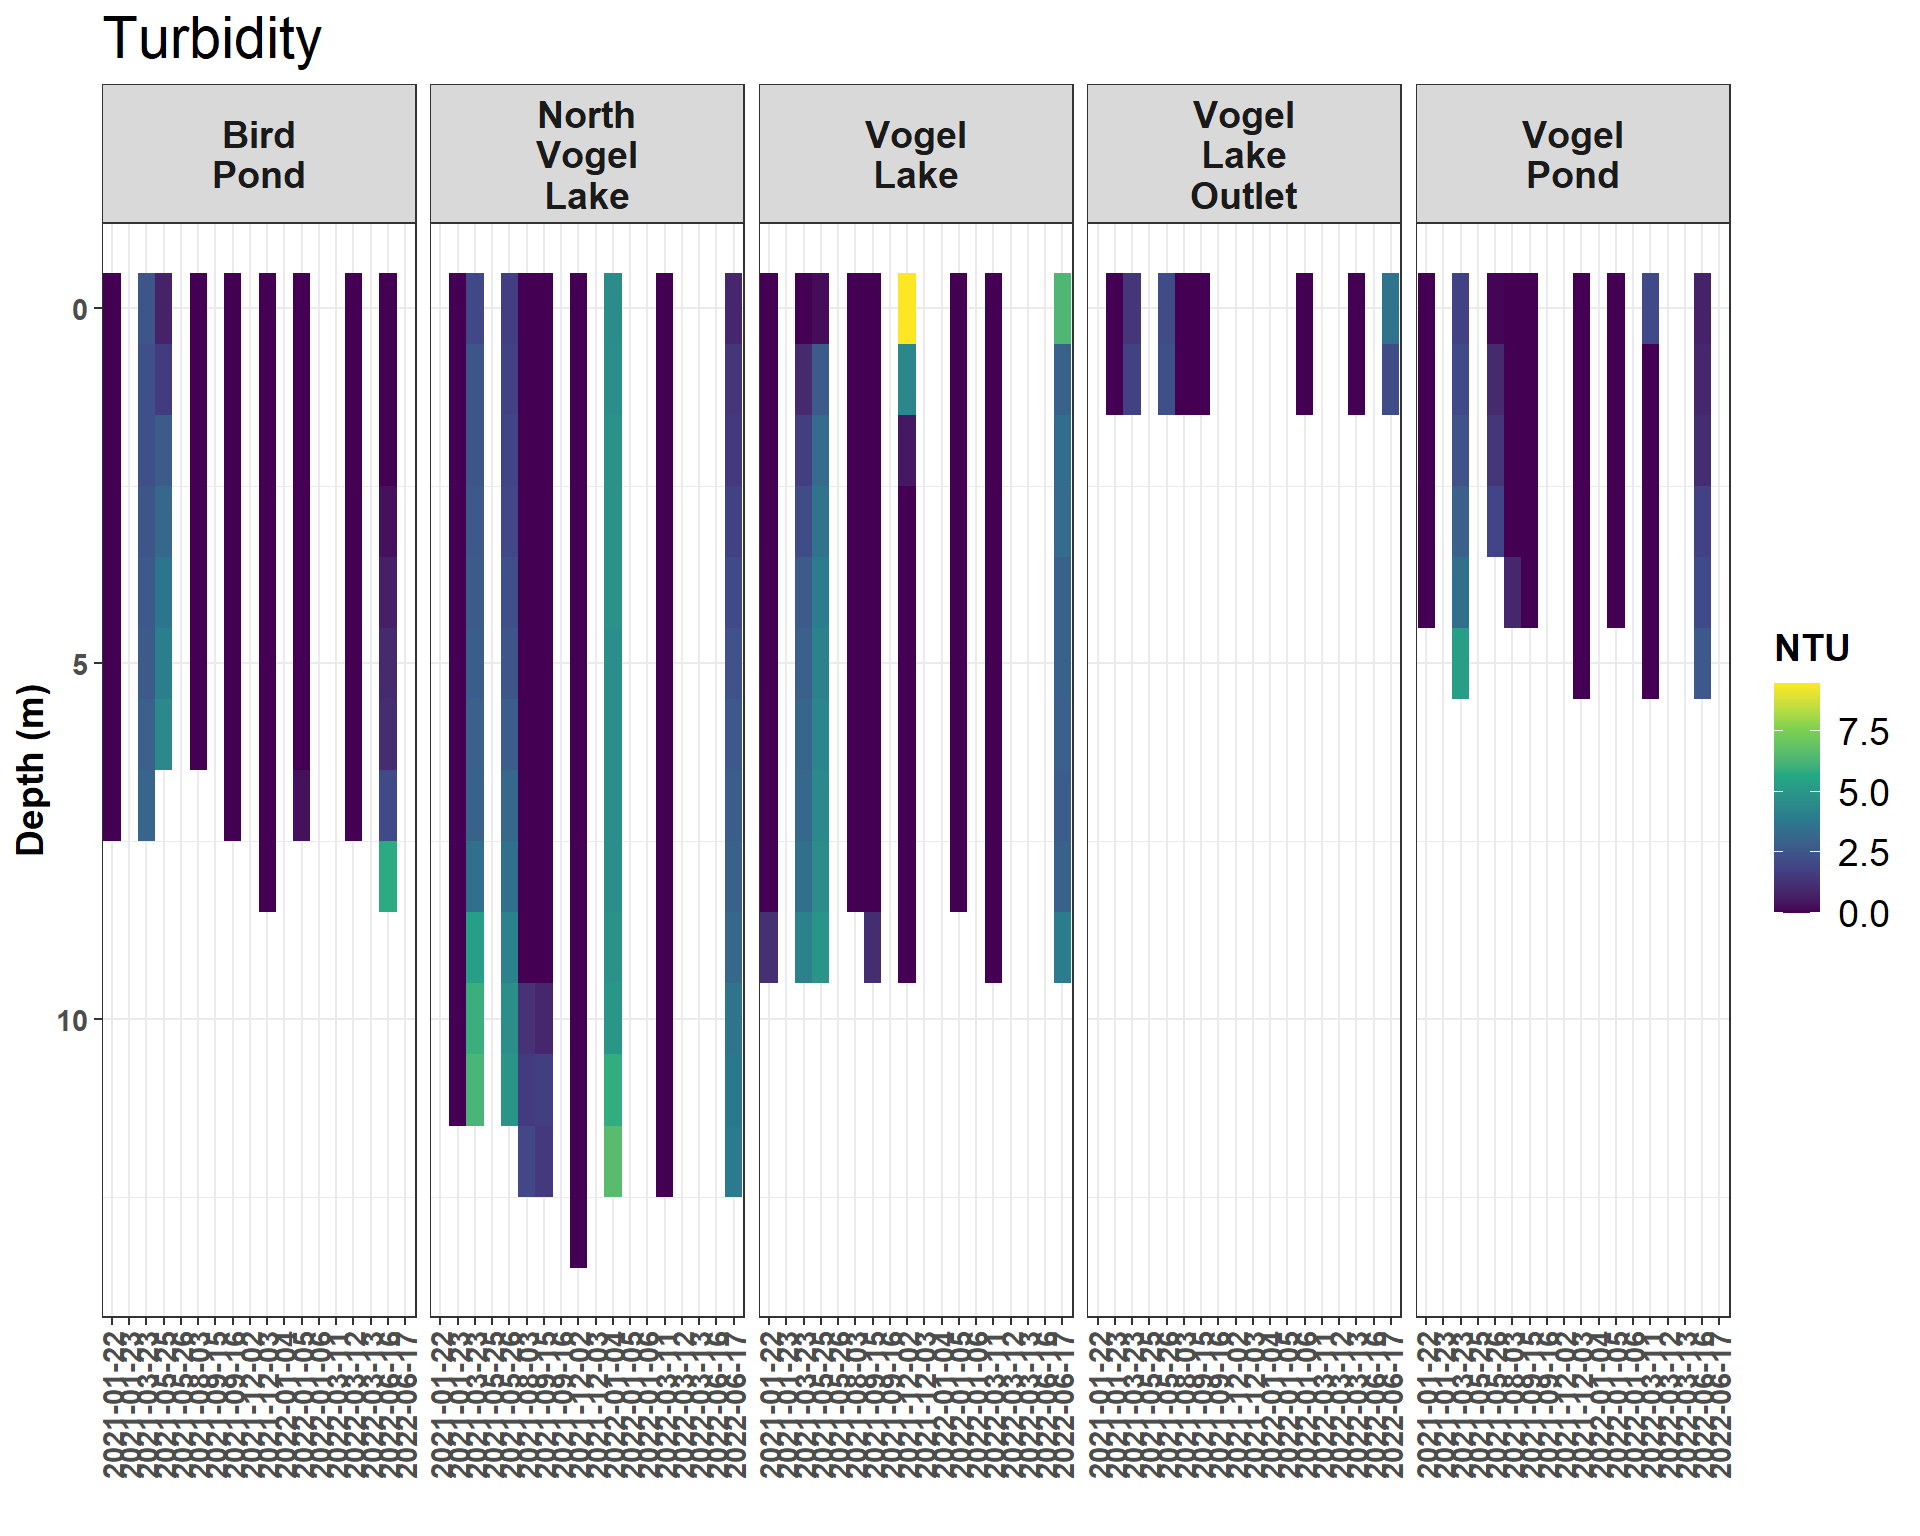
Figure 2.13: Turbidity (NTU)
Note: some turbidity values near the benthic surface of each site visit are not displayed in the above plot in order to improve visualization.