Chapter 10 eQTL
So far we’ve tested associations between phenotypes and SNPs (GWAS) and phenotypes and expression (TWAS). A different approach which is agnostic to phenotypes is expression QTL mapping (eQTL). Under this framework, we are interested in identifying SNP variants which are associated with the expression of a certain gene. The concept is identical to a GWAS or TWAS, however our phenotypes being tested are molecular phenotypes (gene expression values). This is particularly interesting when we think of transcriptional regulation in determining the expression of genes. In this exercise we will conduct a targeted eQTL analysis for two genes - p1 and the top hit from the TWAS analysis.
10.1 eQTL Analysis
Read in phenotypes (expression data)
setwd("~/PGRP_mapping_workshop/data/expression_data/")
expr = fread("subset_widiv942_scaled_quant_rank_TPM.txt", data.table = FALSE)
Read in SNPs
setwd("~/PGRP_mapping_workshop/data/genotypic_and_phenotypic_data/")
myGD = attach.big.matrix("WIDIV_942.geno.desc")
Read in map
map = fread("WIDIV_942.geno.map", data.table = FALSE)Read in PCs
snp_pcs = attach.big.matrix("WIDIV_942.pc.desc")
snp_pcs = snp_pcs[,]
Read in kinship
myKin = attach.big.matrix("WIDIV_942.kin.desc")Run eQTL analysis for only P1 and the most signif gene from TWAS analysis Here we are using the FarmCPU model for eQTL analysis accounting for both population structure and kinship.
expr_sub = expr[expr$geneid%in%c("Zm00001d052153","Zm00001d028854"),]
rownames(expr_sub) = expr_sub$geneid
expr_sub = t(expr_sub[,-c(1:4)])
expr_sub = as_tibble(expr_sub) %>% add_column(Taxa = rownames(expr_sub), .before = 1)
expr_sub = data.frame(expr_sub)
setwd("~/PGRP_mapping_workshop/eQTL_results/")
for(i in colnames(expr_sub)[2:ncol(expr_sub)]){
gwas_kinship = MVP(
phe=expr_sub[, c("Taxa", i)],
geno=myGD,
map=map,
maxLoop=10,
CV.FarmCPU=snp_pcs[,1:3], # Covariates (Q) in FarmCPU
method.bin="FaST-LMM", # Method for optimizing bins used by FarmCPU
method=c("FarmCPU"),
file.output = TRUE
)
gc()
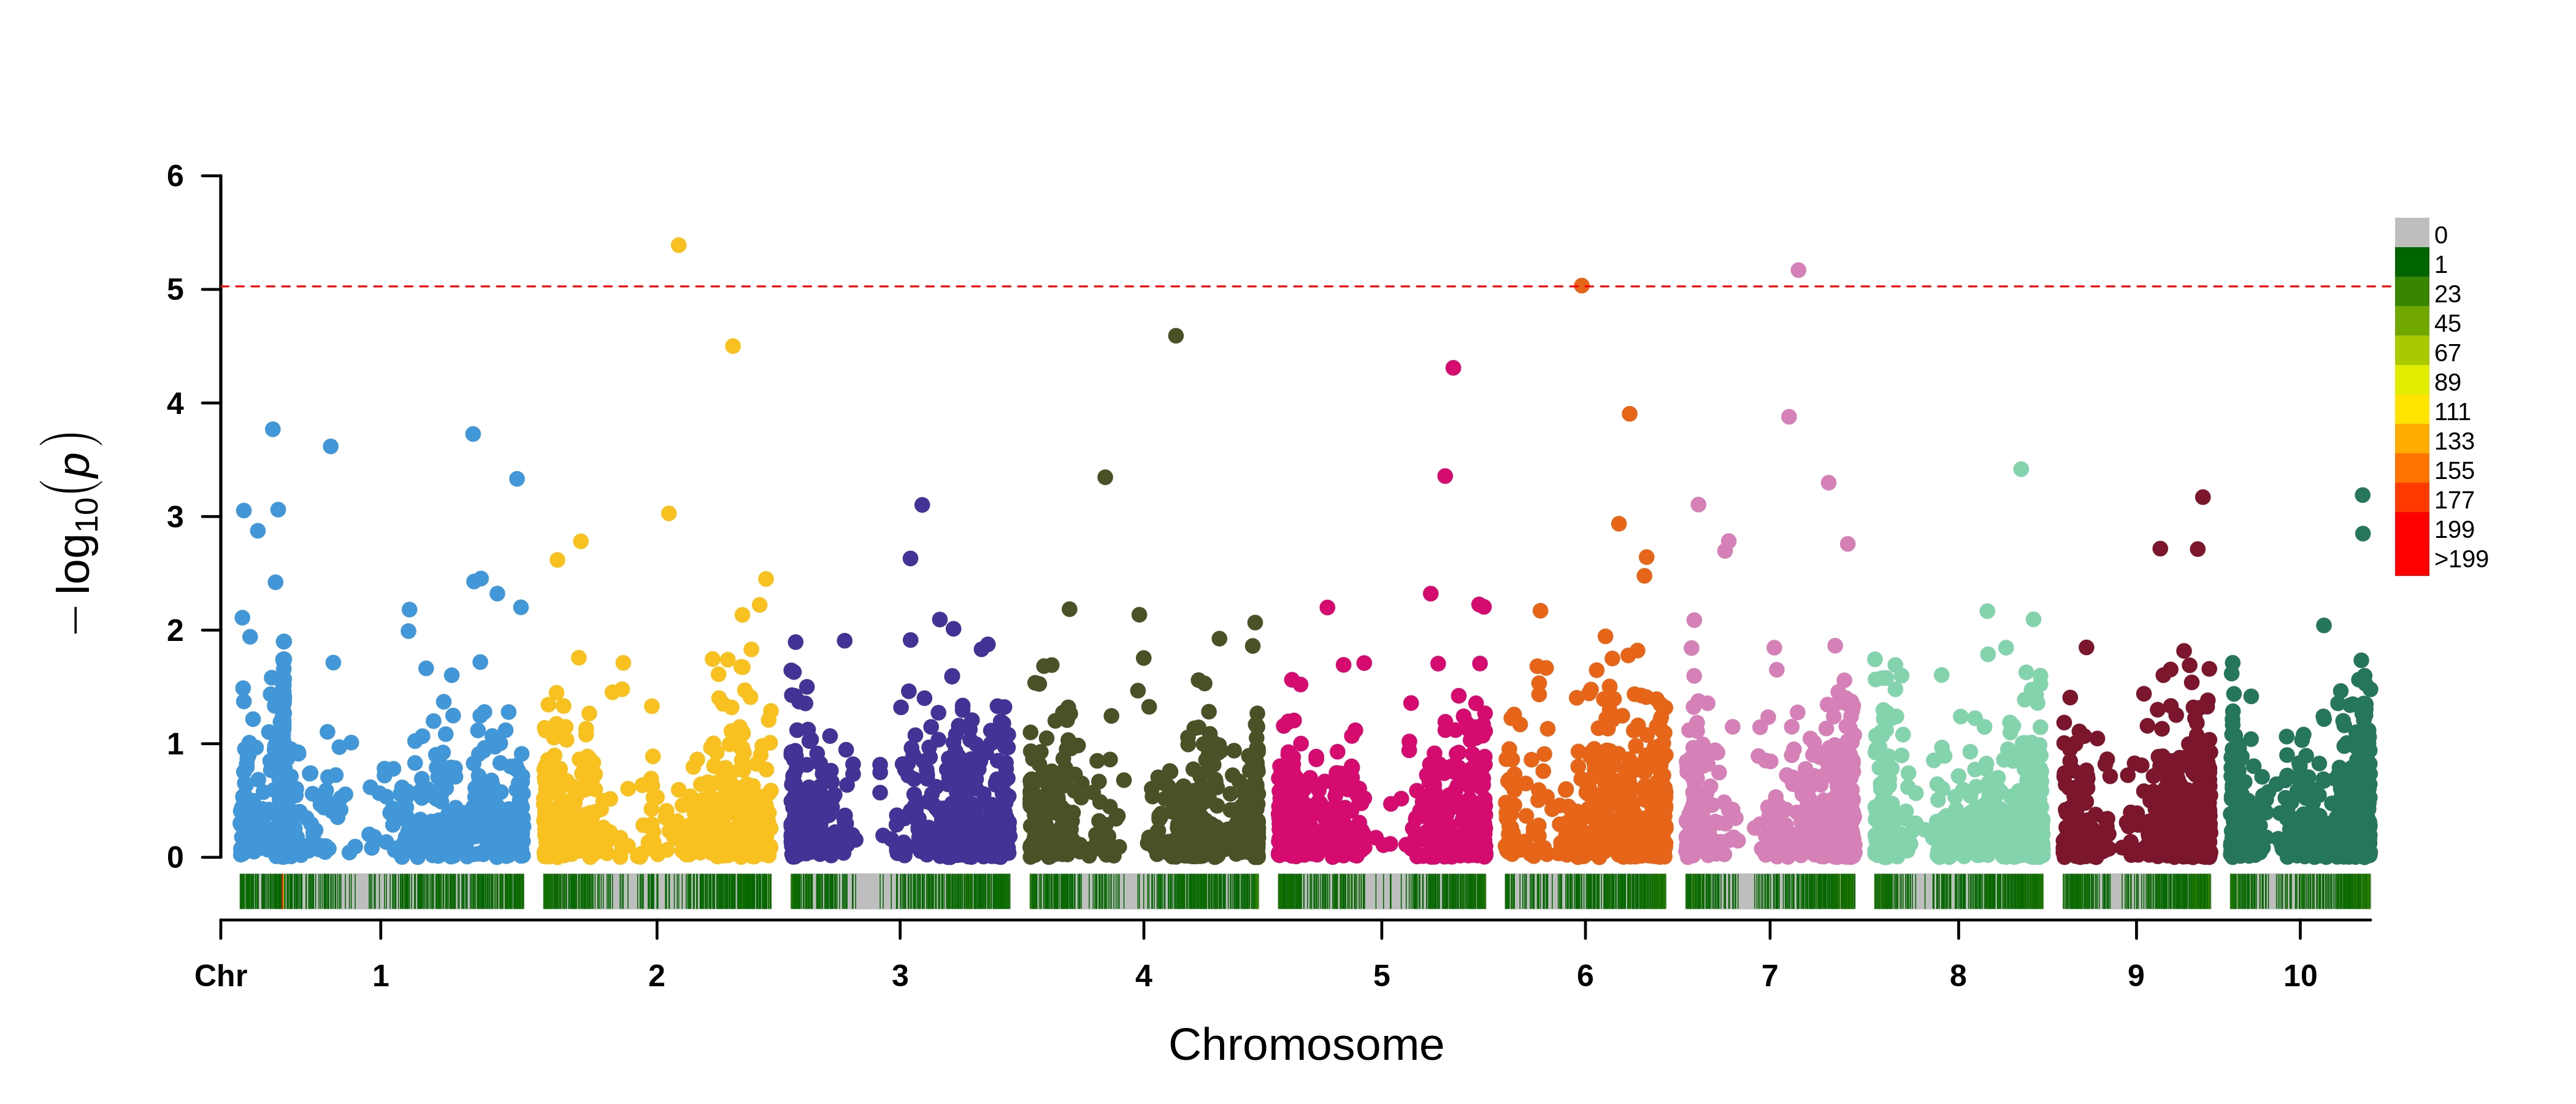
}eQTL results for Zm00001d052153 which is on chromosome 4. SNP density plotted on the x-axis.
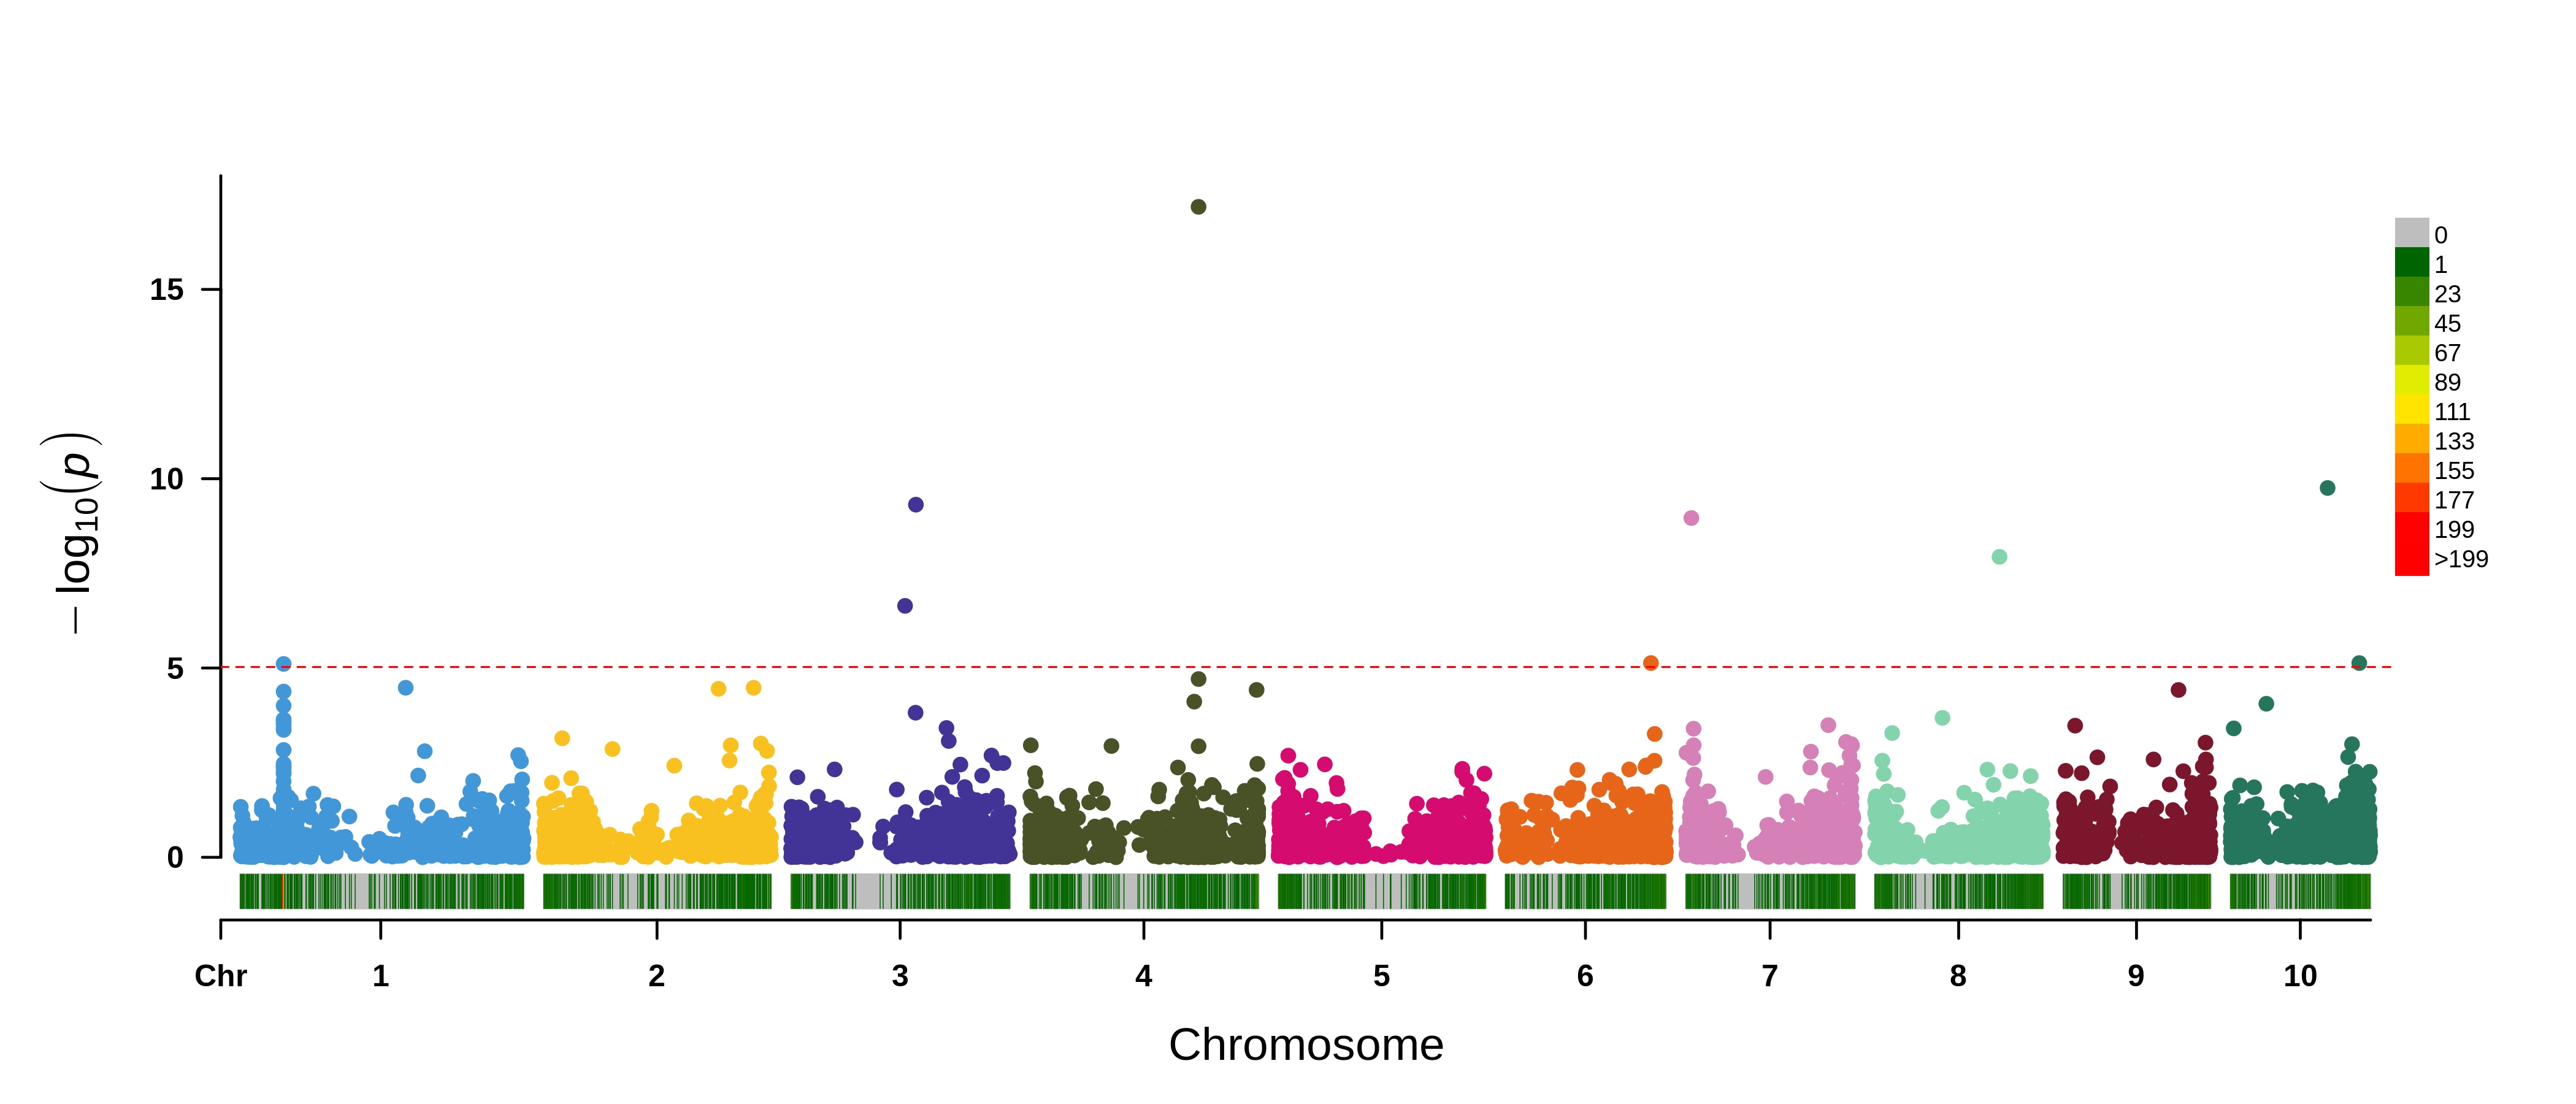
eQTL results for p1 which is on chromosome 1. SNP density plotted on the x-axis.