4 Advanced views
4.1 Communicable period tab
In the Advanced views, the user can see the distribution of the communicable period. The mean is indicated. As the user changes the advanced setting, a new distribution will result.
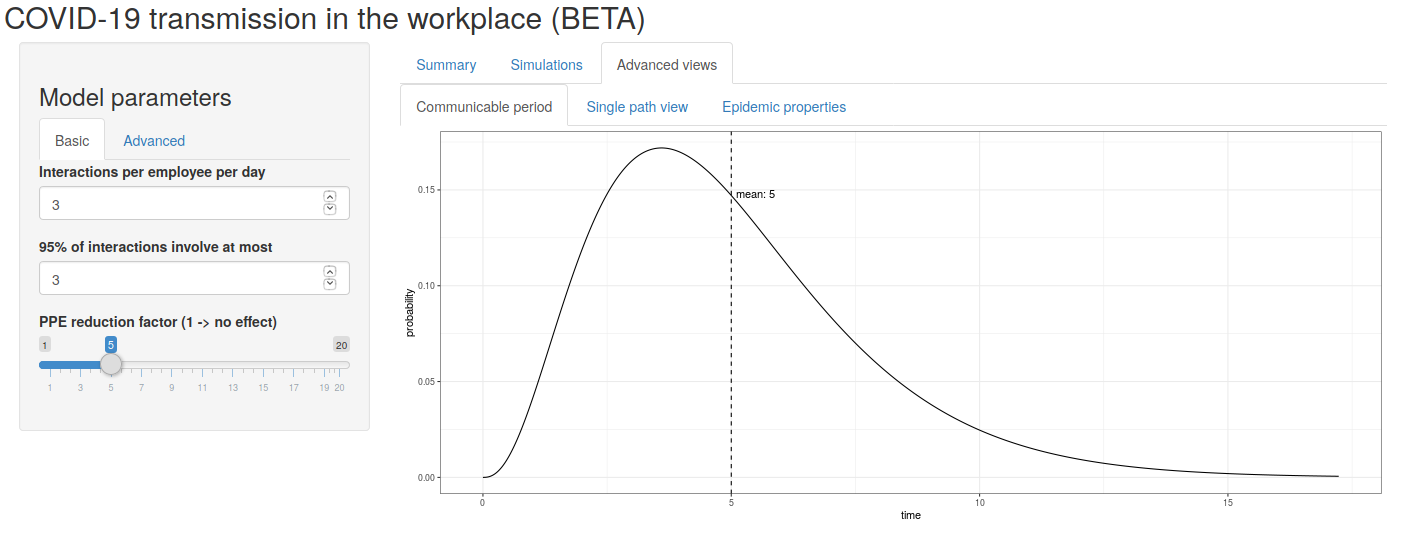
Figure 1: The communicable period distribtion
4.2 Single path view tab
The single path view allows the user to inspect each path from the simulation by selecting the path index (listed from 1 to the number of Monte Carlo samples). The result shows not only the life history of the population, but also the branching process itself from each infected person in the path.
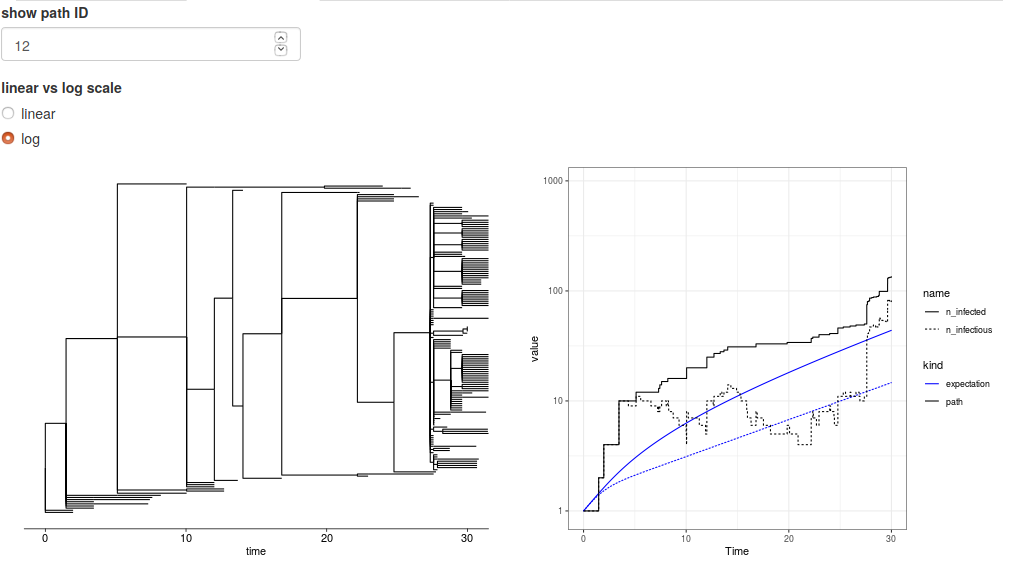
Figure 2: A view of a single outbreak
4.3 Epidemic properties tab
4.3.1 Number infected per individual
Once the user sets the parameters, the model implies a distribution for secondary infections from an infected person. In figure 2 we see the distribution from the default parameters. With these settings, we see that nearly 75% of the time and infected person fails to infect anyone.
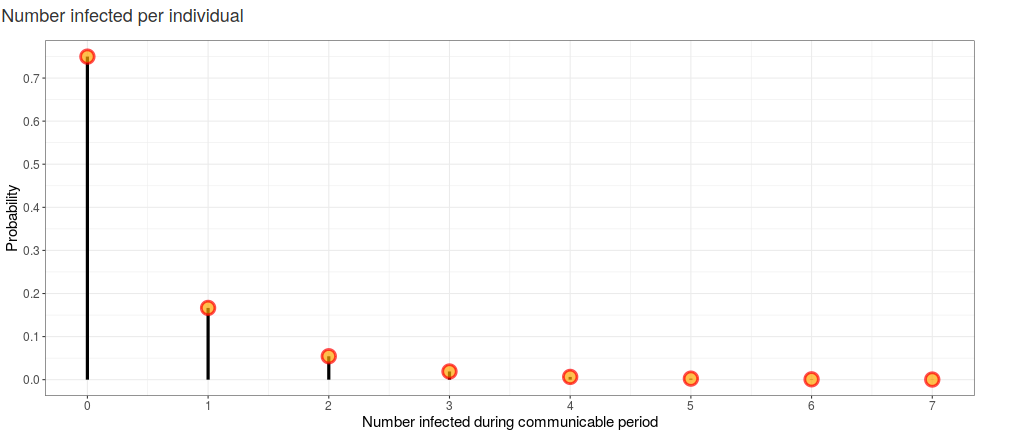
Figure 3: Distribution of number infected per infectious person
4.3.2 Path extintion
Given parameter choices, there is always a chance that the outbreak will fizzle out on its own. Even when the parameter choices lead to a non-zero Malthusian parameter, there is still a chance that the outbreak can go extinct through the randomness of the process. The plot in figure 3 shows the probability of extinction with the solid black line indicating \(R_0 =1\). When \(R_0<1\) extinction is guaranteed.
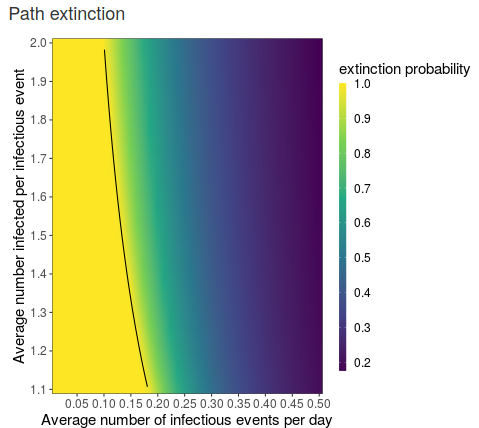
Figure 4: Path extinction
4.3.3 Expected component size at extinction
If extinction occurs, the user might wish to know the average size of the total population infected. In those cases where extinction is not guaranteed, the average size is only for those paths that do go extinct. When \(R_0>\) substantially larger than 1, the only way the path goes extinct is if the originally infected person fails to communicate the infection any further. If \(R_0\) is much less than one, typically an outbreak cannot get started. In both circumstances we expect the average size at extinction to be small, but with a low probability of extinction in the first scenario.
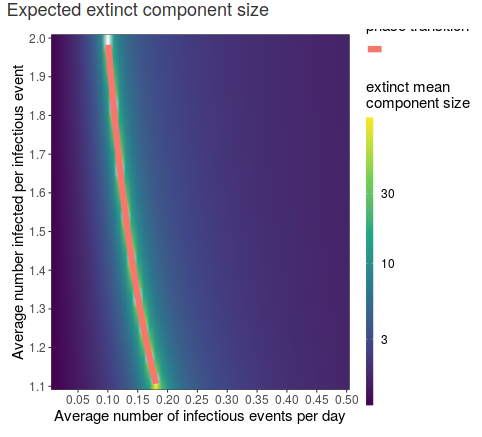
Figure 5: Component size
4.3.4 Malthusian parameter
A Malthusian parameter larger than zero implies that at outbreak will occur starting from an infected person. While some paths will so extinct, those that do not will grow exponentially. The rate of exponential growth is the Malthusian parameter.
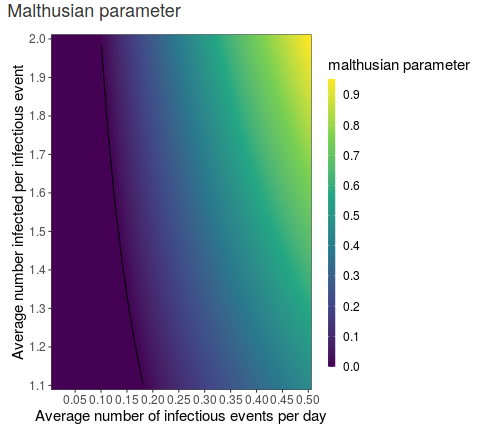
Figure 6: Component size
4.3.5 Expected number infected
The expected number infected of the the history of the infection is displayed in figure 6. Based on the user’s inputs, the user can see how the expected population grows in time. When \(R_0<1\), the expected infected population reaches a bound as all paths eventually go extinct. When the Malthusian parameter is larger than zero, the expect infected population grows exponentially in time.
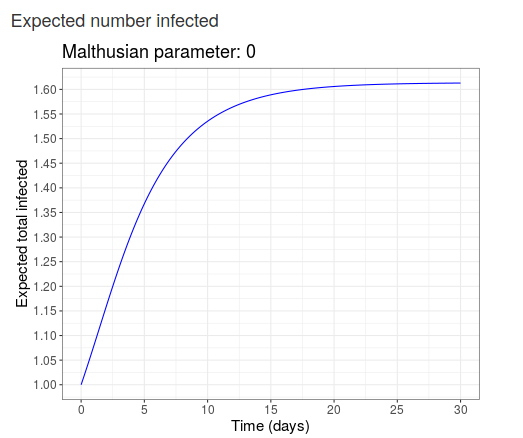
Figure 7: Expected size