2 Landing page
The COVID-19 transmission in the workplace app is a browser based and does not require specialized software on the user’s side to operate. Any web browser will work, but we recommend Chrome or Firefox.
When the user first loads the app, she will see the screen in Figure 1. The landing page initiates the app with some per-selected choices. We can see three panels in the figure: Model parameters, a tabbed section with Summary selected, and a graphical display area. Below panels there are two graphs. We will discuss each part of the landing page in detail.
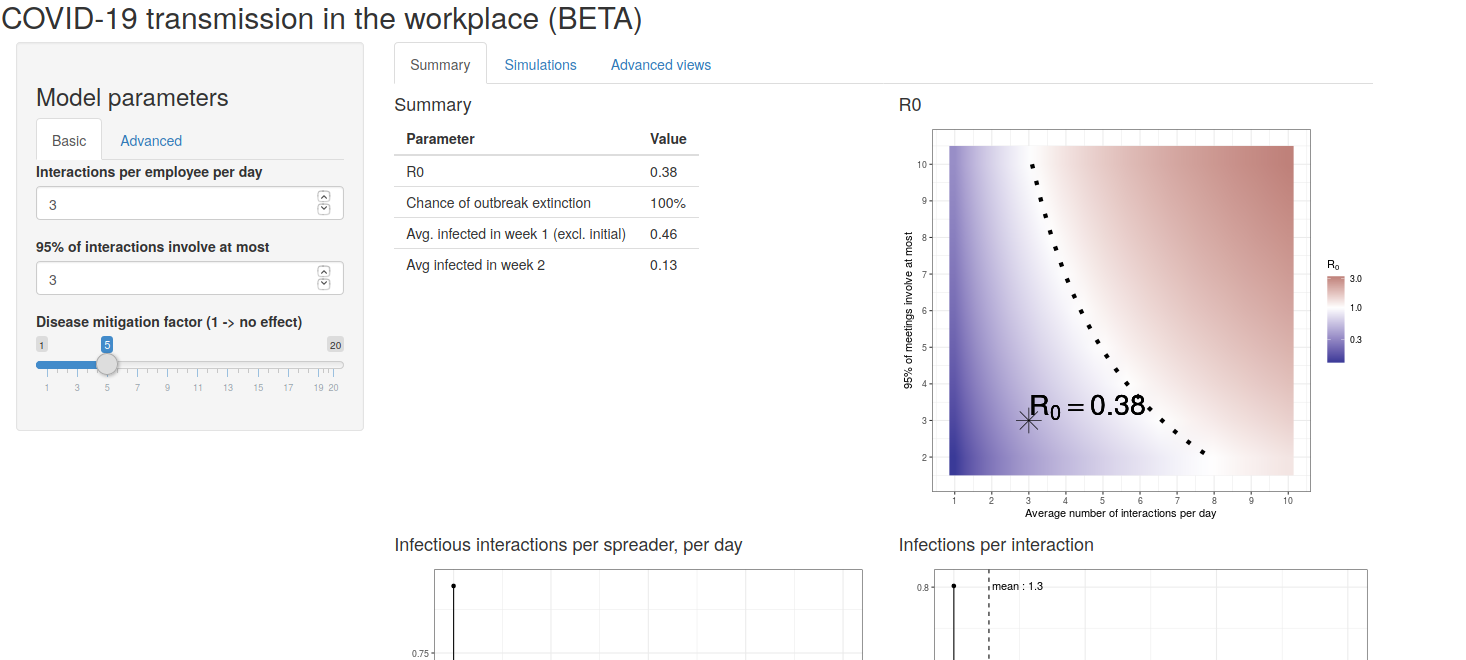
Figure 1: Landing page
2.1 Input dialogue box
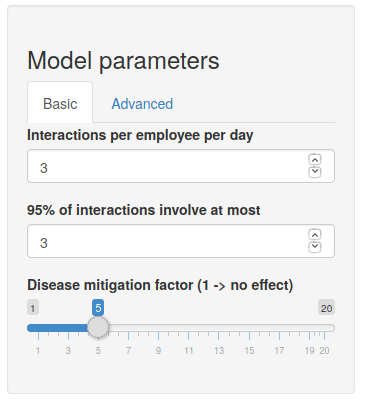
Figure 2: Model parameters (Basic tab)
The first panel contains a dialogue box which drive the entire output of the app. This area is where the user inputs the decision variables associated with the scenario that she wishes to examine. There are two tabs in the dialogue box: Basic and Advanced.
2.1.1 Basic tab
The basic tab controls three inputs:
- Number of interactions per employee per day.
- The 95% upper bound on interaction sizes.
- The disease mitigation factor.
These three inputs are the decision variables for the using the app.
2.1.1.1 Number of interactions per employee per day.
Covid-19 spreads through human-to-human interactions. Every time two or more people have a purposeful meeting or interaction there is a risk of transmission if one or more people in the interaction is infected. Based on the nature of the work in the workplace environment, and based on the restrictions that the decision maker plans to impose, the user can set the number of workplace interactions. Interactions include business meetings, elevator sharing, coffee discussions, work station conversations, and causal common space communication. The user is free to use her judgment about which types of interactions should count as a proper interaction.
2.1.1.2 The 95% upper bound on interaction sizes.
Another factor that drives the spread of Covid-19 is the number of people present during an interaction. The larger the number of people during the interaction, the greater the opportunity to spread the virus. Setting interaction sizes is another decision variable for the user. The app asks the user to input what she believes will be the largest meeting at the 1 chance in 20 level. For example, the user might envision that most conversations in the workplace would involve on two or three people, but that every once in a while, an interaction with 8 or more people occur. The user, based on knowledge of the type of work and the type of imposed restrictions, is asked to estimate the size of large meetings that occur infrequently, at the 1 chance in 20 level.
2.1.1.3 The disease mitigation factor
The decision variable that requires the most judgment is the mitigation factor. We see the mitigation factor as helping the user to set a range of possible outcomes for risk assessment across different parameter choices. The mitigation factor transforms the rate of employee interactions per day into the average number of infectious events per day arising from an infected individual. In the worst case, every time an infected employee interacts with a coworker a transmission would occur. We know that the worst case transmission rate is a gross overestimate of contagion. The app sets a base divisor (the environmental risk factor) in which, without any mitigation, 1 in 10 interactions lead to an infectious event. Since an infectious period typically last 5 days before isolation, and an infected individual would typically have 20 different opportunities to spread the infection during that period, a base divisor of 10 leads to an R0 of 2. The user can change the base divisor in the Advanced tab which we will explain further in the discussion on the Advanced tab settings. An R0 value of 2 matches the CDC and other external publications for the unmitigated R0 of Covid-19. The mitigation factor that the user chooses divides the employee interaction rate by the mitigation factor plus the base divisor. For example, suppose an office interaction rate of 8 interactions per day with only two people per interaction. Suppose that the decision maker asks that the staff wears a mask at all times and that the user estimates a mask specific mitigation factor of 3. That choice of 3 for the mitigation factor in the dialogue box would imply a total divisor of 13, giving 0.62 infectious interactions per day from an infected person. Without the mask effect, in this example, the base divisor of 10 would yield an 0.8 infectious interactions per day. The mitigation factor in the workplace is controlled by social distancing, the wearing of masks, and other protective interventions. In Figure 3 we show the range of effect sizes that different mitigation efforts have on transmission rates. For instance, the median effect of surgical masks is to reduce the interaction rate by a factor of 3. The app adds these effects to the base divisor.
All of these factors are approximate and we leave the exact choice up to the user. We feel that the best way to use use the mitigation factor input is to create a range of scenarios based on the types of interventions that decision maker plans to invoke.
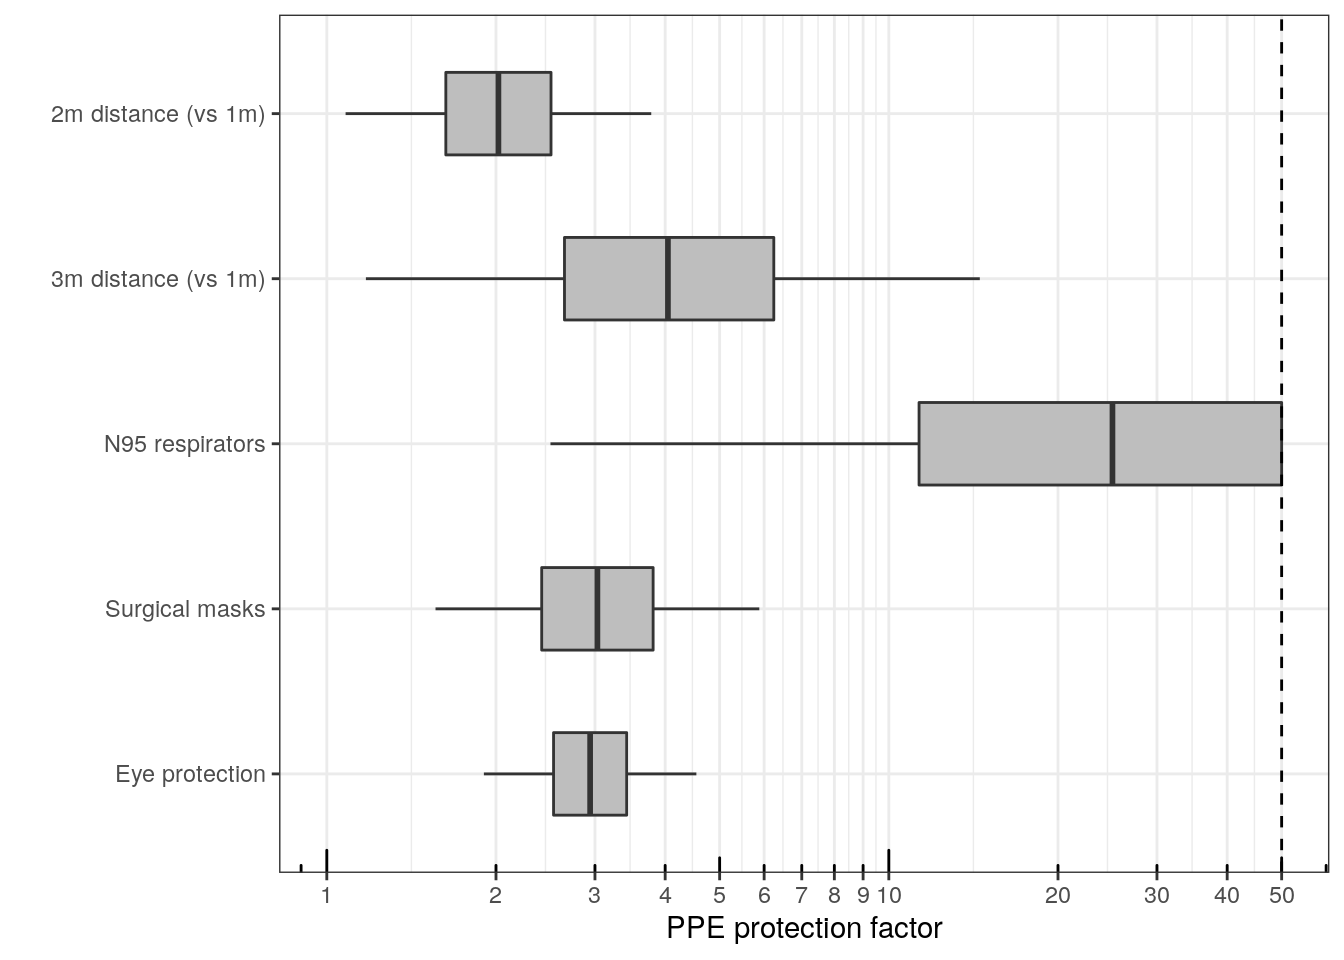
Figure 3: Mitigation factor ranges for intervention types
2.1.2 Advanced tab
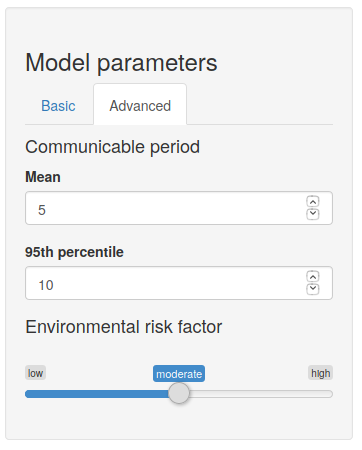
Figure 4: Model parameters (Advanced tab)
In Figure 4 we show the settings in the advanced tab. There are three inputs:
- The mean of the communicable period.
- The 95th percentile of the communicable period.
- The environmental risk factor.
2.1.2.1 Mean communicable period
The communicable period is the length of time that an infected person is infectious, not isolated, and potentially infecting others in the population. Every infected person’s communicable period is different—some will take a long time to display symptoms or never display symptoms, while others wil get sick and stay home almost immediately. Each circumstance leads to a different communicable time. To capture the randomness of the communicable period, the app uses a probability distribution function that always yields a positive number. The user can set the mean communicable period. The literature suggests that on average (mean) people display symptoms or remain infectious after 5 days. The app sets this mean to 5 days as a default but the user can change the mean as new data becomes available.
2.1.2.2 Mean communicable period
The probability distribution that the app needs two pieces of information for its definition. The second input the app uses is 95th percentile of the communicable period. This number tells us that only 1 in 20 people will have a communicable period longer than the input. These people are mostly the asymptomatic class. The app default is 10 days, which means that only 1 person in 20 will have a communicable period longer than 10 days.
2.1.2.3 The environmental risk factor
The environmental risk factor transforms the rate of employee interactions per day into the average number of infectious events per day arising from an infected individual without any mitigation. In the worst case, every time an infected employee interacts with a coworker a transmission would occur. We know that the worst case transmission rate is a gross overestimate of contagion. The environmental risk factor sets a base divisor for the employee interaction rate of 10—that means that without any mitigation 1 in 10 employee interactions with an infected person would lead to an infectious event. Since an infectious period typically last 5 days before isolation, and an infected individual would typically have 20 different opportunities to spread the infection during that period, a base divisor of 10 leads to an R0 of 2, in concordance with the literature’s assessment. The app labels this divisor as moderate. The user can change the base divisor in in this tab. At the low setting, the divisor is set to 15 and at the high setting the divisor is set to 5. These setting allow the user to further explore scenarios for risk assessment.
2.2 Summary box
The Summary box contains computed information from the model based on the parameter inputs. The basic reproduction number, \(R_0\), is shown in the first row. \(R_0\) is not a biological constant, a rate over time (\(R_0\) has no time units), or a measure of disease severity. \(R_0\) is the average number of people an infected person will infect during the communicable period and is therefore controlled by complicated interactions between biology, behaviour, and other environmental factors. The CDC estimates a central value of \(R_0 = 2.5\) for unmitigated interactions across society.
The next three rows give information about how the infection spreads over time. The second row gives the probability that, given the parameter choices, the outbreak will eventual go extinct on its own. If \(R_0<1\) extinction occurs 100% of the time. The last two rows show the expected size of the population after week 1 and week 2 respectively, excluding the initially infected individual who arrived in the workplace.
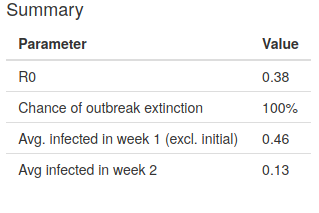
Figure 5: The Summary box
2.3 The R0 plot
Each parameter choice leads to a different basic reproduction number, \(R_0\). This plot shows \(R_0\) in the two dimensions of number of interactions per employee per day and The 95% upper bound on interaction sizes. The user’s specific choice appears as a star in the plot.
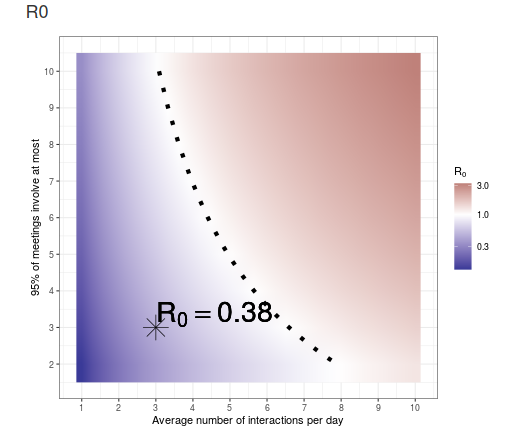
Figure 6: The R0 plot
2.4 The Probability plots
Underneath the main tab area on the landing page, the user will find two probability plots which show the probability of infectious events per day and, given that an event has occurred, the probability of the number of people infected during the event. These plots update based on the user’s choices.
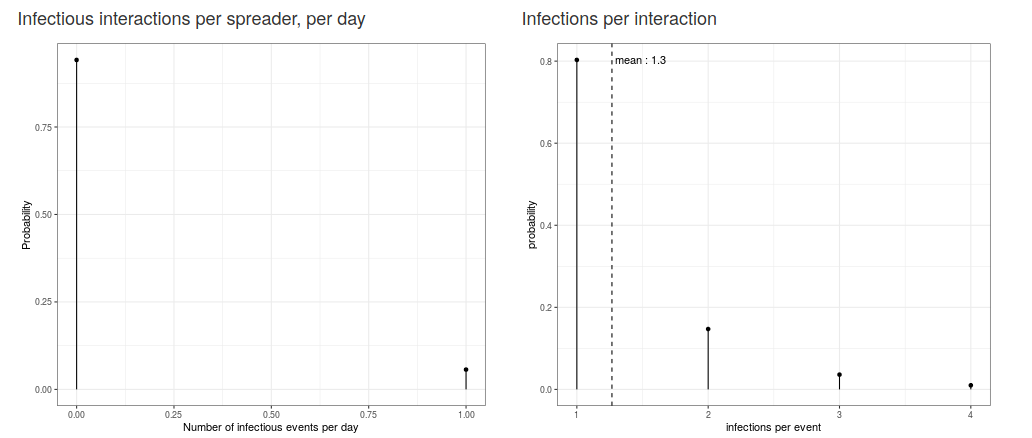
Figure 7: Probability plots