7.1 Introduction
7.1.1 Communicating Results (Reproducibly)
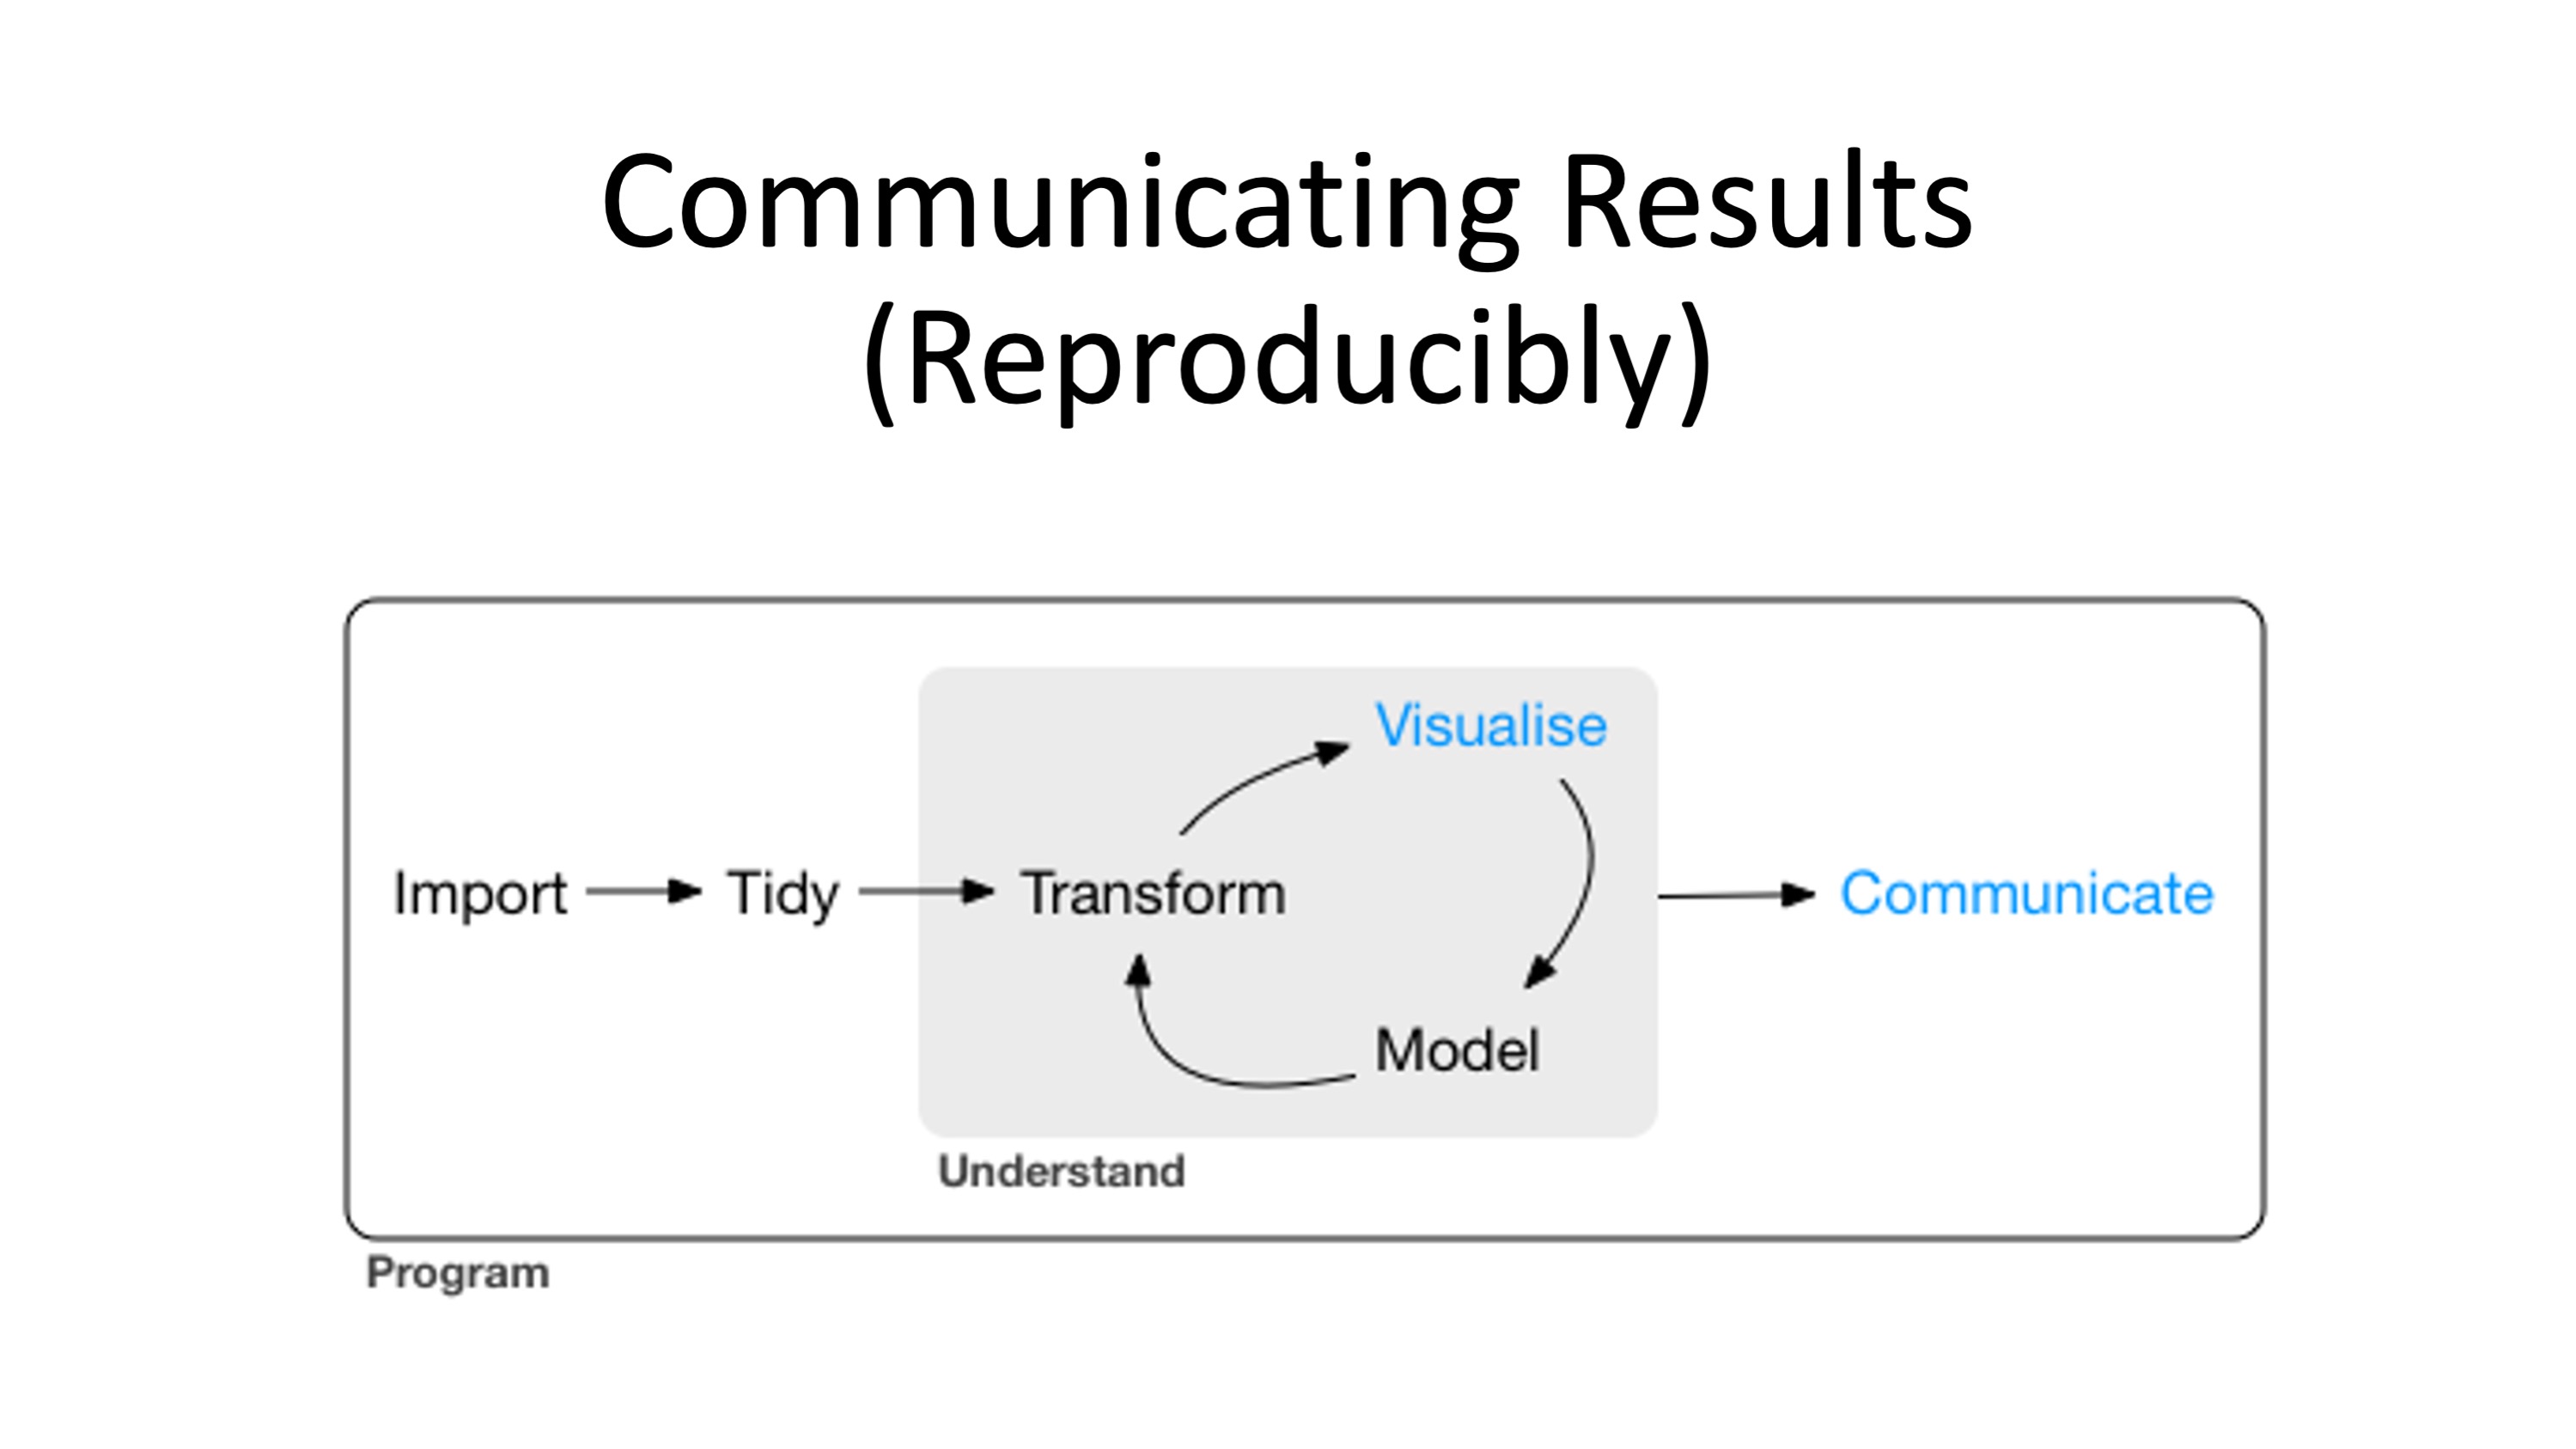
So far, you’ve learned the tools to get your data into R, tidy it into a form convenient for analysis, and then understand your data through transformation and visualization we have not covered modelling (The goal of a model is to provide a simple low-dimensional summary of a dataset. Ideally, the model will capture true “signals” (i.e. patterns generated by the phenomenon of interest), and ignore “noise” (i.e. random variation that you’re not interested in)). However, it doesn’t matter how great your analysis is unless you can explain it to others and provide your analysis in a way that is reproducibly by others: you need to communicate your results.
Data analysis reports
Data analysts tend to write a lot of reports, describing their analyses and results, for their collaborators or to document their work for future reference.
Many new users begin by first writing a single R script containing all of their work, and then share the analysis by emailing the script and various graphs as attachments. But this can be cumbersome, requiring a lengthy discussion to explain which attachment was which result.
Writing formal reports with Word or LaTeX can simplify this process by incorporating both the analysis report and output graphs into a single document. But tweaking formatting to make figures look correct and fixing obnoxious page breaks can be tedious and lead to a lengthly “whack-a-mole” game of fixing new mistakes resulting from a single formatting change.
Creating a web page (as an html file) using R Markdown makes things easier. The report can be one long stream, so tall figures that wouldn’t ordinarily fit on one page can be kept at full size and easier to read, since the reader can simply keep scrolling. Additionally, the formatting of and R Markdown document is simple and easy to modify, allowing you to spend more time on your analyses instead of writing reports.
Literate programming Ideally, such analysis reports are reproducible documents: If an error is discovered, or if some additional subjects are added to the data, you can just re-compile the report and get the new or corrected results rather than having to reconstruct figures, paste them into a Word document, and hand-edit various detailed results.
The key R package here is knitr. It allows you to create a document that is a mixture of text and chunks of code. When the document is processed by knitr, chunks of code will be executed, and graphs or other results will be inserted into the final document.
This sort of idea has been called “literate programming.”
knitr allows you to mix basically any type of text with code from different programming languages, but we recommend that you use R Markdown, which mixes Markdown with R. Markdown is a light-weight mark-up language for creating web pages.