Chapter 2 Exploratory Analysis
2.1 Descriptive [Table 1]
dd2 <- d2 %>%
  st_set_geometry(NULL) %>%
  mutate(id = seq(1:n()),
         time = 0,
         work_out = factor(ifelse(as.numeric(main_act_ec)>0 & as.numeric(main_act_ec)<7, "outside", "inside")),
         main_act_ec = as.factor(main_act_ec),
         edad = as.numeric(edad)) %>%
  #filter(complete.cases(.)) %>%
  as.data.frame()

t1 <- dd2 %>%
  dplyr::select(area, comm, edad, age_cat, nm_sex, nm_level_study, main_act_ec,work_out,
                viaje_ult_mes,TREATMENT,
                resultado_micro, especie_micro, fever,temp_axilar,hist_fever,SEROPOSITIVE)

library(table1)
table1(~. | SEROPOSITIVE, data = t1)| Negative (N=917) |
Positive (N=873) |
Overall (N=1790) |
|
|---|---|---|---|
| area | |||
| 0_periurban | 481 (52.5%) | 304 (34.8%) | 785 (43.9%) |
| 1_rural | 436 (47.5%) | 569 (65.2%) | 1005 (56.1%) |
| comm | |||
| 501 | 165 (18.0%) | 85 (9.7%) | 250 (14.0%) |
| 502 | 132 (14.4%) | 141 (16.2%) | 273 (15.3%) |
| 503 | 184 (20.1%) | 78 (8.9%) | 262 (14.6%) |
| 901 | 6 (0.7%) | 41 (4.7%) | 47 (2.6%) |
| 902 | 45 (4.9%) | 134 (15.3%) | 179 (10.0%) |
| 903 | 18 (2.0%) | 40 (4.6%) | 58 (3.2%) |
| 904 | 144 (15.7%) | 126 (14.4%) | 270 (15.1%) |
| 905 | 67 (7.3%) | 30 (3.4%) | 97 (5.4%) |
| 906 | 84 (9.2%) | 82 (9.4%) | 166 (9.3%) |
| 907 | 72 (7.9%) | 116 (13.3%) | 188 (10.5%) |
| edad | |||
| Mean (SD) | 20.6 (18.8) | 37.8 (21.8) | 29.0 (22.0) |
| Median [Min, Max] | 13.0 [0, 117] | 37.0 [1.00, 92.0] | 24.0 [0, 117] |
| age_cat | |||
| (-Inf,5] | 147 (16.0%) | 31 (3.6%) | 178 (9.9%) |
| (5,15] | 405 (44.2%) | 163 (18.7%) | 568 (31.7%) |
| (15,30] | 148 (16.1%) | 151 (17.3%) | 299 (16.7%) |
| (30,50] | 126 (13.7%) | 262 (30.0%) | 388 (21.7%) |
| (50, Inf] | 91 (9.9%) | 266 (30.5%) | 357 (19.9%) |
| nm_sex | |||
| 0_female | 536 (58.5%) | 437 (50.1%) | 973 (54.4%) |
| 1_male | 381 (41.5%) | 436 (49.9%) | 817 (45.6%) |
| nm_level_study | |||
| 1 | 67 (7.3%) | 69 (7.9%) | 136 (7.6%) |
| 2 | 88 (9.6%) | 16 (1.8%) | 104 (5.8%) |
| 3 | 323 (35.2%) | 304 (34.8%) | 627 (35.0%) |
| 4 | 90 (9.8%) | 205 (23.5%) | 295 (16.5%) |
| 5 | 167 (18.2%) | 149 (17.1%) | 316 (17.7%) |
| 6 | 77 (8.4%) | 60 (6.9%) | 137 (7.7%) |
| 7 | 12 (1.3%) | 4 (0.5%) | 16 (0.9%) |
| 8 | 12 (1.3%) | 9 (1.0%) | 21 (1.2%) |
| 9 | 7 (0.8%) | 1 (0.1%) | 8 (0.4%) |
| 10 | 9 (1.0%) | 6 (0.7%) | 15 (0.8%) |
| 11 | 0 (0%) | 1 (0.1%) | 1 (0.1%) |
| 9999 | 65 (7.1%) | 49 (5.6%) | 114 (6.4%) |
| main_act_ec | |||
| 0 | 90 (9.8%) | 55 (6.3%) | 145 (8.1%) |
| 1 | 22 (2.4%) | 24 (2.7%) | 46 (2.6%) |
| 2 | 0 (0%) | 2 (0.2%) | 2 (0.1%) |
| 3 | 5 (0.5%) | 16 (1.8%) | 21 (1.2%) |
| 4 | 0 (0%) | 1 (0.1%) | 1 (0.1%) |
| 5 | 71 (7.7%) | 340 (38.9%) | 411 (23.0%) |
| 6 | 21 (2.3%) | 10 (1.1%) | 31 (1.7%) |
| 7 | 152 (16.6%) | 163 (18.7%) | 315 (17.6%) |
| 8 | 453 (49.4%) | 177 (20.3%) | 630 (35.2%) |
| 9 | 9 (1.0%) | 8 (0.9%) | 17 (0.9%) |
| 10 | 51 (5.6%) | 42 (4.8%) | 93 (5.2%) |
| 11 | 31 (3.4%) | 26 (3.0%) | 57 (3.2%) |
| 88 | 12 (1.3%) | 9 (1.0%) | 21 (1.2%) |
| work_out | |||
| inside | 798 (87.0%) | 480 (55.0%) | 1278 (71.4%) |
| outside | 119 (13.0%) | 393 (45.0%) | 512 (28.6%) |
| viaje_ult_mes | |||
| 0 | 794 (86.6%) | 642 (73.5%) | 1436 (80.2%) |
| 1 | 120 (13.1%) | 229 (26.2%) | 349 (19.5%) |
| 9999 | 3 (0.3%) | 2 (0.2%) | 5 (0.3%) |
| TREATMENT | |||
| No treatment | 917 (100%) | 0 (0%) | 917 (51.2%) |
| Treatment | 0 (0%) | 873 (100%) | 873 (48.8%) |
| resultado_micro | |||
| 0 | 894 (97.5%) | 835 (95.6%) | 1729 (96.6%) |
| 1 | 12 (1.3%) | 26 (3.0%) | 38 (2.1%) |
| Missing | 11 (1.2%) | 12 (1.4%) | 23 (1.3%) |
| especie_micro | |||
| 0 | 472 (51.5%) | 296 (33.9%) | 768 (42.9%) |
| 1 | 4 (0.4%) | 4 (0.5%) | 8 (0.4%) |
| 2 | 6 (0.7%) | 21 (2.4%) | 27 (1.5%) |
| Missing | 435 (47.4%) | 552 (63.2%) | 987 (55.1%) |
| fever | |||
| 0 | 900 (98.1%) | 864 (99.0%) | 1764 (98.5%) |
| 1 | 17 (1.9%) | 9 (1.0%) | 26 (1.5%) |
| temp_axilar | |||
| Mean (SD) | 36.2 (0.490) | 36.2 (0.471) | 36.2 (0.481) |
| Median [Min, Max] | 36.1 [35.5, 39.3] | 36.1 [35.5, 39.3] | 36.1 [35.5, 39.3] |
| hist_fever | |||
| Mean (SD) | 0.105 (0.306) | 0.140 (0.347) | 0.122 (0.327) |
| Median [Min, Max] | 0 [0, 1.00] | 0 [0, 1.00] | 0 [0, 1.00] |
| SEROPOSITIVE | |||
| Negative | 917 (100%) | 0 (0%) | 917 (51.2%) |
| Positive | 0 (0%) | 873 (100%) | 873 (48.8%) |
| 0_periurban (N=785) |
1_rural (N=1005) |
Overall (N=1790) |
|
|---|---|---|---|
| area | |||
| 0_periurban | 785 (100%) | 0 (0%) | 785 (43.9%) |
| 1_rural | 0 (0%) | 1005 (100%) | 1005 (56.1%) |
| comm | |||
| 501 | 250 (31.8%) | 0 (0%) | 250 (14.0%) |
| 502 | 273 (34.8%) | 0 (0%) | 273 (15.3%) |
| 503 | 262 (33.4%) | 0 (0%) | 262 (14.6%) |
| 901 | 0 (0%) | 47 (4.7%) | 47 (2.6%) |
| 902 | 0 (0%) | 179 (17.8%) | 179 (10.0%) |
| 903 | 0 (0%) | 58 (5.8%) | 58 (3.2%) |
| 904 | 0 (0%) | 270 (26.9%) | 270 (15.1%) |
| 905 | 0 (0%) | 97 (9.7%) | 97 (5.4%) |
| 906 | 0 (0%) | 166 (16.5%) | 166 (9.3%) |
| 907 | 0 (0%) | 188 (18.7%) | 188 (10.5%) |
| edad | |||
| Mean (SD) | 30.6 (21.8) | 27.7 (22.2) | 29.0 (22.0) |
| Median [Min, Max] | 26.0 [0, 117] | 20.0 [0, 87.0] | 24.0 [0, 117] |
| age_cat | |||
| (-Inf,5] | 52 (6.6%) | 126 (12.5%) | 178 (9.9%) |
| (5,15] | 227 (28.9%) | 341 (33.9%) | 568 (31.7%) |
| (15,30] | 169 (21.5%) | 130 (12.9%) | 299 (16.7%) |
| (30,50] | 176 (22.4%) | 212 (21.1%) | 388 (21.7%) |
| (50, Inf] | 161 (20.5%) | 196 (19.5%) | 357 (19.9%) |
| nm_sex | |||
| 0_female | 461 (58.7%) | 512 (50.9%) | 973 (54.4%) |
| 1_male | 324 (41.3%) | 493 (49.1%) | 817 (45.6%) |
| nm_level_study | |||
| 1 | 24 (3.1%) | 112 (11.1%) | 136 (7.6%) |
| 2 | 32 (4.1%) | 72 (7.2%) | 104 (5.8%) |
| 3 | 260 (33.1%) | 367 (36.5%) | 627 (35.0%) |
| 4 | 108 (13.8%) | 187 (18.6%) | 295 (16.5%) |
| 5 | 199 (25.4%) | 117 (11.6%) | 316 (17.7%) |
| 6 | 111 (14.1%) | 26 (2.6%) | 137 (7.7%) |
| 7 | 15 (1.9%) | 1 (0.1%) | 16 (0.9%) |
| 8 | 19 (2.4%) | 2 (0.2%) | 21 (1.2%) |
| 9 | 7 (0.9%) | 1 (0.1%) | 8 (0.4%) |
| 10 | 4 (0.5%) | 11 (1.1%) | 15 (0.8%) |
| 11 | 1 (0.1%) | 0 (0%) | 1 (0.1%) |
| 9999 | 5 (0.6%) | 109 (10.8%) | 114 (6.4%) |
| main_act_ec | |||
| 0 | 0 (0%) | 145 (14.4%) | 145 (8.1%) |
| 1 | 45 (5.7%) | 1 (0.1%) | 46 (2.6%) |
| 2 | 1 (0.1%) | 1 (0.1%) | 2 (0.1%) |
| 3 | 5 (0.6%) | 16 (1.6%) | 21 (1.2%) |
| 4 | 0 (0%) | 1 (0.1%) | 1 (0.1%) |
| 5 | 20 (2.5%) | 391 (38.9%) | 411 (23.0%) |
| 6 | 26 (3.3%) | 5 (0.5%) | 31 (1.7%) |
| 7 | 247 (31.5%) | 68 (6.8%) | 315 (17.6%) |
| 8 | 274 (34.9%) | 356 (35.4%) | 630 (35.2%) |
| 9 | 17 (2.2%) | 0 (0%) | 17 (0.9%) |
| 10 | 93 (11.8%) | 0 (0%) | 93 (5.2%) |
| 11 | 57 (7.3%) | 0 (0%) | 57 (3.2%) |
| 88 | 0 (0%) | 21 (2.1%) | 21 (1.2%) |
| work_out | |||
| inside | 688 (87.6%) | 590 (58.7%) | 1278 (71.4%) |
| outside | 97 (12.4%) | 415 (41.3%) | 512 (28.6%) |
| viaje_ult_mes | |||
| 0 | 768 (97.8%) | 668 (66.5%) | 1436 (80.2%) |
| 1 | 17 (2.2%) | 332 (33.0%) | 349 (19.5%) |
| 9999 | 0 (0%) | 5 (0.5%) | 5 (0.3%) |
| TREATMENT | |||
| No treatment | 481 (61.3%) | 436 (43.4%) | 917 (51.2%) |
| Treatment | 304 (38.7%) | 569 (56.6%) | 873 (48.8%) |
| resultado_micro | |||
| 0 | 742 (94.5%) | 987 (98.2%) | 1729 (96.6%) |
| 1 | 20 (2.5%) | 18 (1.8%) | 38 (2.1%) |
| Missing | 23 (2.9%) | 0 (0%) | 23 (1.3%) |
| especie_micro | |||
| 0 | 768 (97.8%) | 0 (0%) | 768 (42.9%) |
| 1 | 3 (0.4%) | 5 (0.5%) | 8 (0.4%) |
| 2 | 14 (1.8%) | 13 (1.3%) | 27 (1.5%) |
| Missing | 0 (0%) | 987 (98.2%) | 987 (55.1%) |
| fever | |||
| 0 | 771 (98.2%) | 993 (98.8%) | 1764 (98.5%) |
| 1 | 14 (1.8%) | 12 (1.2%) | 26 (1.5%) |
| temp_axilar | |||
| Mean (SD) | 36.2 (0.467) | 36.1 (0.487) | 36.2 (0.481) |
| Median [Min, Max] | 36.3 [35.5, 39.3] | 36.0 [35.5, 39.2] | 36.1 [35.5, 39.3] |
| hist_fever | |||
| Mean (SD) | 0.0841 (0.278) | 0.151 (0.358) | 0.122 (0.327) |
| Median [Min, Max] | 0 [0, 1.00] | 0 [0, 1.00] | 0 [0, 1.00] |
| SEROPOSITIVE | |||
| Negative | 481 (61.3%) | 436 (43.4%) | 917 (51.2%) |
| Positive | 304 (38.7%) | 569 (56.6%) | 873 (48.8%) |
library(tableone)
CreateTableOne(vars = names(t1)[1:12], strata = "SEROPOSITIVE", data = t1,
               factorVars = names(t1)[c(1:2,4:10,12)])
## Stratified by SEROPOSITIVE
## Negative Positive p test
## n 917 873
## area = 1_rural (%) 436 (47.5) 569 ( 65.2) <0.001
## comm (%) <0.001
## 501 165 (18.0) 85 ( 9.7)
## 502 132 (14.4) 141 ( 16.2)
## 503 184 (20.1) 78 ( 8.9)
## 901 6 ( 0.7) 41 ( 4.7)
## 902 45 ( 4.9) 134 ( 15.3)
## 903 18 ( 2.0) 40 ( 4.6)
## 904 144 (15.7) 126 ( 14.4)
## 905 67 ( 7.3) 30 ( 3.4)
## 906 84 ( 9.2) 82 ( 9.4)
## 907 72 ( 7.9) 116 ( 13.3)
## edad (mean (SD)) 20.64 (18.82) 37.76 (21.78) <0.001
## age_cat (%) <0.001
## (-Inf,5] 147 (16.0) 31 ( 3.6)
## (5,15] 405 (44.2) 163 ( 18.7)
## (15,30] 148 (16.1) 151 ( 17.3)
## (30,50] 126 (13.7) 262 ( 30.0)
## (50, Inf] 91 ( 9.9) 266 ( 30.5)
## nm_sex = 1_male (%) 381 (41.5) 436 ( 49.9) <0.001
## nm_level_study (%) <0.001
## 1 67 ( 7.3) 69 ( 7.9)
## 2 88 ( 9.6) 16 ( 1.8)
## 3 323 (35.2) 304 ( 34.8)
## 4 90 ( 9.8) 205 ( 23.5)
## 5 167 (18.2) 149 ( 17.1)
## 6 77 ( 8.4) 60 ( 6.9)
## 7 12 ( 1.3) 4 ( 0.5)
## 8 12 ( 1.3) 9 ( 1.0)
## 9 7 ( 0.8) 1 ( 0.1)
## 10 9 ( 1.0) 6 ( 0.7)
## 11 0 ( 0.0) 1 ( 0.1)
## 9999 65 ( 7.1) 49 ( 5.6)
## main_act_ec (%) <0.001
## 0 90 ( 9.8) 55 ( 6.3)
## 1 22 ( 2.4) 24 ( 2.7)
## 2 0 ( 0.0) 2 ( 0.2)
## 3 5 ( 0.5) 16 ( 1.8)
## 4 0 ( 0.0) 1 ( 0.1)
## 5 71 ( 7.7) 340 ( 38.9)
## 6 21 ( 2.3) 10 ( 1.1)
## 7 152 (16.6) 163 ( 18.7)
## 8 453 (49.4) 177 ( 20.3)
## 9 9 ( 1.0) 8 ( 0.9)
## 10 51 ( 5.6) 42 ( 4.8)
## 11 31 ( 3.4) 26 ( 3.0)
## 88 12 ( 1.3) 9 ( 1.0)
## work_out = outside (%) 119 (13.0) 393 ( 45.0) <0.001
## viaje_ult_mes (%) <0.001
## 0 794 (86.6) 642 ( 73.5)
## 1 120 (13.1) 229 ( 26.2)
## 9999 3 ( 0.3) 2 ( 0.2)
## TREATMENT = Treatment (%) 0 ( 0.0) 873 (100.0) <0.001
## resultado_micro = 1 (%) 12 ( 1.3) 26 ( 3.0) 0.022
## especie_micro (%) <0.001
## 0 472 (97.9) 296 ( 92.2)
## 1 4 ( 0.8) 4 ( 1.2)
## 2 6 ( 1.2) 21 ( 6.5)2.2 Proportions
library(tidyverse)
library(viridis)
library(colorspace)

t1 %>%
  mutate(mm = ifelse(resultado_micro==1, "micro+", "micro-"),
         ss = ifelse(SEROPOSITIVE=="Positive", "sero+", "sero-"),
         out = paste0(mm, " | ",ss)) %>%
  filter(!is.na(resultado_micro)) %>%
  ggplot(aes(x = age_cat, fill = out)) +
  geom_bar(position = "fill") +
  scale_fill_discrete_sequential(palette="ag_Sunset") +
  labs(y = "proportion", x = "Age category", fill = "Outcome") +
  theme_bw() +
  facet_grid(~nm_sex)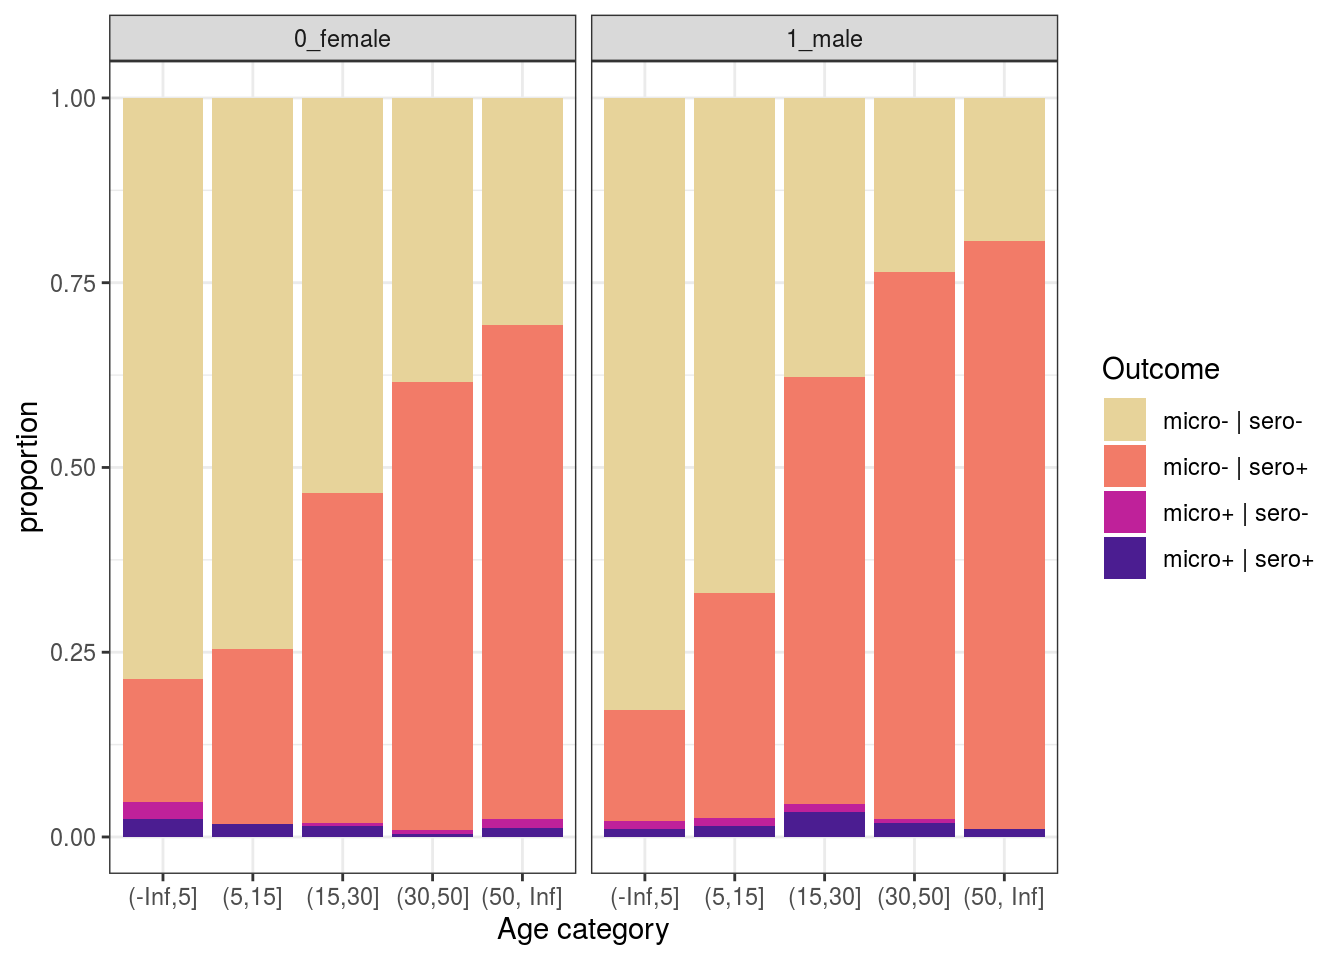
t1 %>%
  mutate(mm = ifelse(resultado_micro==1, "micro+", "micro-"),
         ss = ifelse(SEROPOSITIVE=="Positive", "sero+", "sero-"),
         out = paste0(mm, " | ",ss)) %>%
  filter(!is.na(resultado_micro)) %>%
  ggplot(aes(x = age_cat, fill = out)) +
  geom_bar(position = "fill") +
  scale_fill_discrete_sequential(palette="ag_Sunset") +
  labs(y = "proportion", x = "Age category", fill = "Outcome") +
  theme_bw() +
  facet_grid(~area)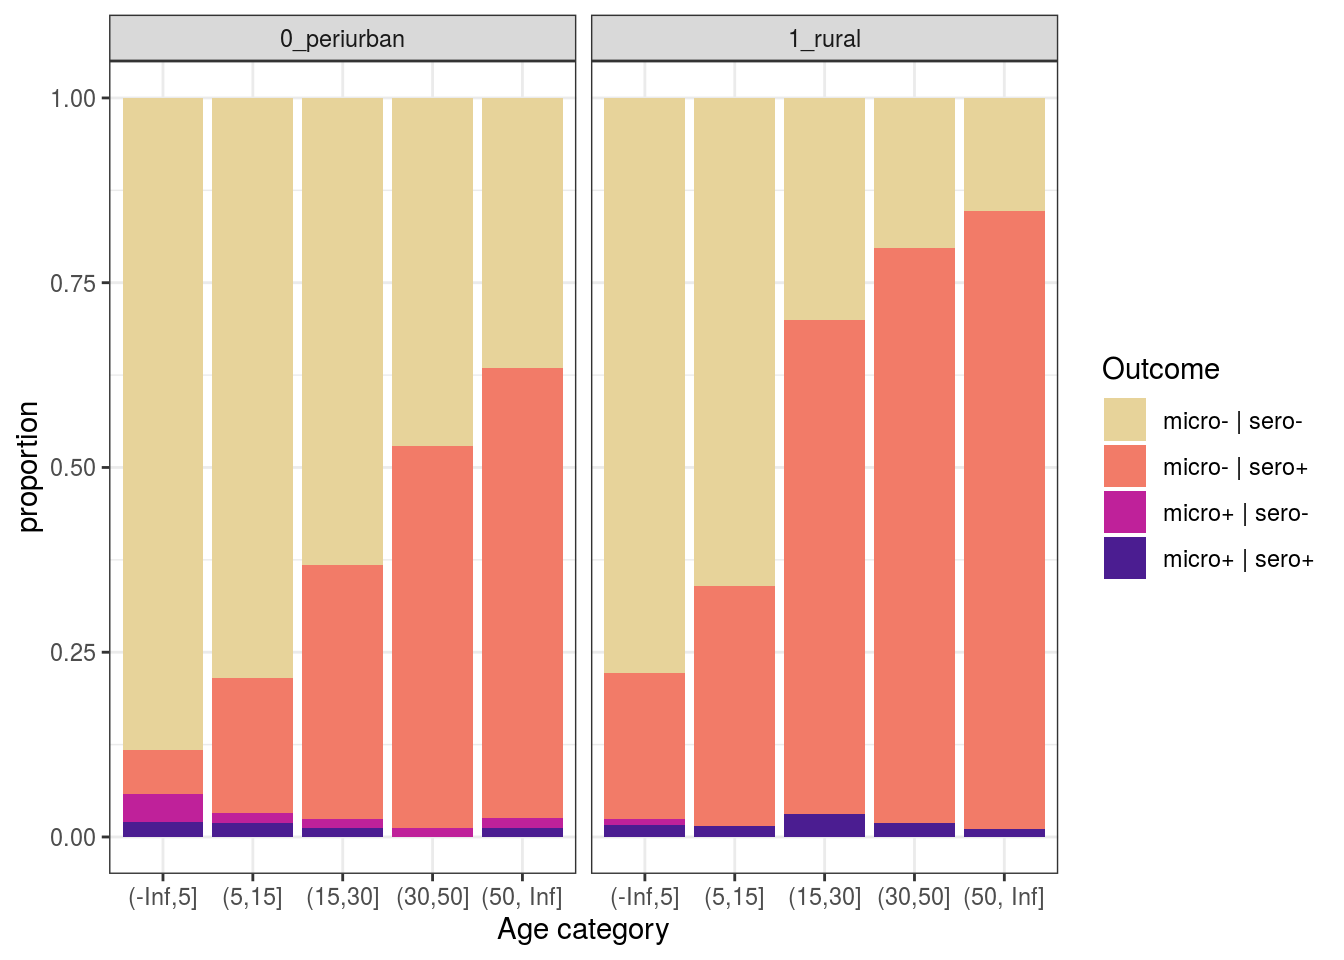
2.3 Maps
library(leaflet)

dat_ci_map <- d2 %>%
  group_by(id_house) %>%
  summarise(p = mean(sero, na.rm = T), area = first(area), age = mean(edad, na.rm = T)) %>%
  filter(!is.na(p)) %>%
  filter(!is.infinite(p)) %>%
  dplyr::mutate(lat = sf::st_coordinates(.)[,2],
                long = sf::st_coordinates(.)[,1])

pal <- colorBin("inferno", bins = seq(0,1,.1), reverse=T)

dat_ci_map %>%
  leaflet() %>%
  addTiles() %>%
  addCircles(lng = ~long, lat = ~lat, color = ~ pal(p),
             popup = paste("ID Household", dat_ci_map$id_house, "<br>",
                           "Area:", dat_ci_map$area, "<br>",
                           "Mean age:", dat_ci_map$age, "<br>",
                           "Prevalence:", dat_ci_map$p)) %>%
  addLegend("bottomright",
            pal = pal, values = ~p,
            title = "Prevalence") %>%
  addScaleBar(position = c("bottomleft"))