Chapter 3 DENGUE DATA
3.1 Init
library(tidyverse)
library(lubridate)
library(rEDM)
library(ISOweek)
library(stringr)
library(cowplot)
3.2 Data
PER_district <- read.csv("./_data/dengue_20211008_2.csv")

LOR_linelist <- read.csv("./_data/dengue_NOTI_SEM18_2021_clean.csv")
3.3 Exploration
3.3.1 PERU
PER_district %>%
  mutate(week_proto = str_pad(Semana, width = 2, pad = "0"),
         date_proto = paste0(Year,"-W", week_proto,"-1"),
         date = ISOweek2date(date_proto),
         yy = year(date),
         mm = month(date)) %>%
  group_by(yy, mm, Departamento) %>%
  summarise(tot_casos = sum(Casos)) %>%
  mutate(date = ymd(paste(yy,mm,"01", sep = "-"))) %>%
  filter(date < ymd("2021-10-01")) %>%
  ggplot(aes(x = date, y = tot_casos, col = log(tot_casos))) +
  scale_color_viridis_c(option = "rocket", direction = -1, na.value = "gray") +
  labs(title = "National data (DIC-2014 : SEP-2021)") +
  geom_line() +
  facet_wrap(.~Departamento, scales = "free", ncol = 4) +
  theme_bw() +
  theme(legend.position = "top")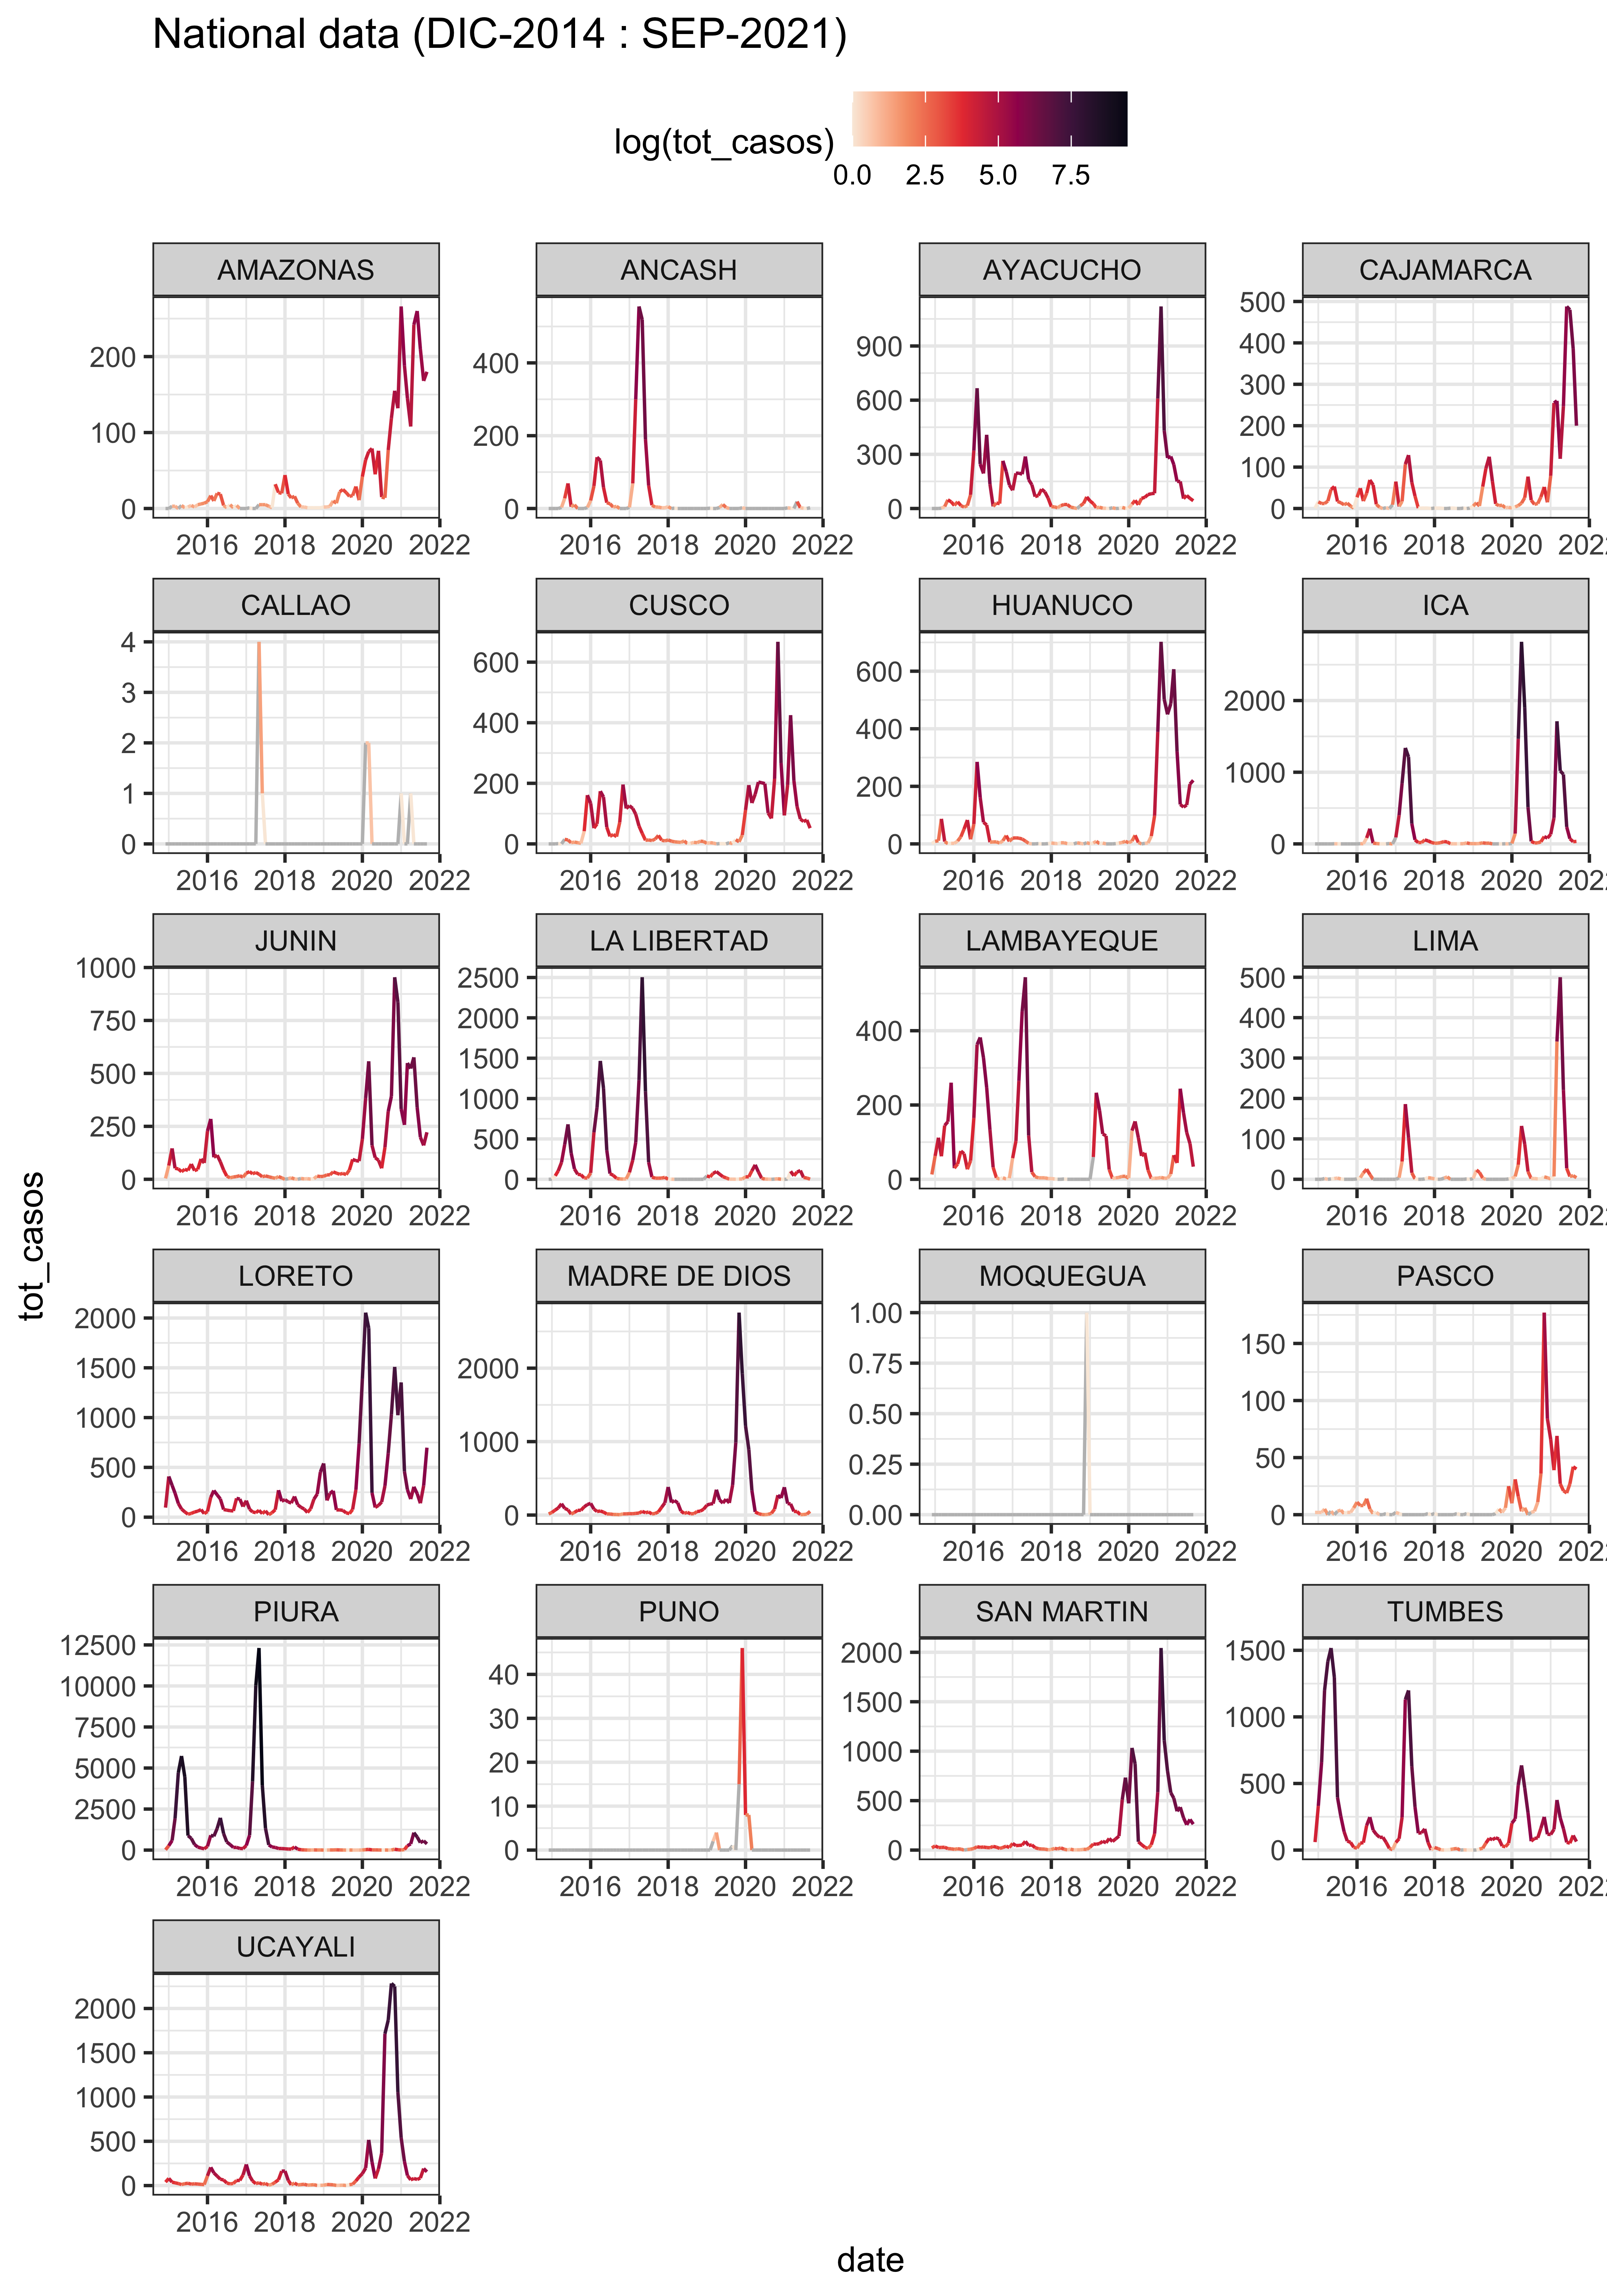
3.3.2 LORETO
LOR_linelist %>%
  #filter(tipo_dx != "D") %>%
  mutate(date = ymd(fecha_not),
         yy = year(date),
         mm = month(date)) %>%
  group_by(yy, mm, departam) %>%
  summarise(tot_casos = n()) %>%
  mutate(date = ymd(paste(yy,mm,"01", sep = "-"))) %>%
  ggplot(aes(x = date, y = tot_casos, col = log(tot_casos))) +
  scale_color_viridis_c(option = "rocket", direction = -1, na.value = "gray") +
  labs(title = "Loreto Regional data (JAN-2000 : MAY-2021)") +
  geom_line() +
  theme_bw() +
  theme(legend.position = "top")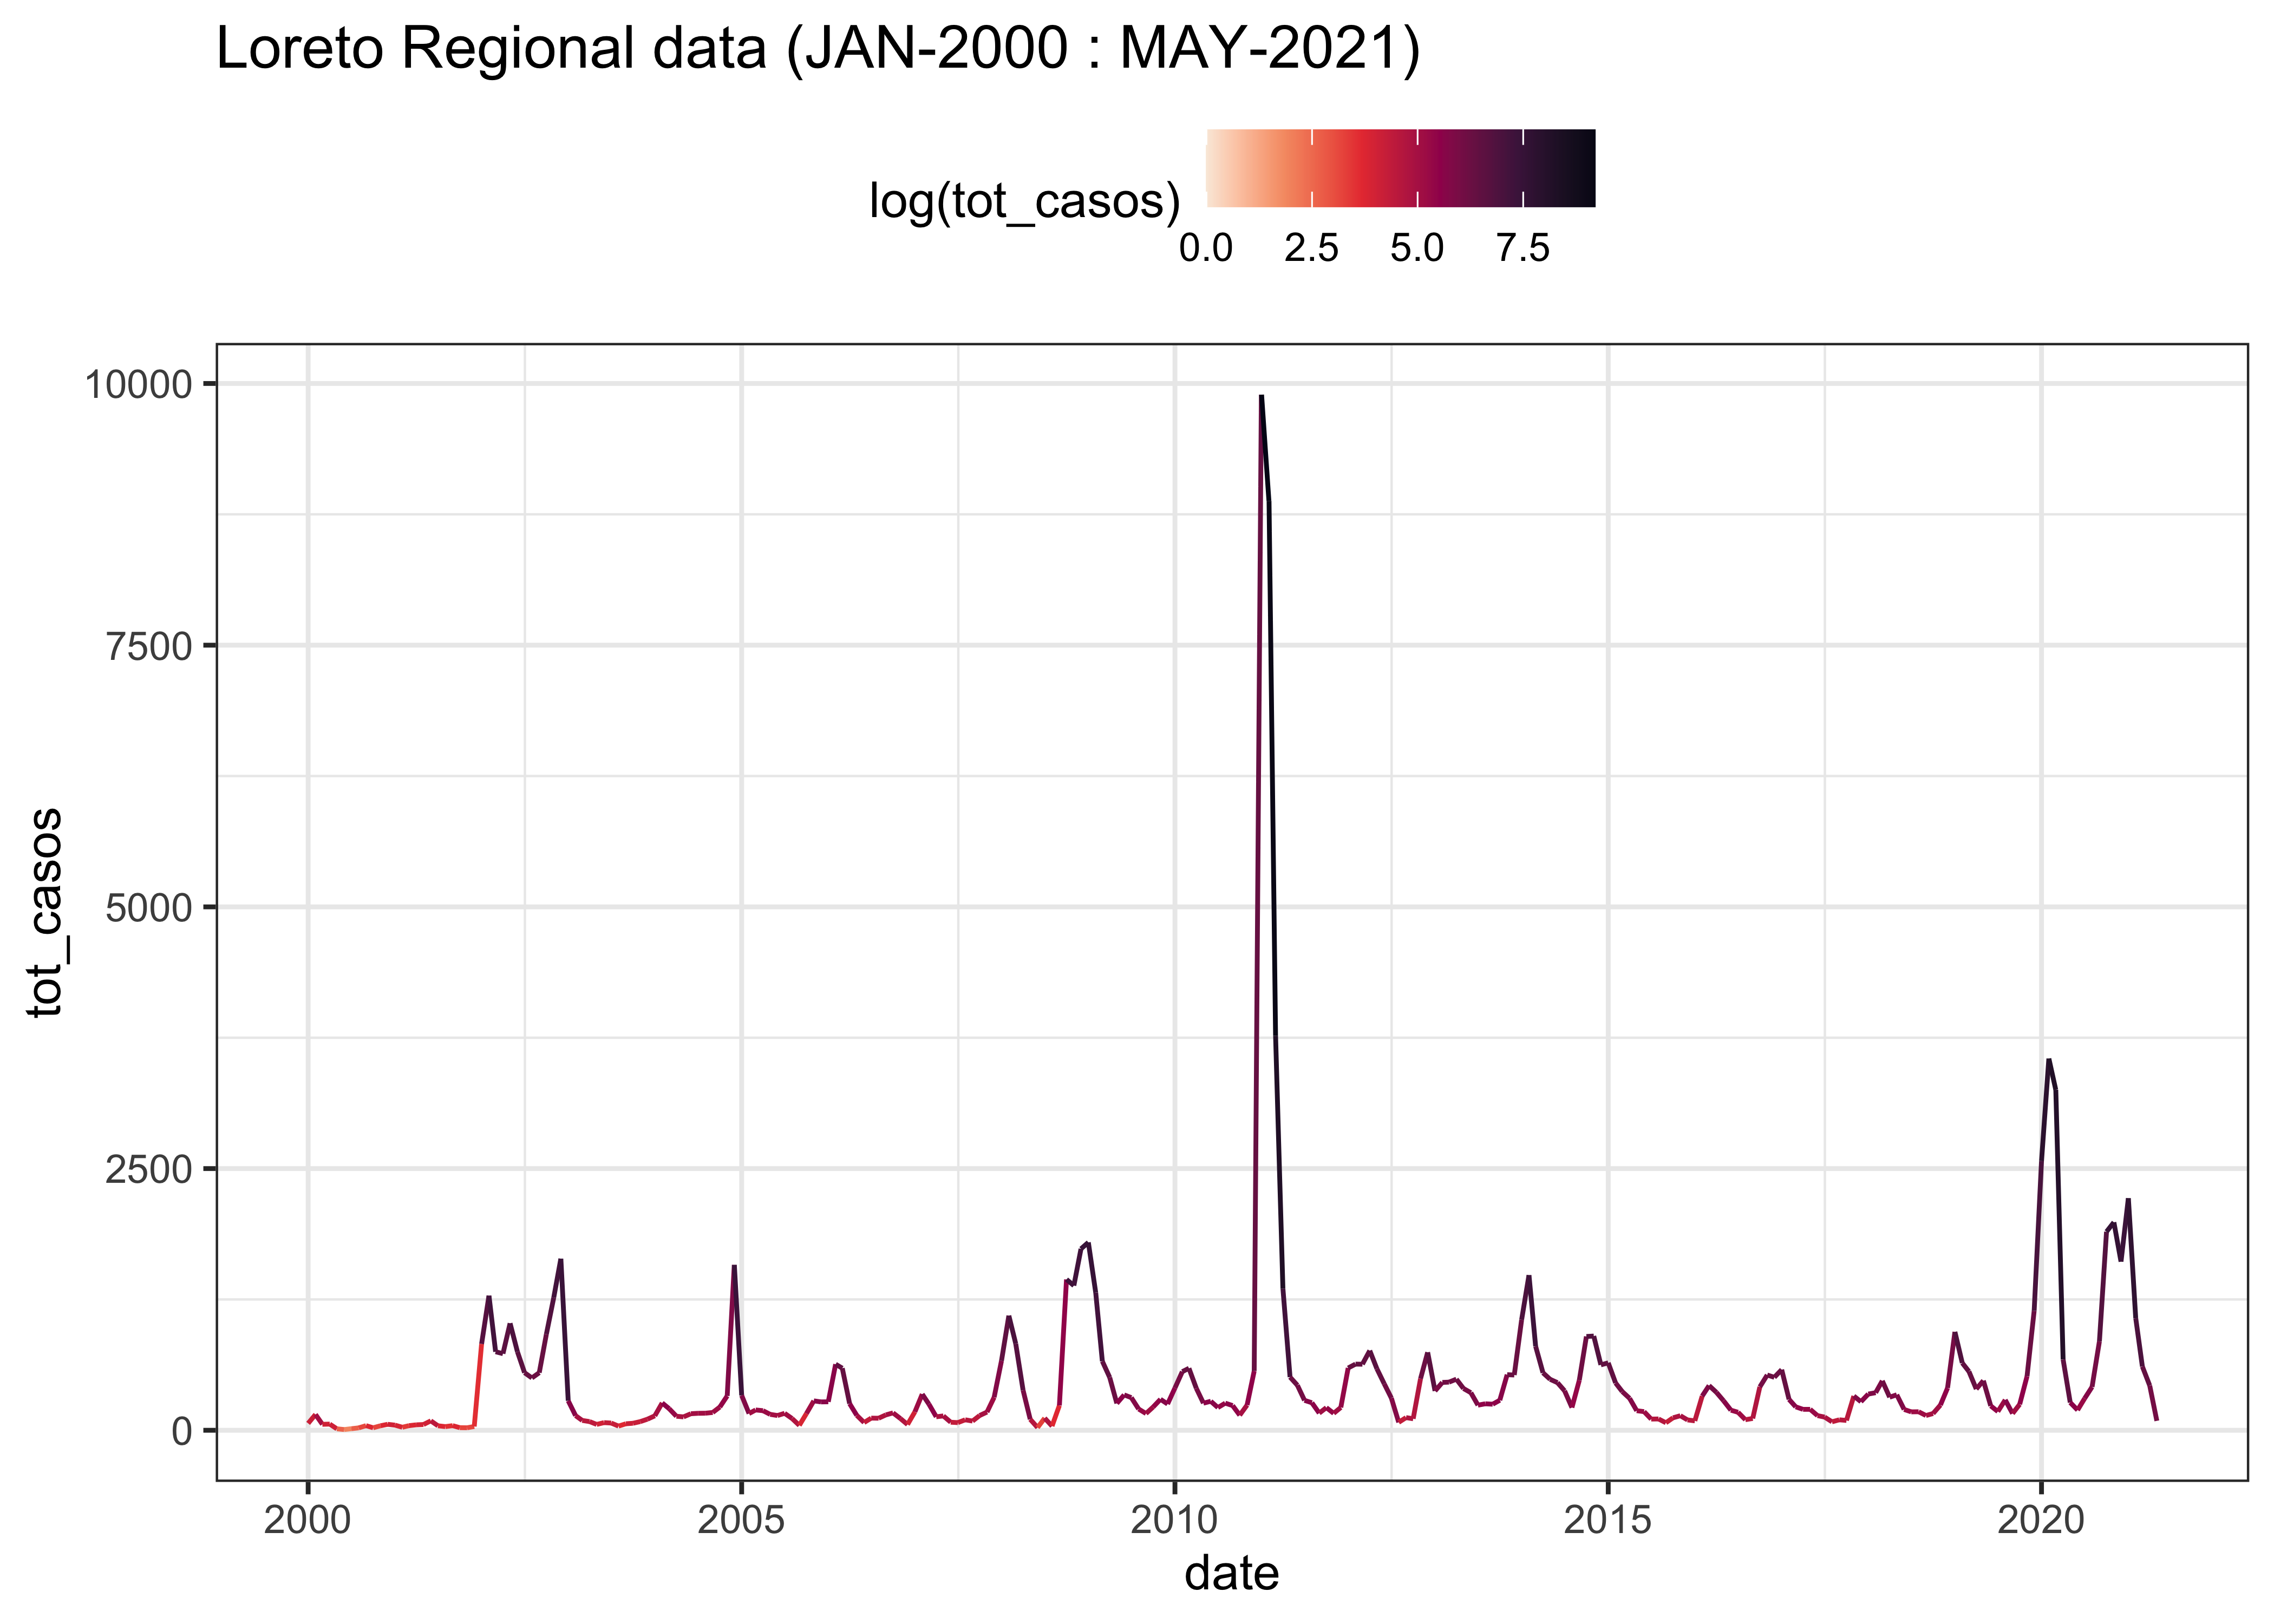
LOR_linelist %>%
  #filter(tipo_dx != "D") %>%
  mutate(date = ymd(fecha_not),
         yy = year(date),
         mm = month(date)) %>%
  group_by(yy, mm, provincia) %>%
  summarise(tot_casos = n()) %>%
  mutate(date = ymd(paste(yy,mm,"01", sep = "-"))) %>%
  ggplot(aes(x = date, y = tot_casos, col = log(tot_casos))) +
  scale_color_viridis_c(option = "rocket", direction = -1, na.value = "gray") +
  labs(title = "Loreto Regional data by provinces (JAN-2000 : MAY-2021)") +
  geom_line() +
  facet_wrap(.~provincia, scales = "free", ncol = 4) +
  theme_bw() +
  theme(legend.position = "top")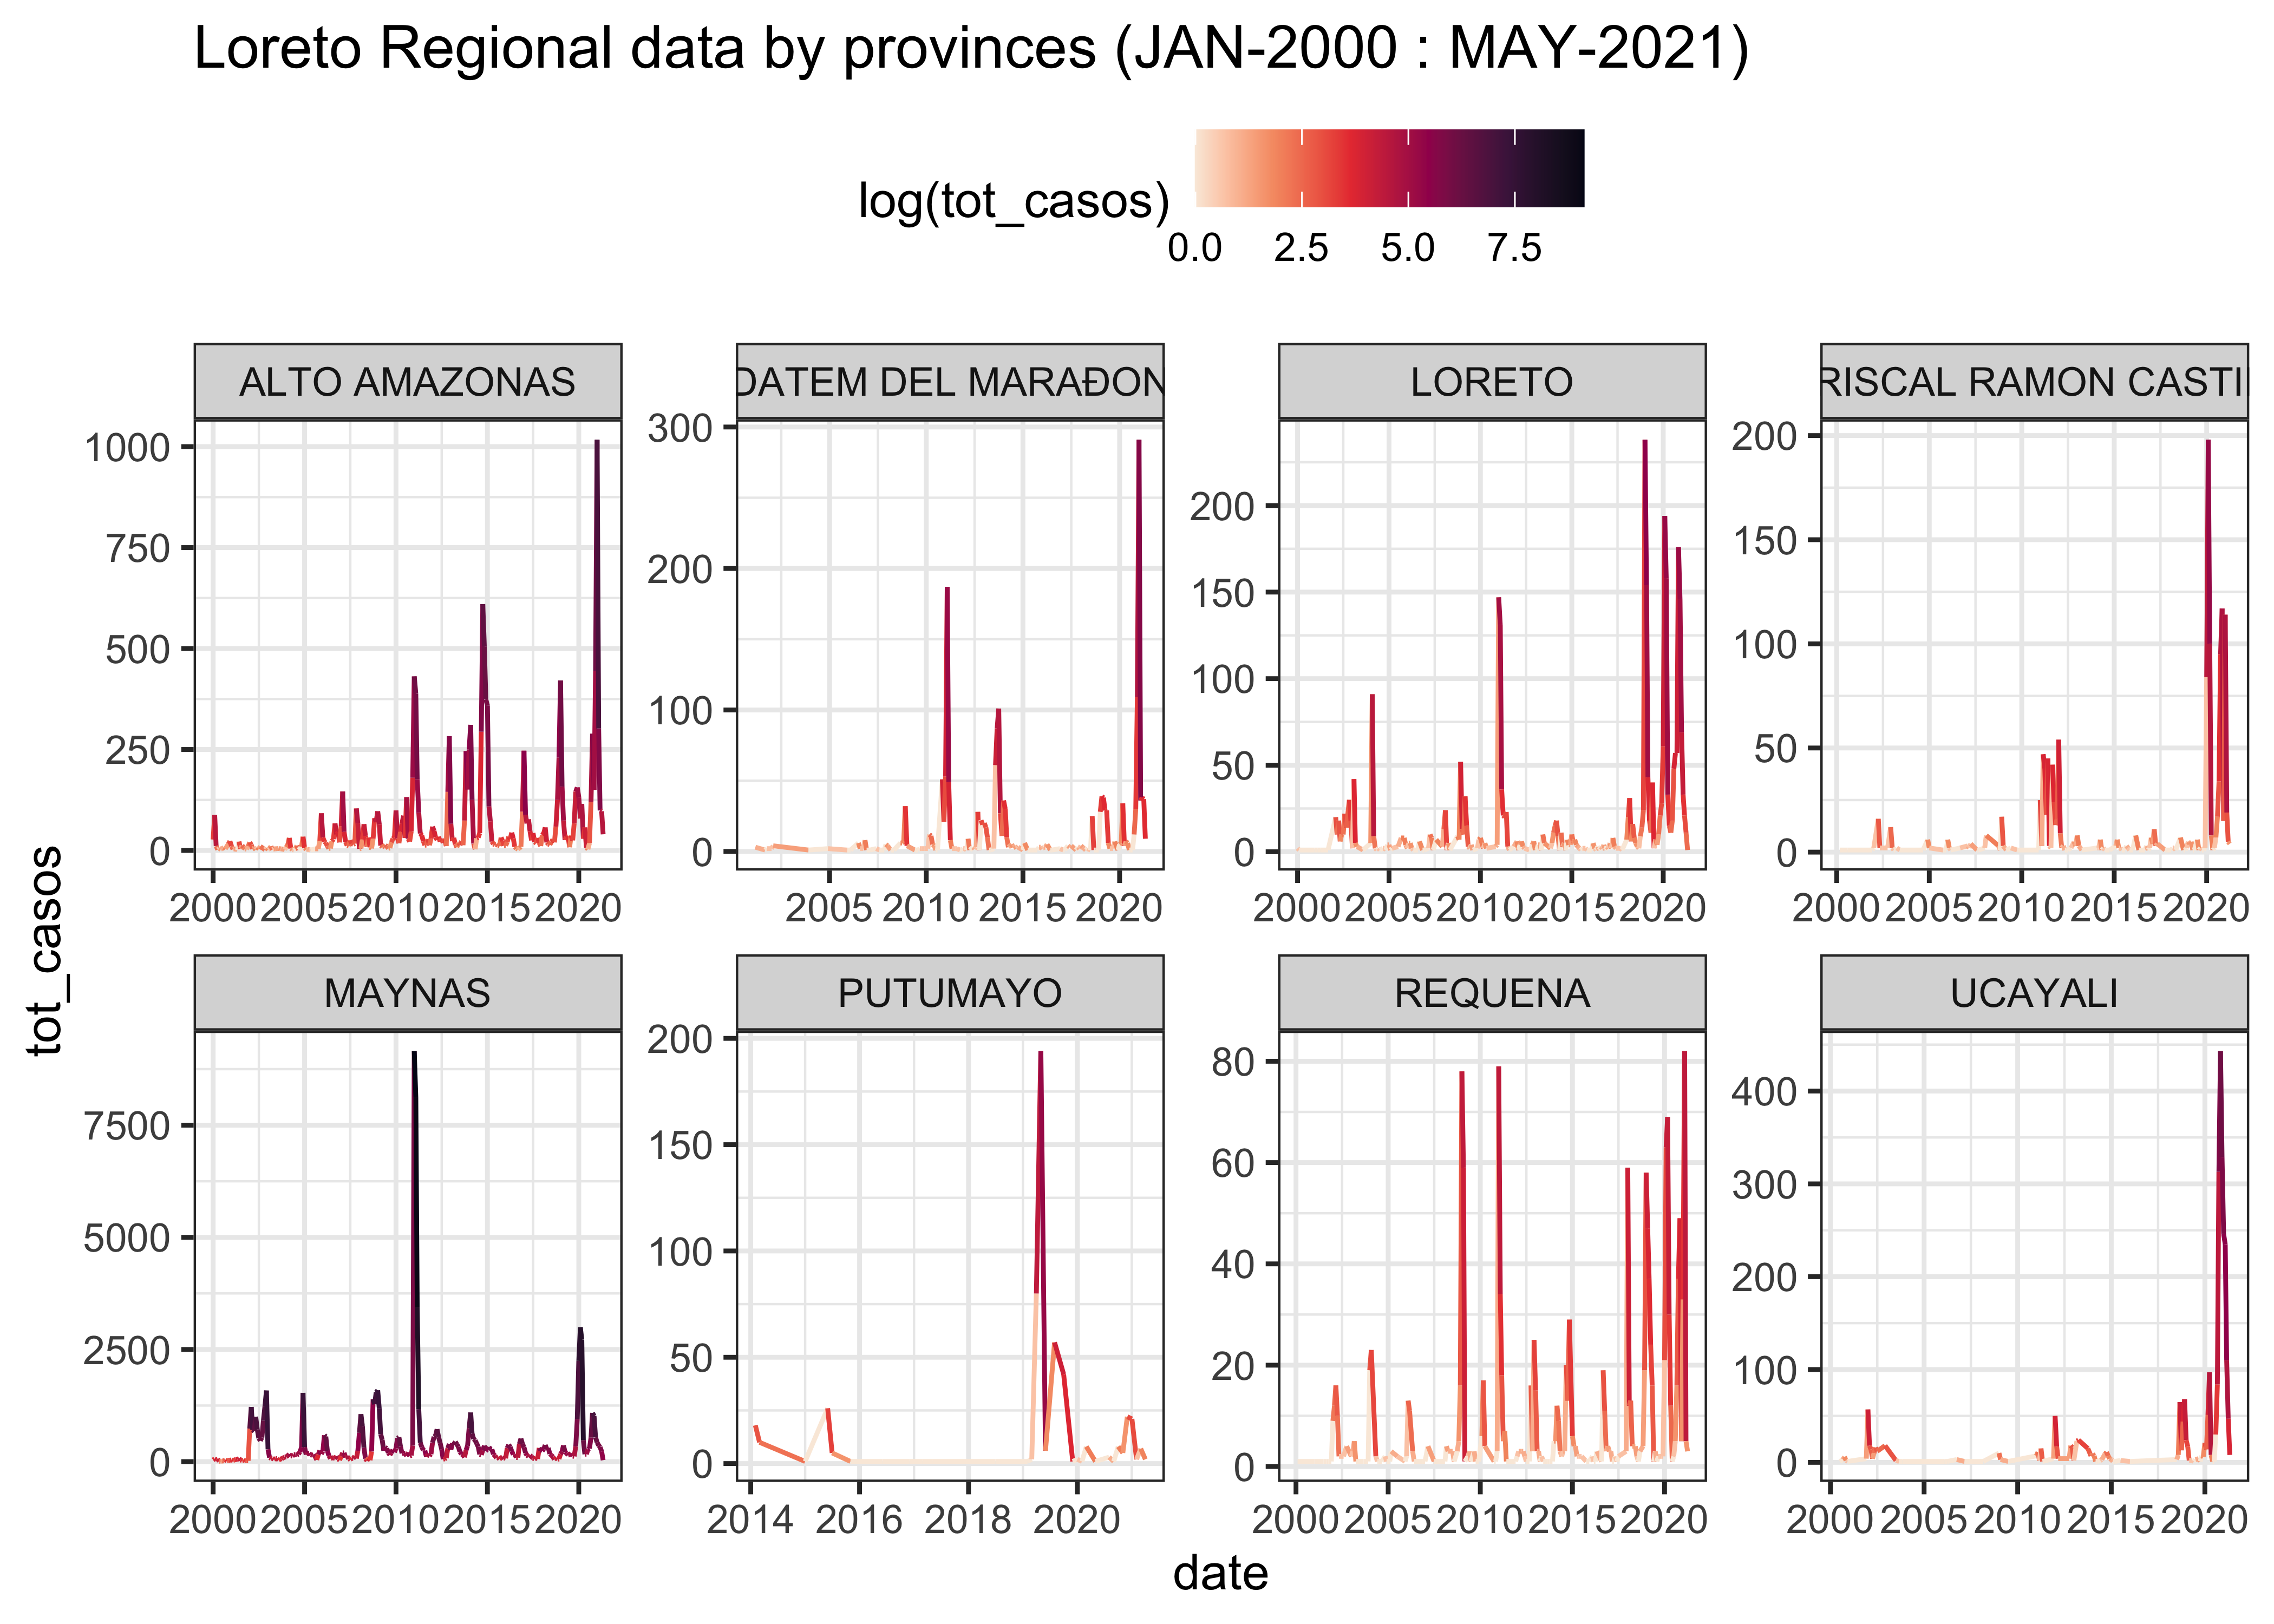
3.3.3 COMPARISON
a <- LOR_linelist %>%
  #filter(tipo_dx != "D") %>%
  mutate(date = ymd(fecha_not),
         yy = year(date),
         mm = month(date)) %>%
  group_by(yy, mm, departam) %>%
  summarise(tot_casos = n()) %>%
  mutate(date = ymd(paste(yy,mm,"01", sep = "-"))) %>%
  filter(departam == "LORETO",
         date > ymd("2014-11-01"),
         date < ymd("2021-06-01")) %>%
  ggplot(aes(x = date, y = tot_casos, col = log(tot_casos))) +
  scale_color_viridis_c(option = "rocket", direction = -1, na.value = "gray",
                        limits = c(0,10)) +
  labs(title = "Loreto Regional data (DIC-2014 : MAY-2021)") +
  scale_y_continuous(limits = c(0,4000)) +
  geom_line() +
  theme_bw() +
  theme(legend.position = "top")

b <- PER_district %>%
  mutate(week_proto = str_pad(Semana, width = 2, pad = "0"),
         date_proto = paste0(Year,"-W", week_proto,"-1"),
         date = ISOweek2date(date_proto),
         yy = year(date),
         mm = month(date)) %>%
  group_by(yy, mm, Departamento) %>%
  summarise(tot_casos = sum(Casos)) %>%
  mutate(date = ymd(paste(yy,mm,"01", sep = "-"))) %>%
  filter(Departamento == "LORETO",
         date > ymd("2014-11-01"),
         date < ymd("2021-06-01")) %>%
  ggplot(aes(x = date, y = tot_casos, col = log(tot_casos))) +
  scale_color_viridis_c(option = "rocket", direction = -1, na.value = "gray",
                        limits = c(0,10)) +
  labs(title = "National data (DIC-2014 : MAY-2021)") +
  scale_y_continuous(limits = c(0,4000)) +
  geom_line() +
  theme_bw() +
  theme(legend.position = "top")

plot_grid(a,b)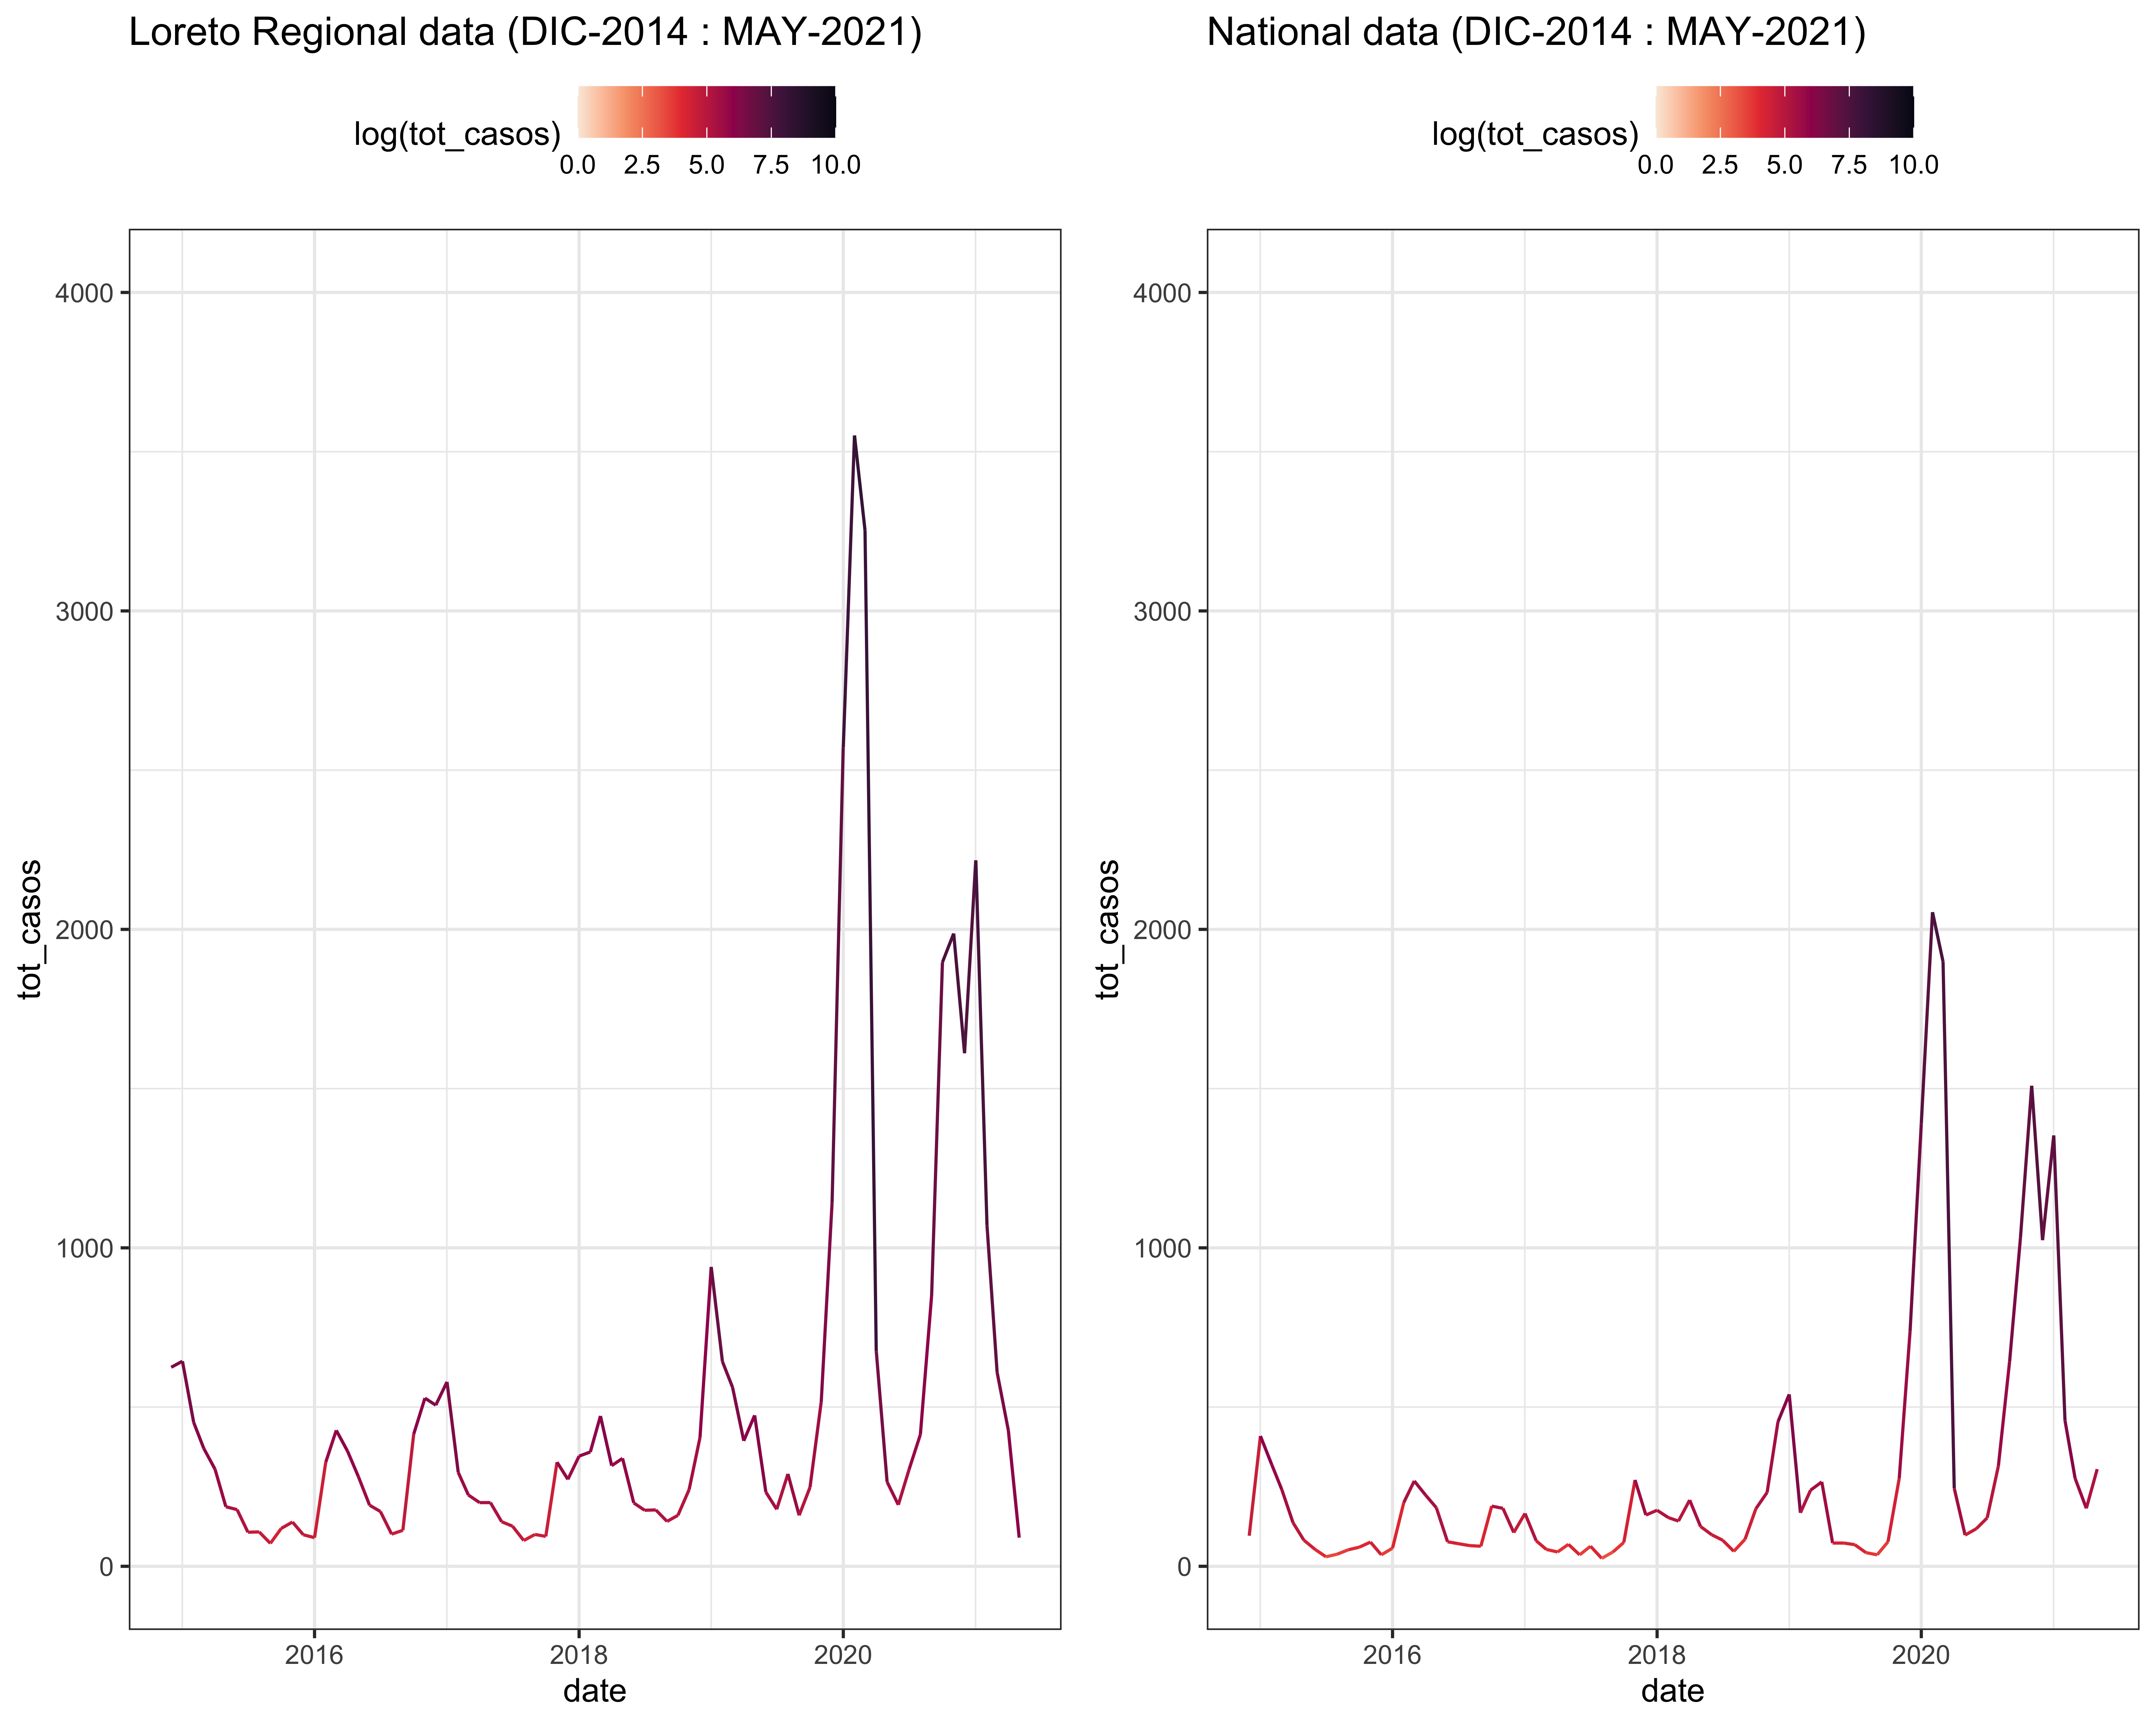
3.4 Export
- Regional data at monthly level was selected for analysis
LOR_linelist %>%
  mutate(date = ymd(fecha_not),
         yy = year(date),
         mm = month(date)) %>%
  group_by(ubigeo, departam, provincia, distrito, yy, mm) %>%
  summarise(tot_casos = n()) %>%
  mutate(date = ymd(paste(yy,mm,"01", sep = "-"))) %>%
  write_csv("_data/LOR_dengue.csv", na = "")