# Install and load required packages
library(sf)
library(ggplot2)
library(rnaturalearth) Load the required libraries and data
# Load the world map data
world <- ne_countries(scale = "medium",
                      returnclass = "sf")

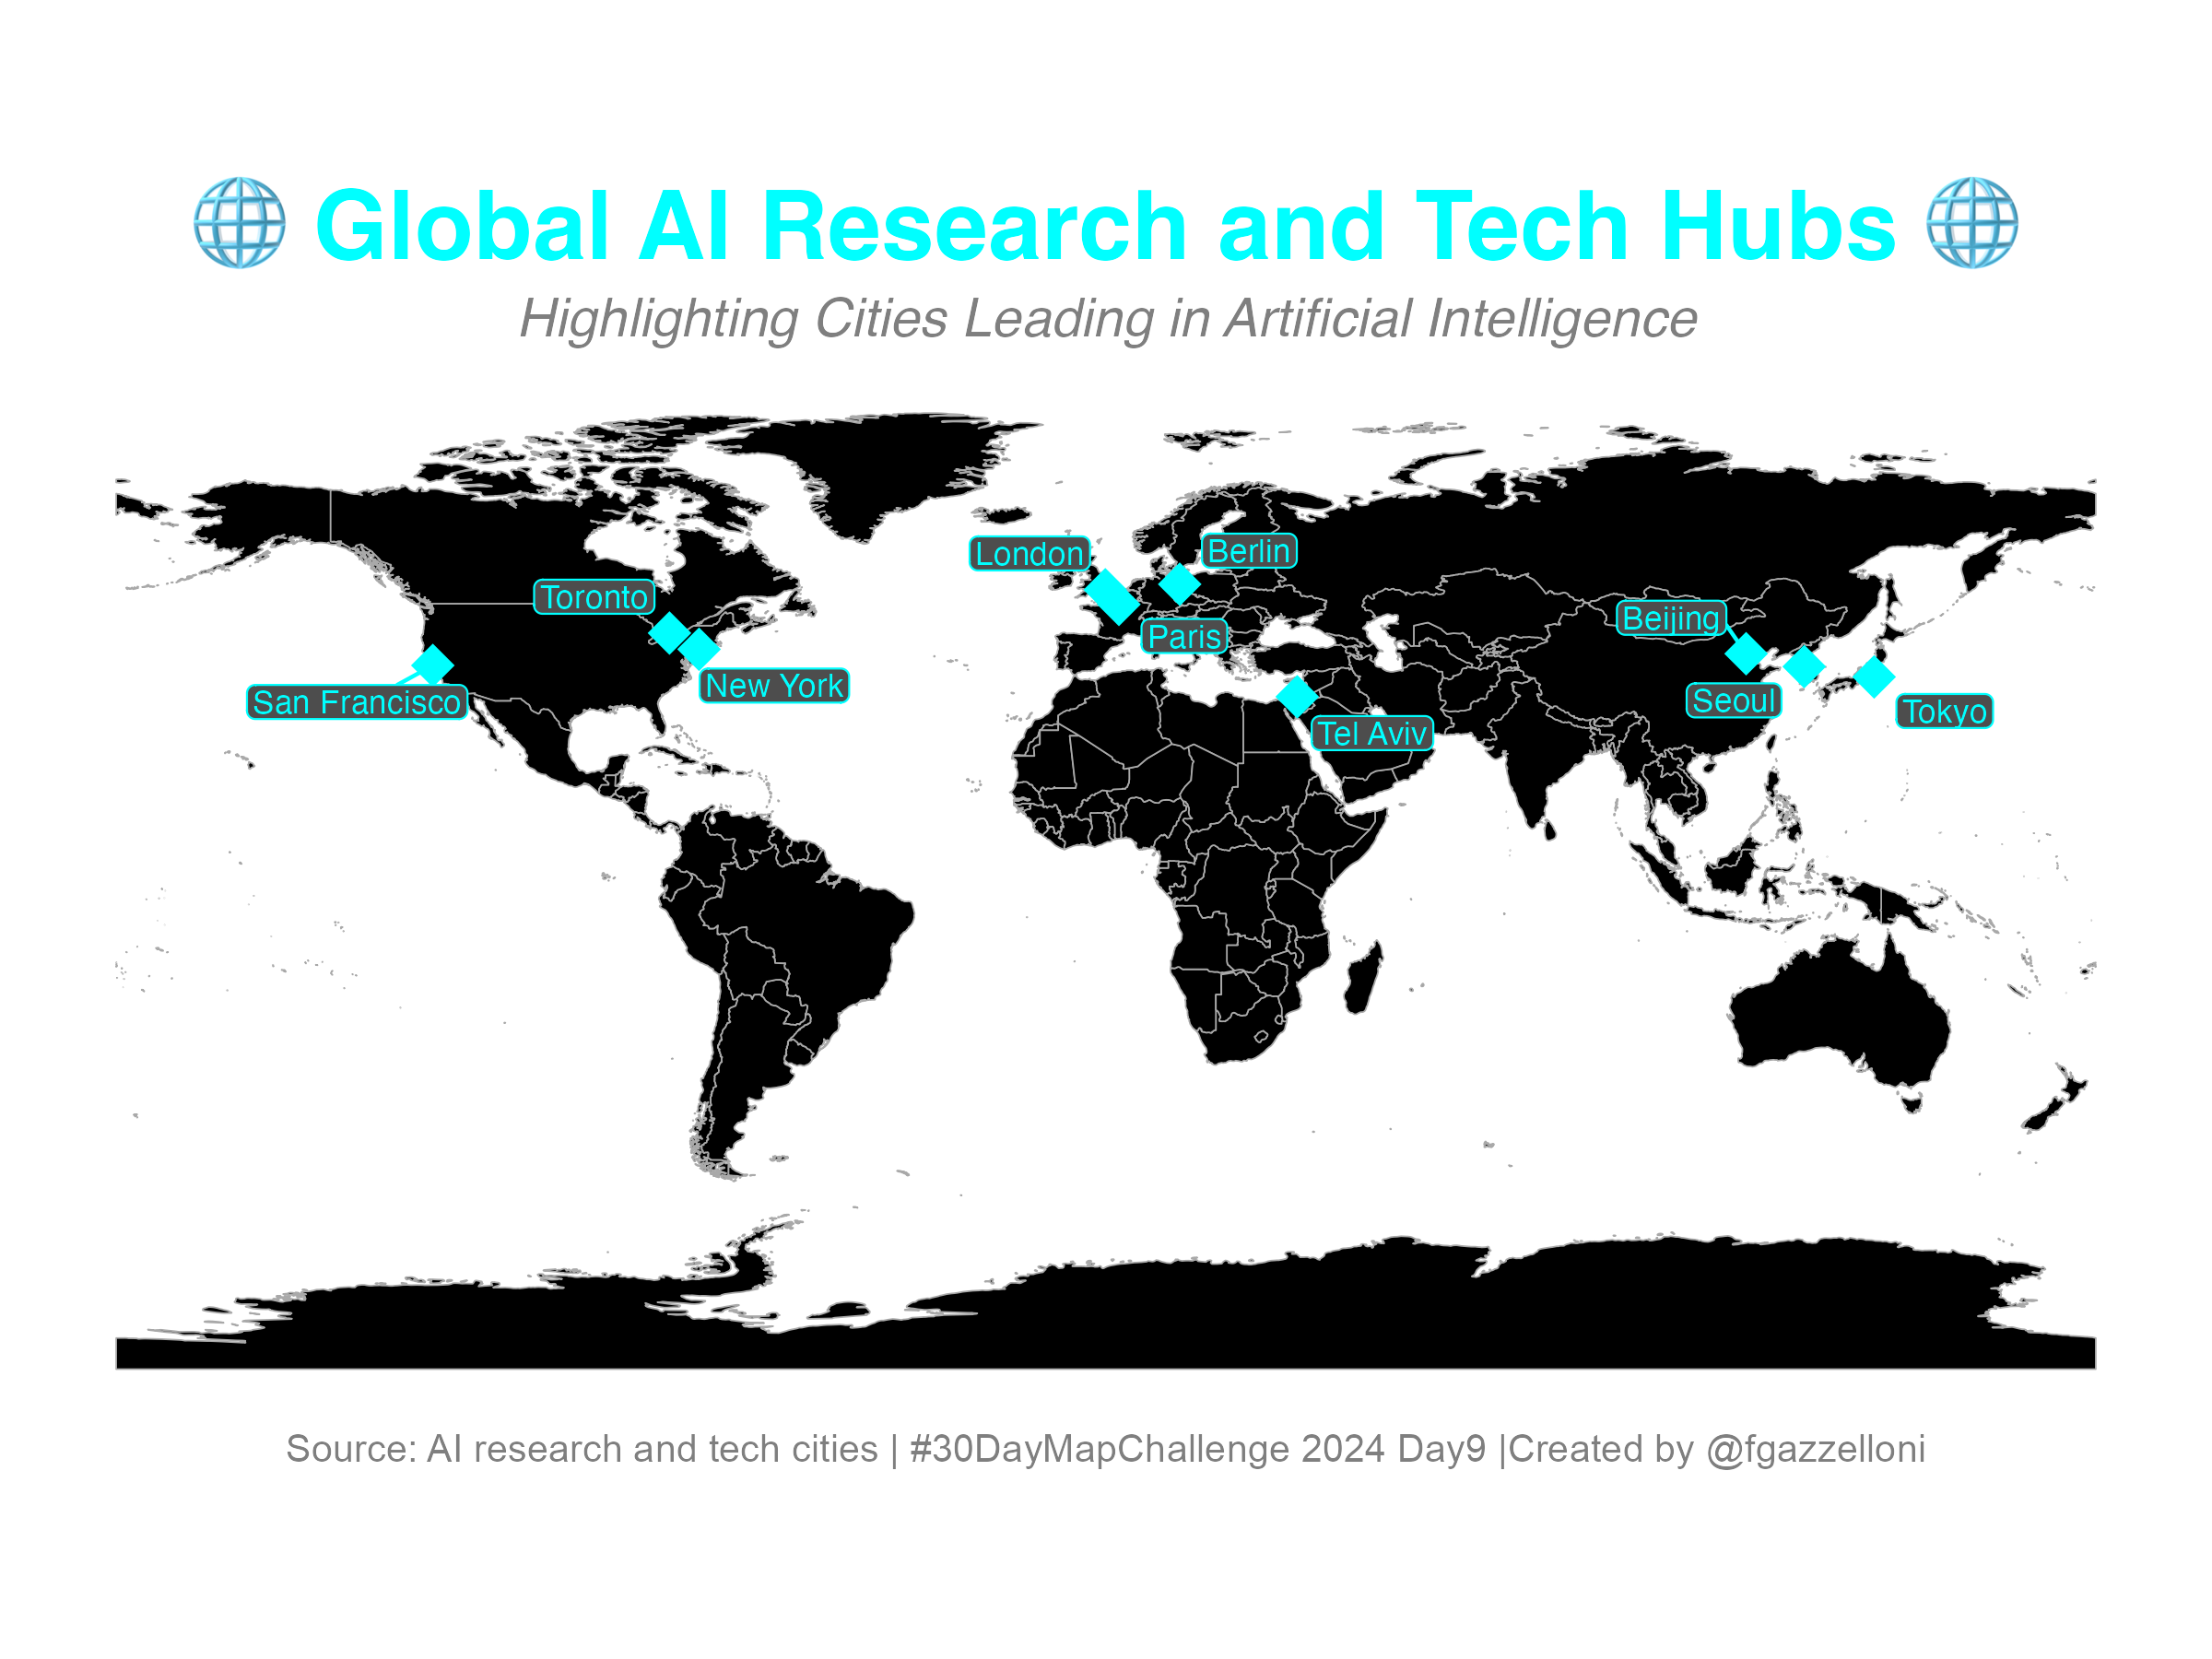
# Create a data frame with notable AI research and tech hubs
ai_hubs <- data.frame(
  city = c("San Francisco", "New York", "London",
           "Beijing", "Toronto", "Tokyo",
           "Tel Aviv", "Paris", "Seoul", "Berlin"),
  country = c("USA", "USA", "UK",
              "China", "Canada", "Japan",
              "Israel", "France", "South Korea", "Germany"),
  lon = c(-122.4194, -74.0060, -0.1276,
          116.4074, -79.3832, 139.6917,
          34.7818, 2.3522, 126.9780, 13.4050),
  lat = c(37.7749, 40.7128, 51.5074,
          39.9042, 43.6532, 35.6895,
          32.0853, 48.8566, 37.5665, 52.5200))

# Convert AI hubs data to an sf object
ai_hubs_sf <- st_as_sf(ai_hubs, coords = c("lon", "lat"),
                       crs = 4326, agr = "constant")
# Plot the "AI Only" map
ggplot(data = world) +
geom_sf(fill = "black",
color = "darkgray",
linewidth = 0.2) + # Dark mode background
geom_sf(data = ai_hubs_sf,
size = 5,
color = "cyan",
shape = 18) + # Neon-colored AI hubs
ggrepel::geom_label_repel(data = ai_hubs,
aes(x = lon, y = lat,
label = city),
color = "cyan", fill="gray30",
label.padding = 0.1,
box.padding = 0.3,
size = 3) + # Neon-colored city labels
labs(title = "🌐 Global AI Research and Tech Hubs 🌐",
subtitle = "Highlighting Cities Leading in Artificial Intelligence",
caption = "Source: AI research and tech cities | #30DayMapChallenge 2024 Day9 |Created by @fgazzelloni") +
ggthemes::theme_map() +
theme(plot.title = element_text(size = 25,
face = "bold",
color = "cyan",
hjust = 0.5),
plot.subtitle = element_text(size = 14,
face = "italic",
color = "gray50",
hjust = 0.5),
plot.caption = element_text(size = 10,
family = "Arial",
color = "gray50",
hjust = 0.5))Save the plot as a PNG file
ggsave("day9_ai.png",
       bg = "white",
       width = 8, height = 6,
       dpi = 300)